3736
Hardware and Procedure for Testing and Evaluation of a pTx 16-Element Transmit/ 32-Element Receive Array Coils at 9.4T.1Max Planck Institute for Biological Cybernetics, Tübingen, Germany, 2Biomedical Magnetic Resonance, University of Tübingen, Tübingen, Germany
Synopsis
Keywords: High-Field MRI, High-Field MRI, RF coil testing hardware
Motivation: Parallel transmission (pTx) is a very useful method for minimizing peak SAR and RF field inhomogeneity at UHF. To simplify the design, individual elements of pTx RF arrays are connected directly to scanner plugs and not easily accessible. In addition, in the case of a Tx-only/Rx-only (ToRo) setup, safety regulations require testing the Tx-only array without Rx-array.
Goal(s): To develop testing hardware and procedure for adjusting and evaluating pTx 16-channel Tx/32-channel Rx 9.4T array coils.
Approach: Electronic hardware and procedure was designed, constructed, and tested.
Results: The hardware was constructed and successfully used in development of the pTx 16Tx/32Rx human head ToRo-array coil.
Impact: We developed testing hardware and procedure for pTx-coils and used them in development of the human head ToRo-array. The developed hardware allows testing any pTx 9.4T RF coil with Rx-channel count up to 32 and Tx-channel count up to 16.
Purpose
To develop testing hardware and procedure for parallel transmit (pTx) 16-channel Tx/32-channel receive (Rx) 9.4T array coils.Introduction
Parallel transmission (pTx) suggested earlier (1,2) has been proven to be a very useful method for minimizing peak SAR and RF field (flip angle) inhomogeneity at ultra-high field (UHF, >7T) (3-5). The pTx method implies using a multi-channel Tx-system connected to individual Tx-array elements. Currently, commercial scanners are equipped up to 16 high power (<2 kW) Tx-channels. To avoid losses and simplify the design, individual Tx- and Rx-channels of a pTx RF array coil are often connected directly to scanner plugs and not easily accessible during the coil development. In addition, in the case of a two-layer Tx-only/ Rx-only (ToRo) (6) setup, safety regulations (7) require testing the Tx-only array without Rx-array inside, presence of which may substantially alter the RF field. In this work, we developed a set of testing hardware and used them for development and evaluation of a 9.4 T human head pTx ToRo-coil consisting of 16 Tx-elements (8,9) and 32 Rx-elements.Methods
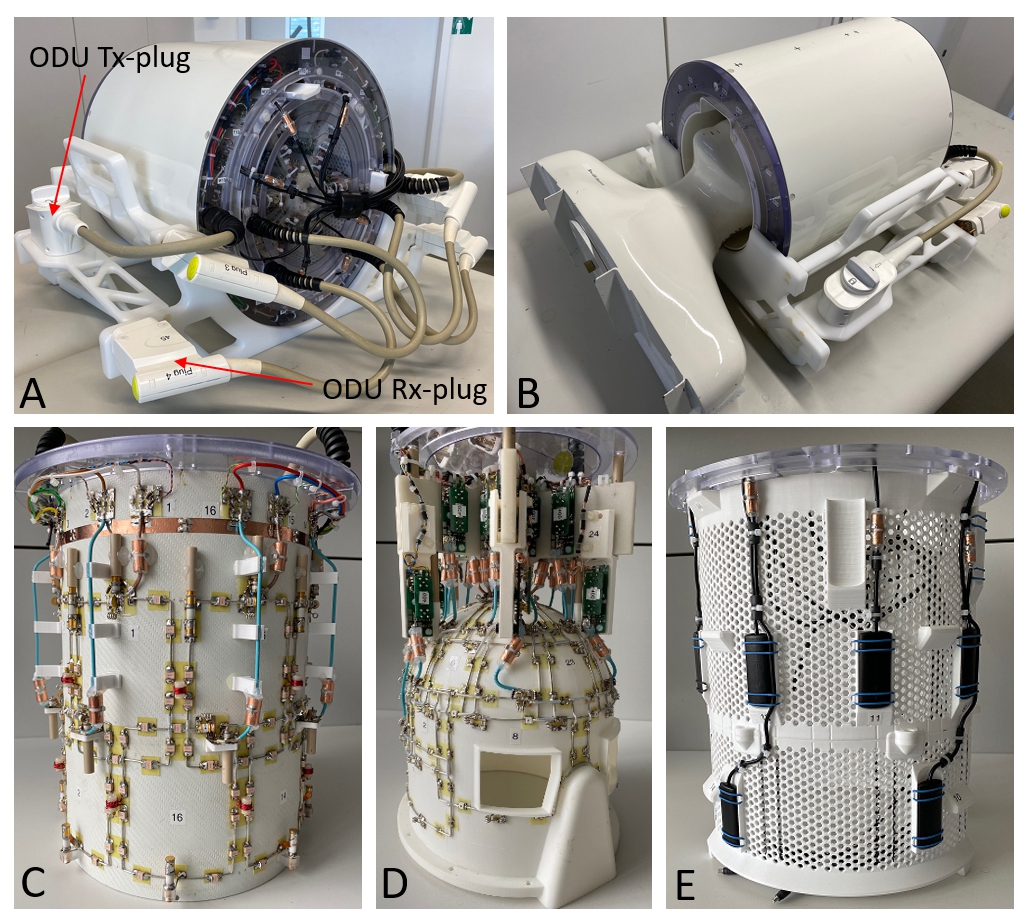
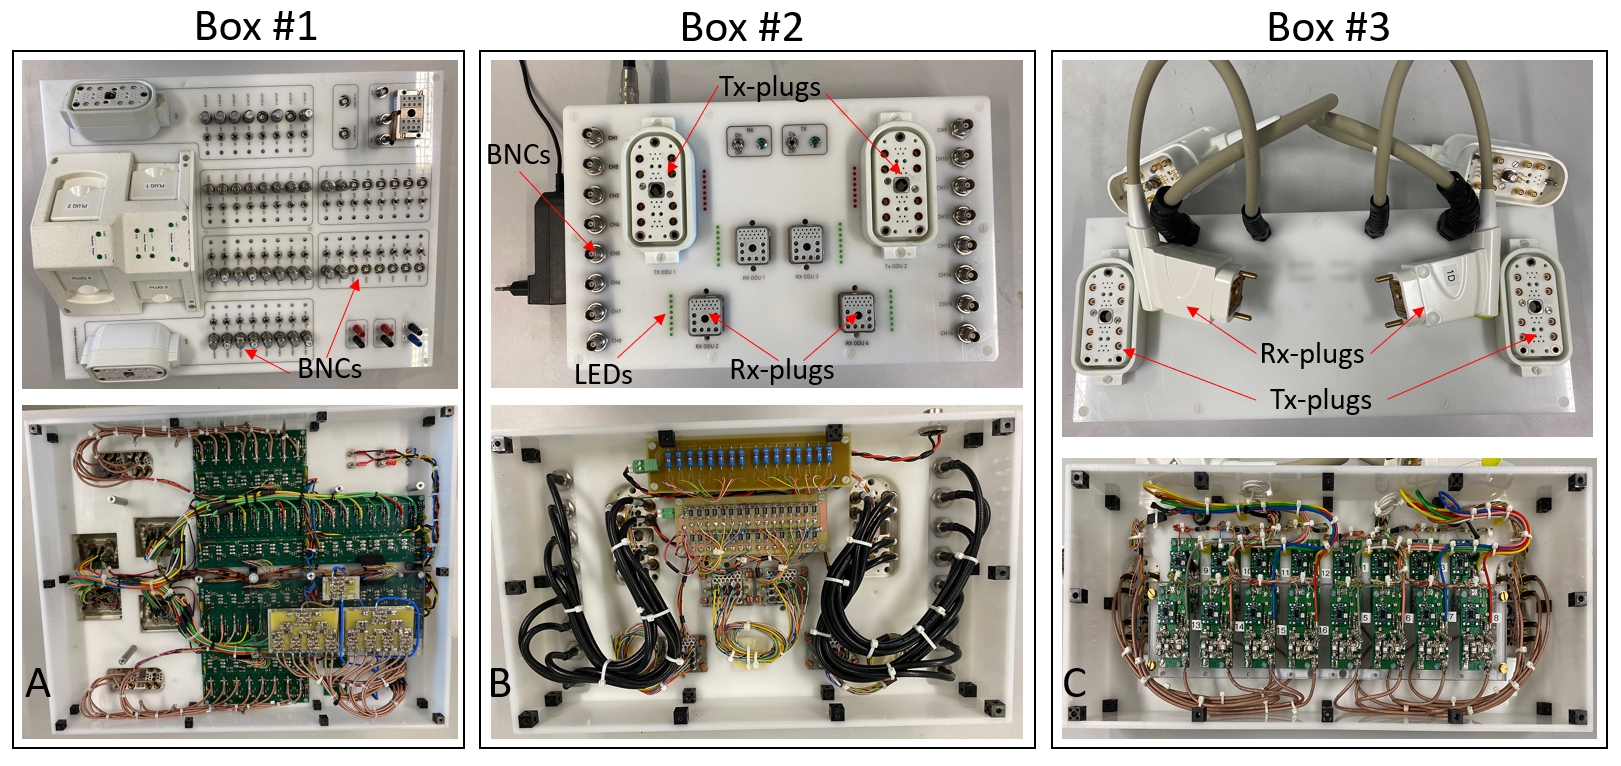
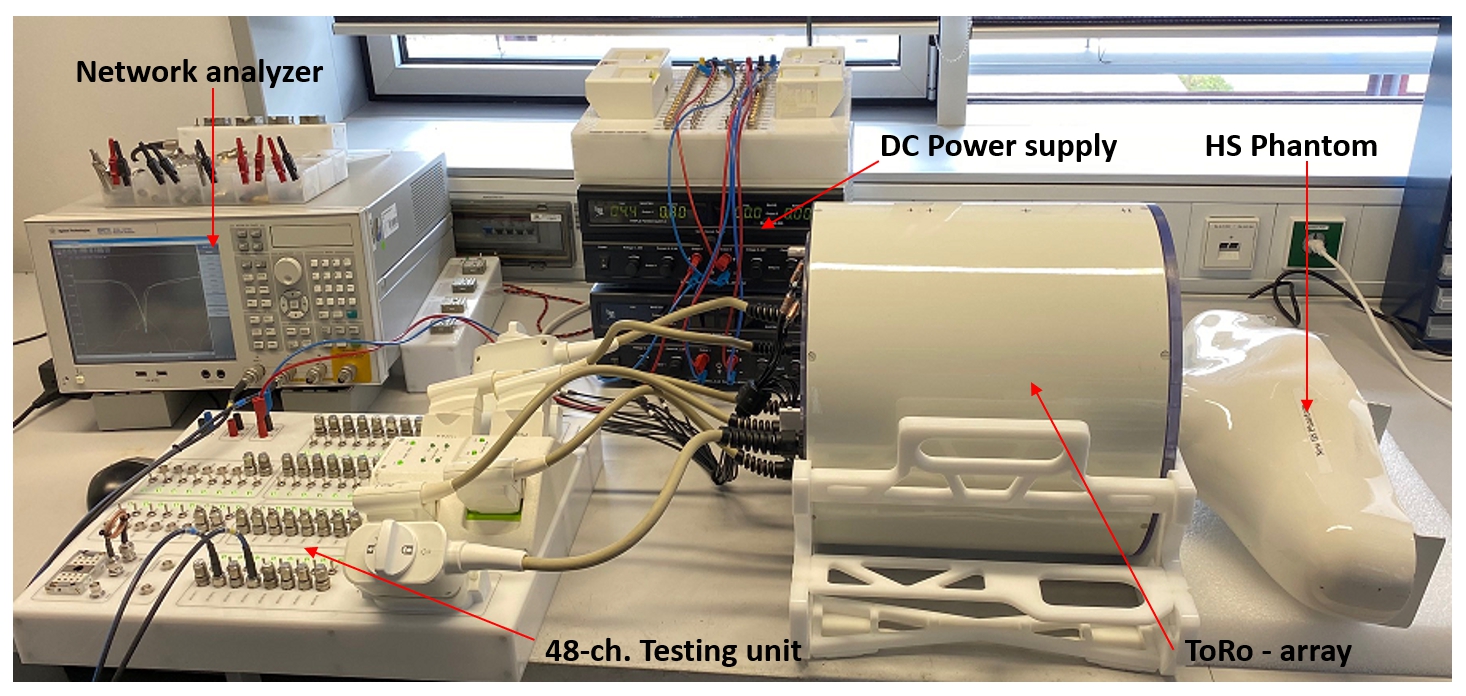
Fig.1 shows the 16-Tx/32-Rx ToRo-coil (Figs.1A,B) including the 16-element double-row Tx-array (Fig.1C) and 32-element four-row Rx-array (Fig.1D). In addition, the coil includes a layer (Fig.1E) of B0-field probes placed between two arrays. All the channels of the ToRo-coil are directly connected to the system plugs (Fig.1A). During the development, all 48 Tx- and Rx-elements require numerous adjustment steps including tuning, matching, decoupling, active detuning, etc. To simplify the procedure, we developed a testing box (Fig.2A), where all ToRo-array channels can be connected and accessed through BNC connectors. Fig.3 shows the entire testing setup. The box contains 48 switches turning ON or OFF any of the 48 active PIN diode detuning circuits that allows adjusting any number of elements with others being detuned. Corresponding LEDs indicate which circuits are ON. In addition, the box incorporates a 16-way splitter creating a CP mode (45-deg phase shift between adjacent elements in each row). Applying power to the Tx-array driven in the CP mode allows checking the active detuning and level of preamplifier protection. The 48-channel testing box is relatively large. Therefore, for adjustment of the Tx-array alone, we developed a smaller testing box (Fig.2B), in which only the 16 Tx-channels are forwarded to BNC connectors. Four Rx-system plugs (Fig.2B) provide active detuning for the Rx-array. LEDs indicate functioning of the active detuning. Finally, for testing the Tx-array alone and acquiring B1+ maps without Rx-array, we developed a third testing box, which contains 16 TR-switches with preamplifiers. The box transforms Tx-array into a transceiver array. pTx array and testing units were developed for Siemens Magnetom 9.4T human imaging system. Experimental evaluation of the array included measuring B1+ maps for the Tx-array alone, combined with the Rx-array, and both Rx-array and field probes. These measurements were performed for 11 modes of the Tx array loaded by a head and shoulder phantom including the CP mode, CP1 mode (90-deg phase shift between adjacent elements), two worst case SAR modes, and 7 random modes. For quantitative comparison, all measured B1+ maps (Tx-array alone, with Rx-array, with Rx-array and field probes) and RF test modes were coregistered. The agreement between these maps was assessed by voxel-wise scatter plots and the Pearson correlation coefficient.Results and Discussion
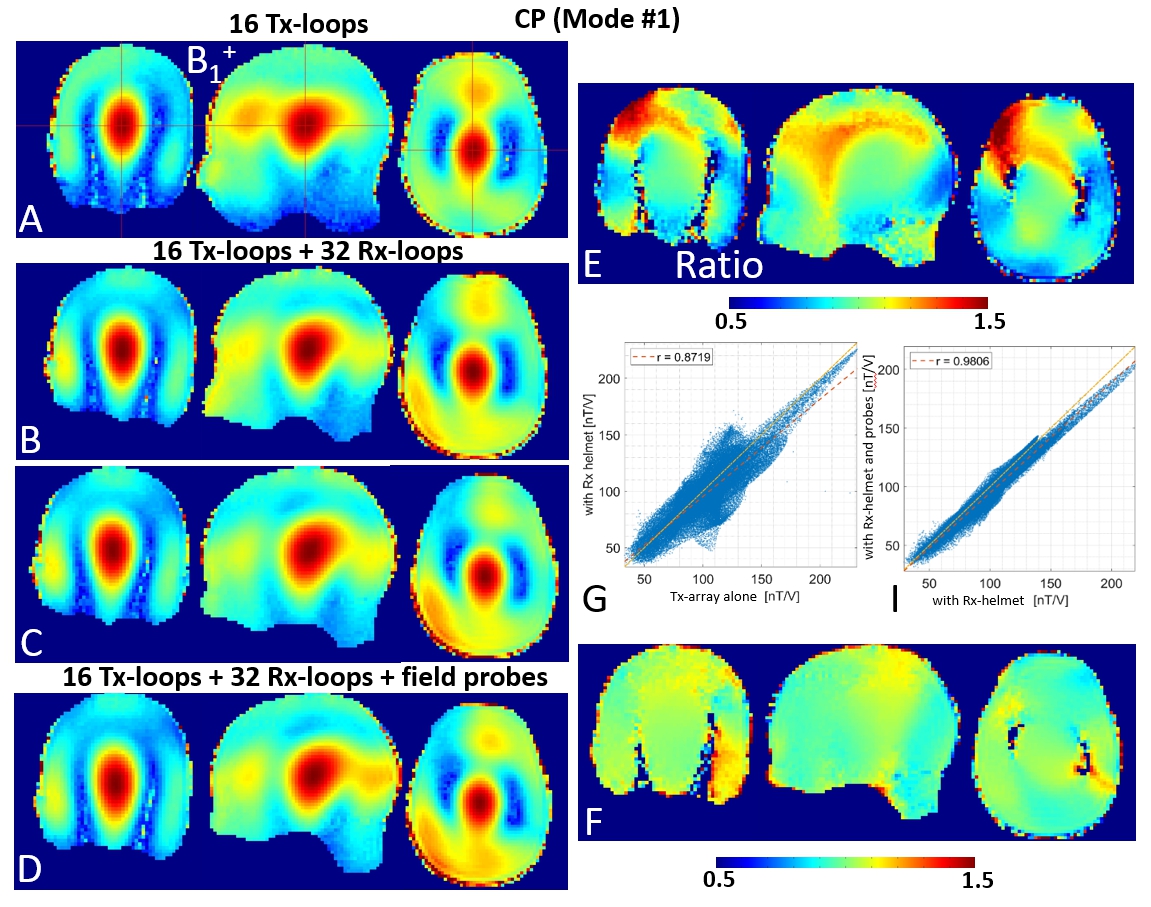
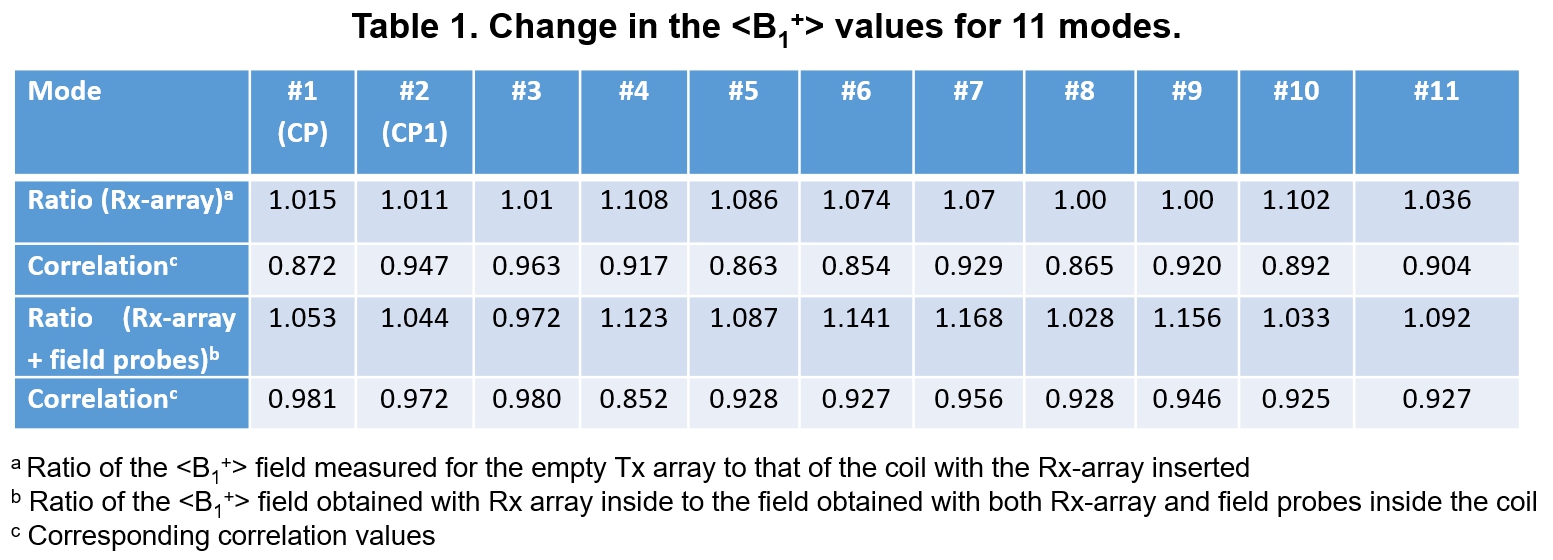
All testing boxes were constructed and tested in development of the pTx 16-Tx/32-Rx ToRo-coil (Fig.1). Using these boxes, all elements of the ToRo-array were individually adjusted in terms of tuning, matching, decoupling, preamplifier decoupling (Rx-array only), active and passive (Rx-array only) detuning. After constructing, the coil was tested in the scanner using the head-and-shoulder phantom (Fig.1B). Fig.4 shows an example of B1+ maps measured for the ToRo-array driven in the CP mode. The figure also includes corresponding ratios of the maps (Figs.4E,F) and correlation plots. Table1 presents average ratios for all 11 modes showing decrease in the coil Tx-efficiency due to insertion of the Rx-array and field probes. The table also shows correlation values, which characterize alteration of B1+ distribution. As seen in the table, the insertion of the Rx-array leads to a smaller than 11% decrease in the Tx-efficiency. For the most uniform modes (CP and CP1) the decrease measured less than 2%. High correlation (above 0.85) indicates relatively small changes in the filed distribution.Conclusion
We developed testing hardware and procedure for pTx coils and used them in development of the 16-channel Tx/ 32-channel Rx 9.4T human head array coil. The developed hardware allows testing any pTx 9.4T RF coil with Rx-channel count up to 32 and Tx-channel count up to 16.Acknowledgements
Funding by the European Union (ERC Advanced Grant SpreadMRI, Number: 834940) is gratefully acknowledged.References
1) Katscher U, Börnert P, Leussler C, van den Brink JS. Magn Reson Med 2003;49(1):144-150. 2) Zhu Y. Magn Reson Med 2004;51(4):775-784. 3) Cao Z, Yan X, Gore JC, Grissom WA. Magn Reson Med 2020;83(6):2331-2342. 4) Herrler ü, Liebig P, Gumbrecht R, Ritter D, Schmitter S, Maier A, Schmidt M, Uder M, Doerfler A, Nagel AM. Magn Reson Med 2021;85:3140–3153. 5) Yetisir F, Poser BA, Grant PE, Adalsteinsson E, Wald LL, Guerin B. Magn Res Imag 2022;93:87-96. 6) Barberi EA, Gati JS, Rutt BK, Menon RS. Magn Reson Med 2000;43(2):284-289. 7) Hoffmann J, Henning A, Giapitzakis IA, Scheffler K, Shajan G, Pohmann R, Avdievich NI. NMR Biomed 2016;29(9):1131-1144. 8) Shajan G, Kozlov M, Hoffmann J, Turner R, Scheffler K, and Pohmann R. Magn Reson Med 2014;71:870–879. 9) Nikulin AV, Scheffler K, Avdievich NI. 30th Annual Meeting and Exhibition of ISMRM 2022, London, UK, p.3315.Figures