3732
Radio-Frequency Energy-Induced Heating for hot spots with the same SAR averaged over 0.1 gram without perfusion1Neurophysics, Max Planck Institute for Human Cognitive and Brain Sciences, Leipzig, Germany, 2Université Paris-Saclay, CEA, CNRS, BAOBAB, NeuroSpin, Gif-Sur-Yvette, France
Synopsis
Keywords: Safety, Safety, temperature rise
Motivation: Evaluating induced temperature rise (ΔT) in human tissue at a hot spot.
Goal(s): Comprehensive analysis of ΔT by examining cases where SAR0.1 g (SAR, specifically averaged over a mass of 0.1 gram of human tissue) remains constant but the spatial distribution of SAR inside and outside the averaging volume is different.
Approach: Analytical solutions were obtained for estimating ΔT as a result of the SAR distribution exhibiting spherical symmetry with both uniform and Gaussian distributions.
Results: Using SAR0.1g without consideration of the distribution of SAR within and outside the enclosed volume cannot be a reliable tool for estimation of ΔT.
Impact: We have obtained analytical results on the effect of the SAR distribution on the conservatively estimated ΔT in different RF exposure scenarios.
Background
SAR is used for evaluating induced heating effects in human tissue at a hot spot. SAR, specifically averaged over a mass of 0.1 gram of human tissue (SAR0.1g), serves as an input parameter in assessing the potential temperature rise (ΔT) caused by RF energy at the hot spot in some studies1. When direct ΔT calculation cannot be made, SAR0.1g is used by some researchers as a metric for comparison between the expected ΔT for hot spot of different types or geometry of implants. In our previous work, we presented analytical solutions for estimating ΔT as a result of the SAR distribution exhibiting spherical symmetry with both uniform and Gaussian distributions2. Here we aim at offering a comprehensive analysis of ΔT by examining cases where SAR0.1g remains constant but the spatial distribution of SAR inside and outside the averaging volume is different.Methods
We consider for convenience the scenario of a sphere of radius R enclosed in an infinite medium. Due to the inherent symmetry, the temperature distribution inside and outside the sphere depends solely on the radial distance r from the center, provided that the SAR distribution itself adheres to spherical symmetry. If the inner sphere is subjected to a uniform SAR (referred to as SAR0), and there exists no SAR contribution beyond the boundaries of the sphere, we were able to derive analytical solutions for the transient temperature changes at the center of the sphere, where the maximum ΔT occurs1.$$$\triangle{T}(t)=\frac{{\rho}SAR_{0}}{2k}\cdot{R}^{2}\cdot(1-\sqrt{\frac{4{\alpha}t}{{\pi}R^{2}}}e^{-\frac{R^{2}}{4{\alpha}t}}-(1-2\frac{{\alpha}t}{R^{2}})\cdot{erf}(\frac{R}{2\sqrt{{\alpha}t}}))$$$ (1)
where $$$\alpha=k/(\rho\cdot{C})$$$ is the diffusivity coefficient, k, ρ and C are thermal conductivity, density and the specific heat of the tissue, respectively.
For $$$R\rightarrow\infty$$$, the solution is
$$$\triangle{T}(t)=\frac{SAR_{0}}{C}\cdot{t} $$$ (2)
This last case with SAR0 = SAR0.1g is label as ‘linear’.
For a SAR source with a Gaussian distribution (standard deviation of σ, b is the SAR value at the center of the Gaussian) located in an infinite medium of uniform properties:
$$$SAR(x,y,z)=b\cdot{e}^{-\frac{x^{2}+y^{2}+z^{2}}{2\cdot{\sigma^{2}}}}$$$ (3)
the analytical transient solution in the center, where maximum temperature occurs, is1
$$$\triangle{T}(t)==\frac{{\rho}\cdot{b}\cdot\sigma^{2}}{k}\cdot(1-\frac{1}{\sqrt{1+\frac{2\cdot{\alpha}\cdot{t}}{\sigma^{2}}}})$$$ (4)
A sphere with a radius R0.1g = 2.88 mm (SR0.1g) includes tissue weighing of 0.1g. We calculated the transient ΔT resulting from SAR0 =1 W/kg for a set of spheres with radii of {2.88,6.2,13,26,39}mm. The second and the third radii correspond to spheres with a tissue mass of 1g, and 10g, respectively. For the Gaussian distribution case, we derived the transient ΔT for a set of σ ranging from 0.65 mm to 26 mm and maintained SAR0.1g=1W/kg in SR0.1g. This set of distributions aims at covering the RF power deposition scenarios due to the presence of various types of implants, from a catheter needle to an orthopedic device. All these scenarios therefore differ in the SAR spatial distribution, yet all of them yielding the same average SAR over SR0.1g. Tissue properties: ρ=1000kg/m3, C=4000J/kg/K, k=0.5 W/m/K. These values remained constant regardless of changes in tissue temperature.
Results and Discussion
For the Gaussian distributions with σ<1.625mm, power deposition mainly occurred within the sub-sphere and b significantly depends on σ (Figure1). Transient results for uniform Gaussian distributions are shown in Figure3 and Figure4, respectively. When σ>2×R0.1g, power deposition tends to be uniform across SR0.1g and remains relatively unaffected by σ. On the contrary, ΔT is significantly affected by σ over the entire studied range. When σ>0.45×R0.1g , smaller σ values correspond to smaller ΔT values and shorter times (τ0.632) needed for ΔT(t) to reach $$$(1-e^{-1})\cdot\triangle{T}(t\rightarrow\infty)$$$ (Table1).The more uniform was the SAR profile, the closer b was to SAR0.1g. For the sharpest profile, i.e., σ=0.65mm, b=22.9>>SAR0.1g. The ratio ΔT(t=15 min) for the linear case and sphere with R=39mm was 1.017. Thus, the impact of SAR distribution outside sphere with R=39mm (assuming the RF exposure remains within the level of the assessed sphere) is negligible. On the contrary, consider a set of electrodes located on inner surface of a ring with diameter<15mm. In this scenario, a significant power deposition near other electrodes makes Equation4 unsuitable for estimating ΔT. The 'linear' scenario, SAR0=SAR0.1g, represents the most critical situation for t>1.5min assuming no other hotspot is closer than 39mm to the hotspot under assessment.
Conclusion
Key results in our study are:(i) using SAR0.1g without consideration of the distribution of SAR within and outside the enclosed volume cannot be a reliable tool for ΔT estimation;
(ii) for Gaussian distributions of power deposition:
(a) smaller σ leads to shorter τ0.632
(b) two regimes: for σ>0.45×R0.1g smaller σ leads to smaller ΔT, but for σ≤0.45×R0.1g smaller σ leads to higher ΔT at given time while maintaining the same SAR0.1g.
Acknowledgements
This work has received funding from the European Union’s Horizon 2020 research and innovation program under grant agreement No 885876 (AROMA project).References
1. Shrivastava D. (Editor). Theory and Applications of Heat Transfer in Humans. John Wiley & Sons Ltd. ISBN:9781119127307. DOI:10.1002/9781119127420. April 27th, 2018.
2. Kozlov M, Boulant N. Analytical Evaluation of Radio-Frequency Energy-Induced Heating in a Hot Spot without perfusion, ISMRM 2022, p2632.
Figures
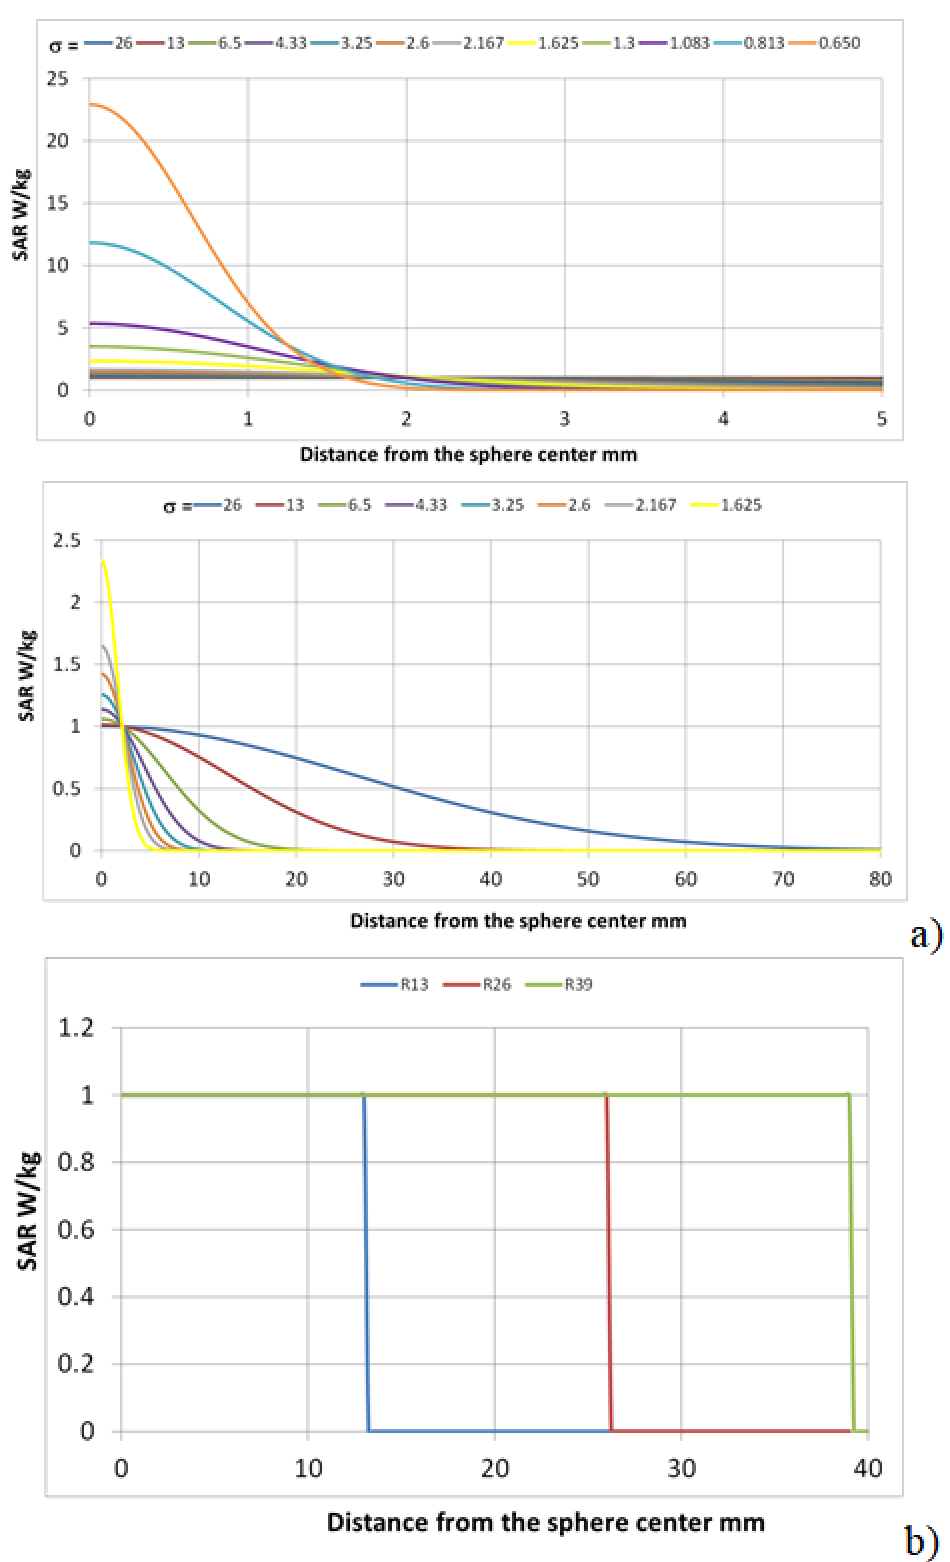
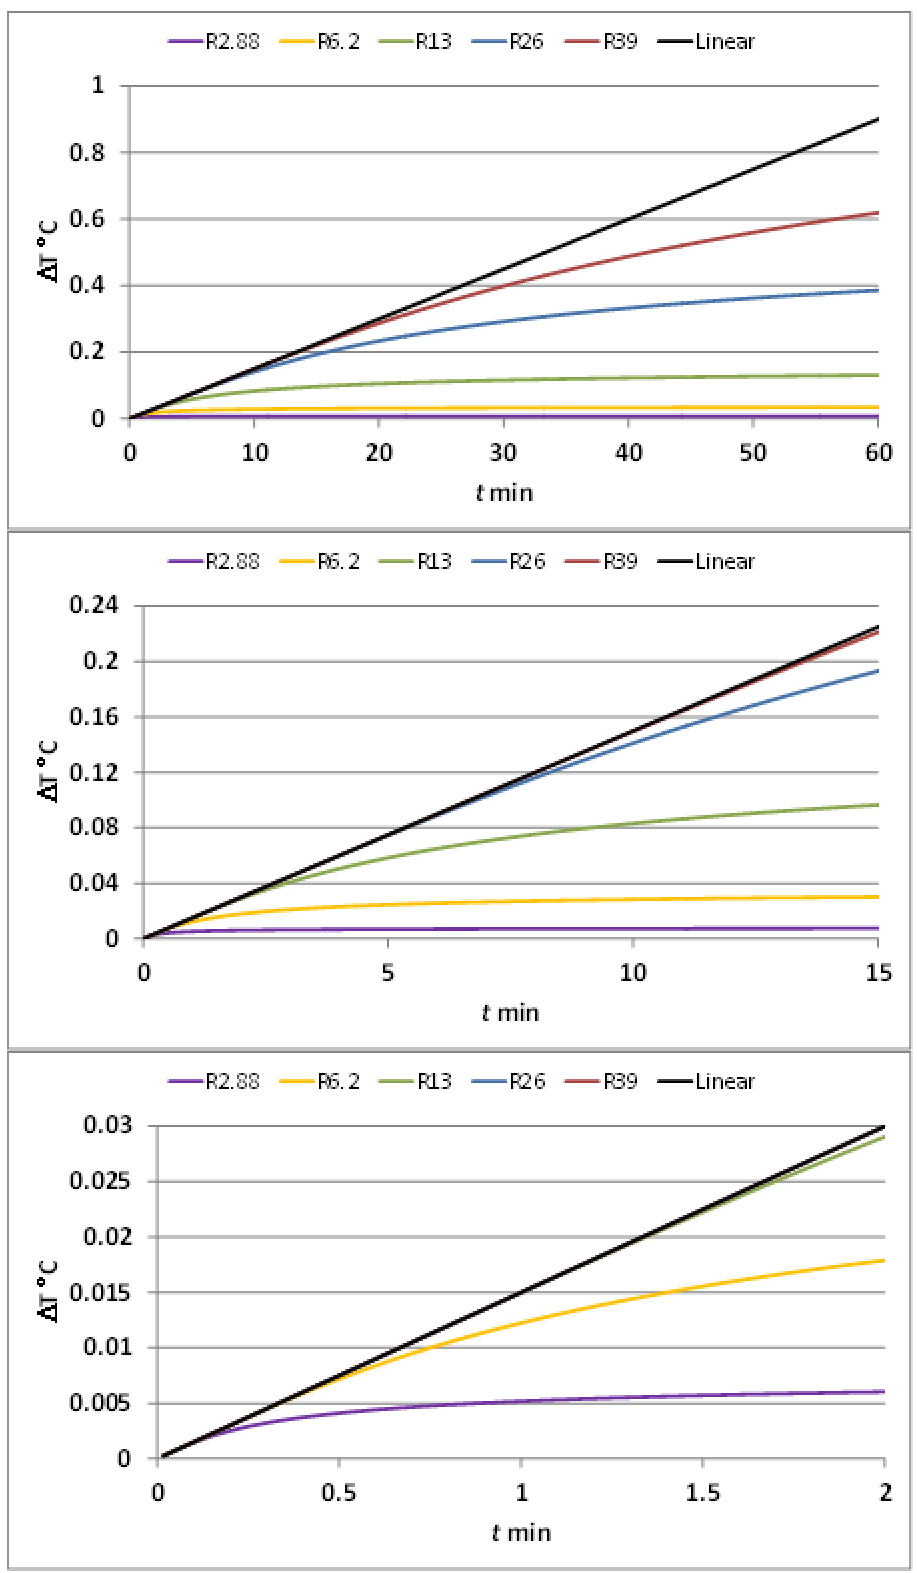
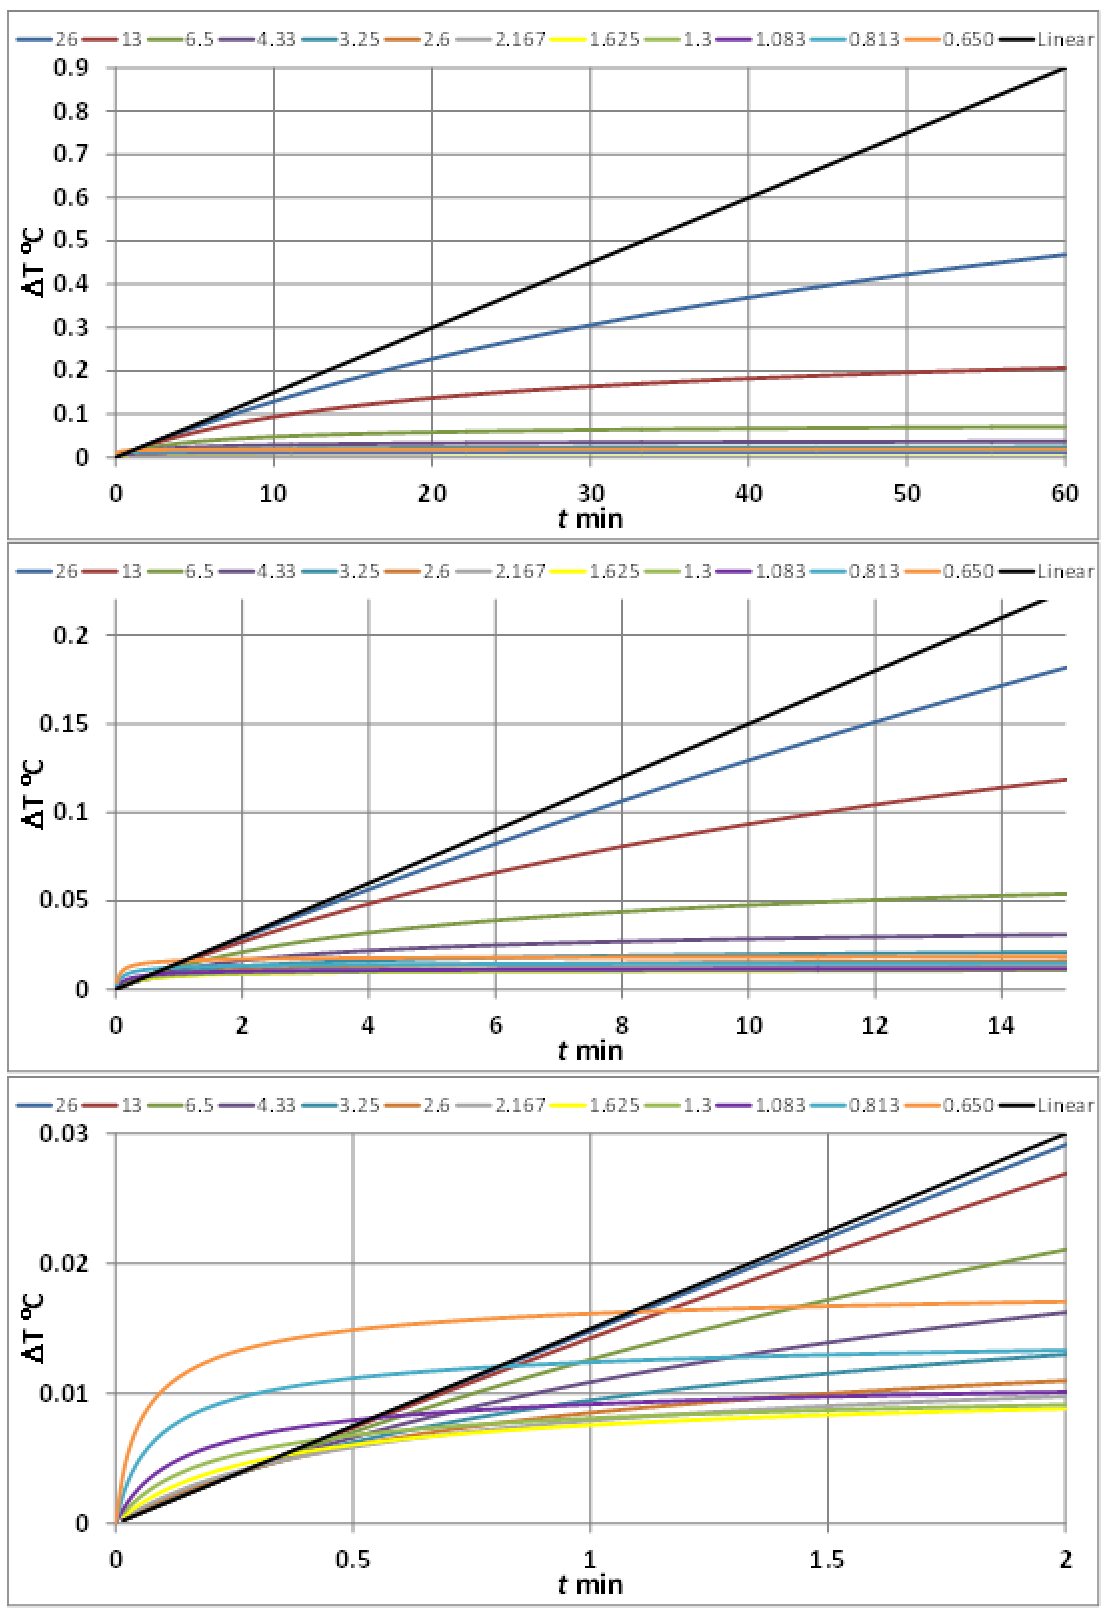
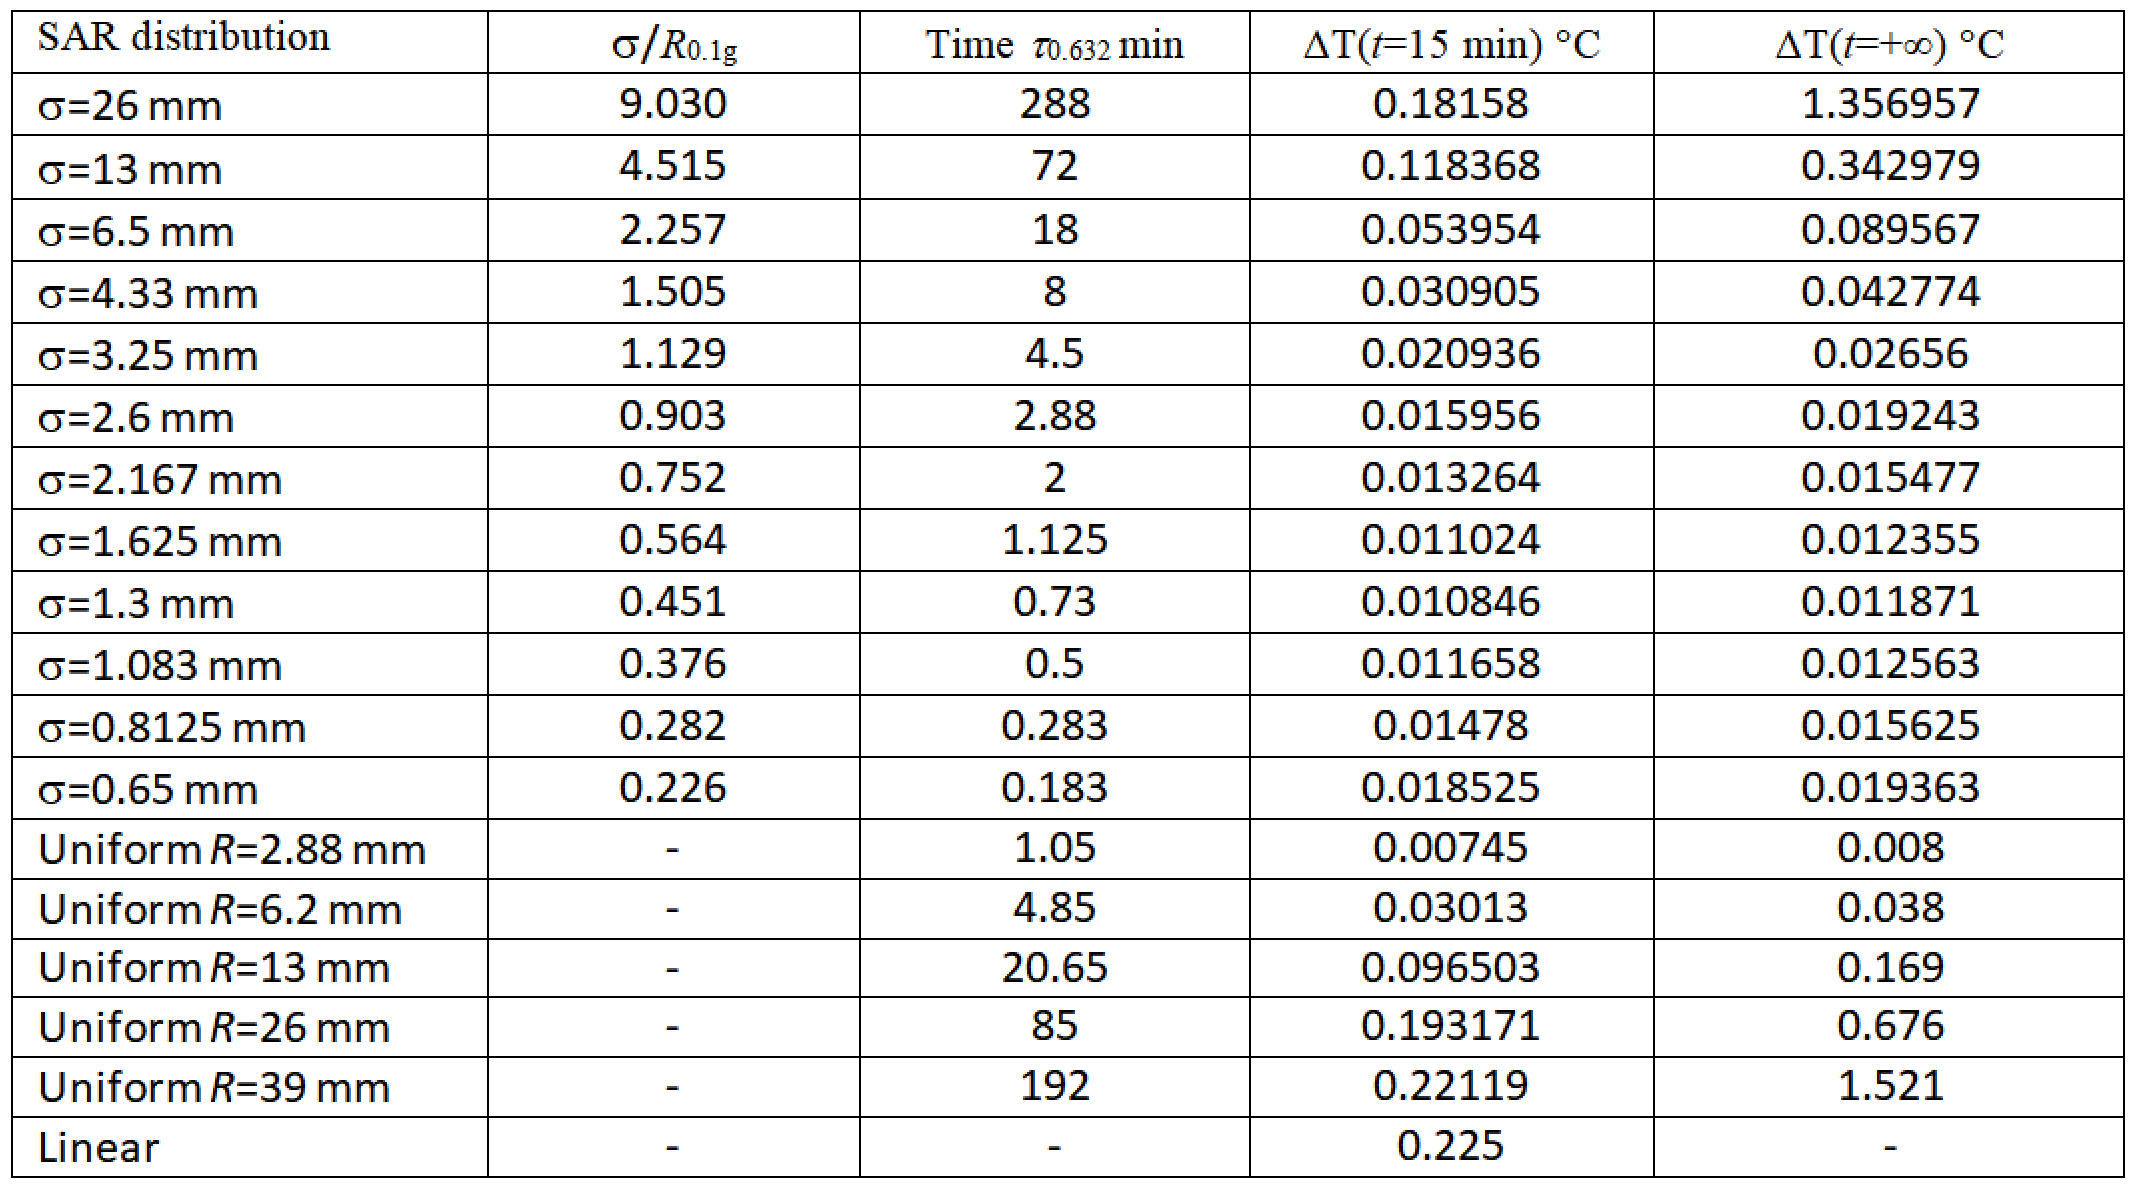
Table 1 Transient results at x=y=z=0 for spheres of R= 2.88, 6.2 mm, 13 mm, 26 mm, 39 mm in radius for uniform SAR of 1 W/kg, and for the Gaussian distributions.The Gaussian distribution was centered on the center of the SR0.1g and the constant b was calculated to yield an average SAR of 1 W/kg over SR0.1g.