3720
SSIMPLE: Scan-SpecIfic parameter MaPping from contrast weighted images with self-supervised LEarning1Electrical and Electronics Engineering, Bogazici University, Istanbul, Turkey, 2Athinoula A. Martinos Center for Biomedical Imaging, Massachusetts General Hospital, Charlestown, MA, United States, 3Harvard Medical School, Boston, MA, United States
Synopsis
Keywords: Quantitative Imaging, Quantitative Imaging, self-supervised learning, parameter mapping
Motivation: There is rich and complementary information in clinical images, which may lend itself to the estimation of relaxometry parameters.
Goal(s): To develop a self-supervised network that can estimate T1, T2, and PD maps from contrast-weighted images with high fidelity.
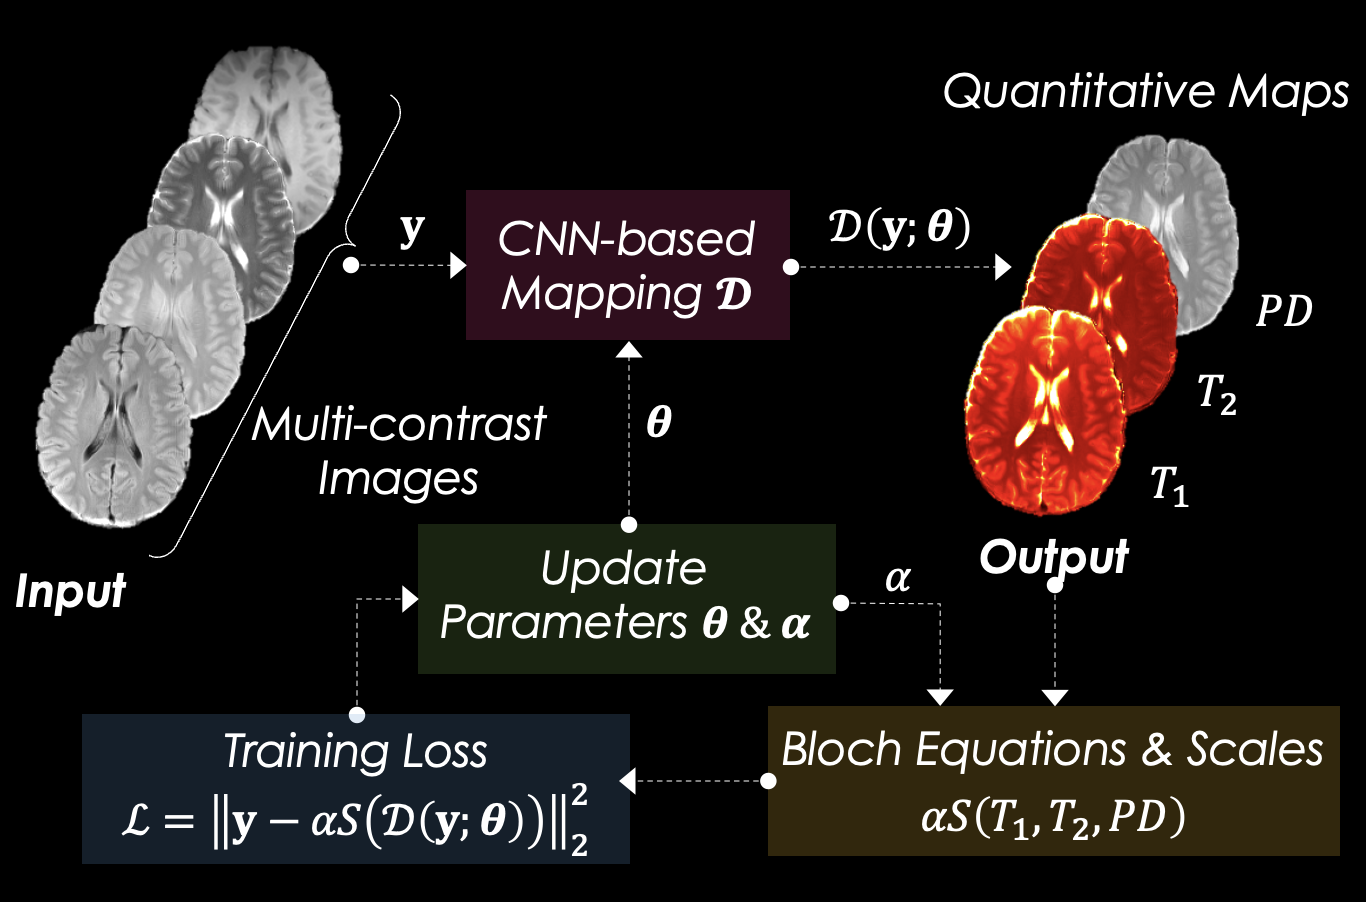
Approach: We developed a scan-specific self-supervised model (SSIMPLE) that harnesses Bloch equations and estimates parameter maps from multi-contrast images without the need for a training dataset and additional constraints.
Results: High-fidelity T1, T2, and PD maps with minor biases 4.5%, 11.76%, and 15.45%, respectively, were obtained using the proposed self-supervised network.
Impact: Using the developed scan-specific self-supervised neural network, SSIMPLE, high-fidelity parameter maps can be estimated from clinically routine contrast-weighted images without the need for an external training dataset or additional constraints.
Introduction
Current quantitative MRI has limitations due to specialized sequences, long acquisition times, and the requirement of ground-truth quantitative maps for supervised deep learning. Self-supervised learning methods have been developed for parameter mapping from contrast-weighted images. Nevertheless, the training loss function requires additional constraints, and their regularization weights need to be determined manually1. We propose a scan-specific self-supervised learning method, SSIMPLE, which does not need external training data and additional constraints, to obtain T1, T2, and PD maps from clinically routine weighted images.Data/code: https://anonymous.4open.science/r/SSIMPLE-0D71/README.md
Neural Network Design
A 2D U-net with 5 depths and 64 kernels at the first depth was used. Convolutional layers were followed by batch normalization, activation (ReLU), and dropout with 0.05 rate. The network receives contrast-weighted images as four-channel input. It yields a three-channel output, including T1, T2, and PD maps. Contrast-weighted images were synthesized using the estimated parameter maps via Bloch equations:$$T1w = PD\frac{sin(\alpha)(1-e^{\frac{-TR}{T_{1}}})}{1-cos(\alpha)e^{\frac{-TR}{T_{1}}}}e^{\frac{-TE}{T_{2}}} \\ T2w = PD(1-e^{\frac{-TR}{T_{1}}})e^{\frac{-TE}{T_{2}}} \\ PDw = PD(1-e^{\frac{-TR}{T_{1}}})e^{\frac{-TE}{T_{2}}} \\ MPRAGE = PD(1-\frac{2e^{\frac{-TE}{T_{1}}}}{1+e^{\frac{-TR}{T_{1}}}}) \\ FLAIR = PD(\frac{1-2e^{\frac{-TI}{T_{1}}}+e^{\frac{-TR}{T_{1}}}}{1+e^{\frac{-TR}{T_{1}}}cos(\alpha)})e^{\frac{-TE}{T_{2}}} $$
As detailed in Figure 1, the loss function calculates the mean squared error (MSE) between the input and the synthesized contrast-weighted images in a self-supervised manner. Since the input images are potentially scaled differently, a trainable parameter was defined for each input to scale it appropriately.
Firstly, the model was trained with fixed scale parameters, followed by joint training with scale variables. The training took 2.4 hours for the synthetic and 1.7 hours for in vivo data.
Data Acquisition
Synthetic data: Reference T1, T2, and PD maps are derived from an in vivo 3D-QALAS2 dataset (FOV=240x240x202mm3, Size=208x208x176, TE=2.29ms, TR=4.5ms, Bandwidth=330Hz/px, scan time=8:24min). T1-weighted, T2-weighted, PD-weighted, and MPRAGE images were synthesized using Bloch equations. Each volume was normalized to have different scales.In vivo data: Contrast-weighted images which include T1-w, T2-w, PD-w, and FLAIR images with FOV=220x181mm2, Matrix=192x158, Bandwidth=130Hz/px and the following parameters,
- T1-weighted: TE=13ms, TR=500ms, Flip Angles=75°, 160°, scan time=2:44min;
- T2-weighted: TE=85ms, TR=4000ms, Flip Angle=180°, scan time=1:10min;
- PD-weighted: TE=12ms, TR=4000ms, Flip Angle=180°, scan time =1:54min;
- FLAIR: TE=85ms, TR=8000ms, TI=2500ms, Flip Angle=180°, scan time=4:02min,
Results
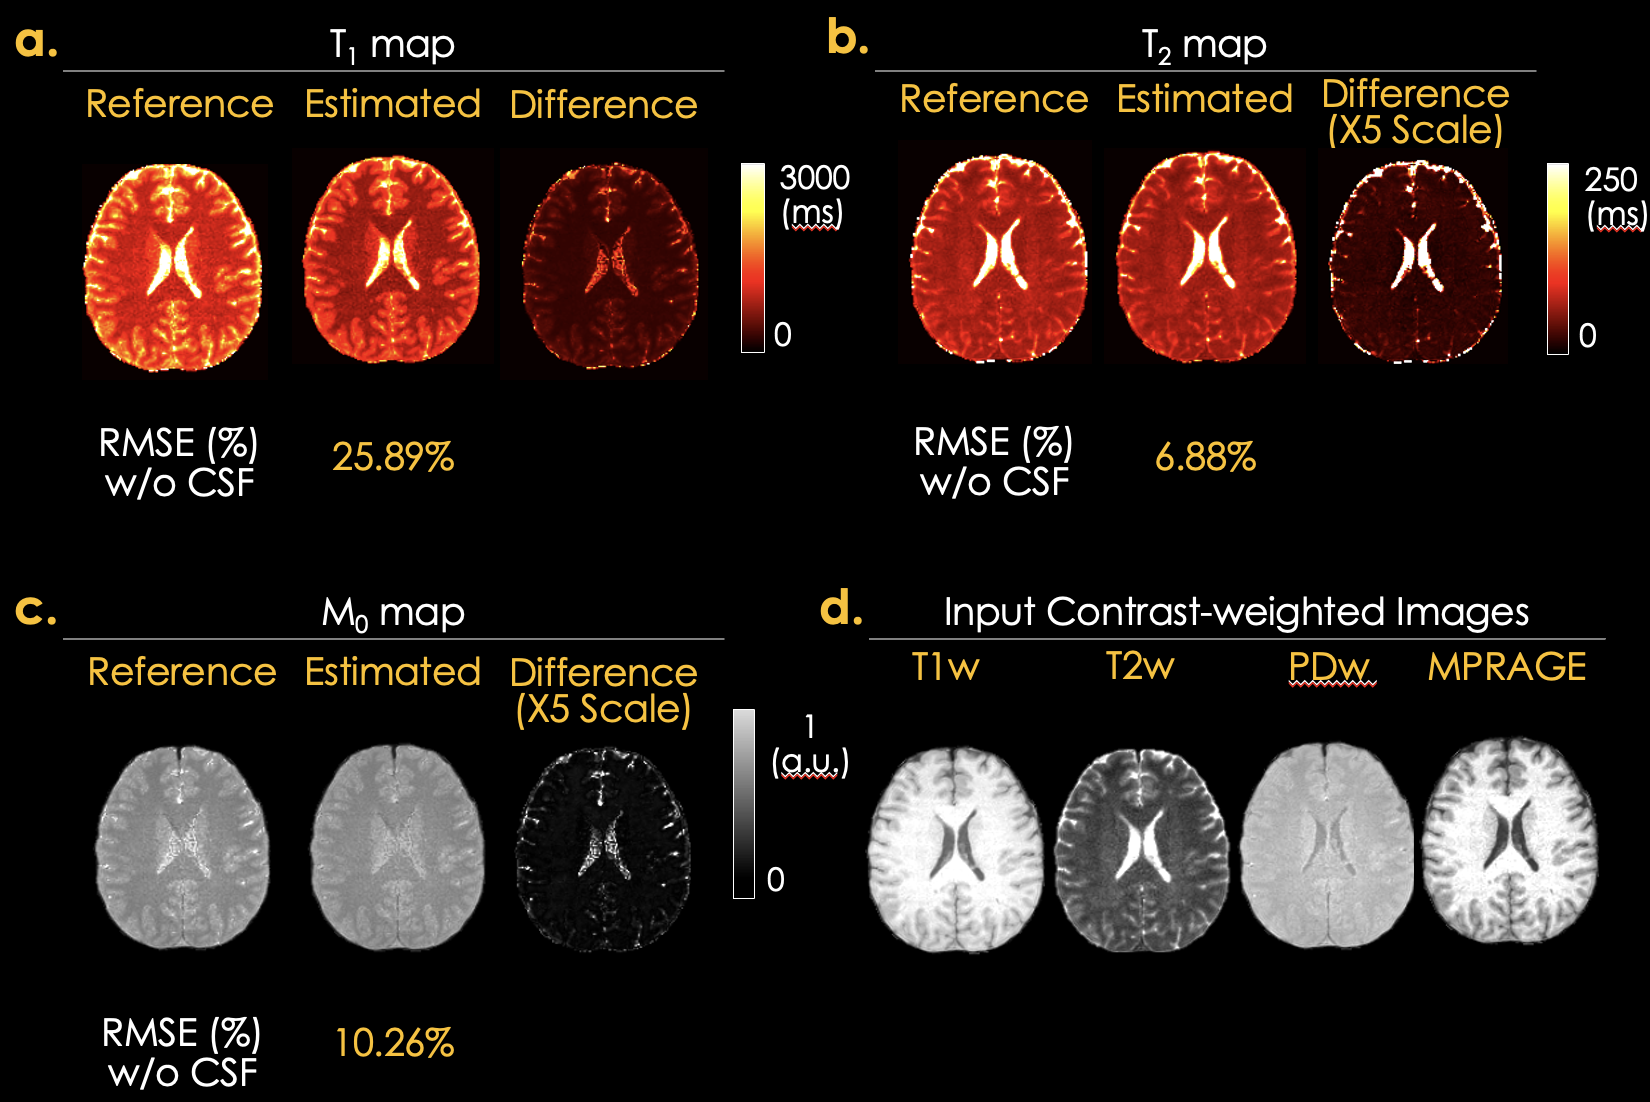
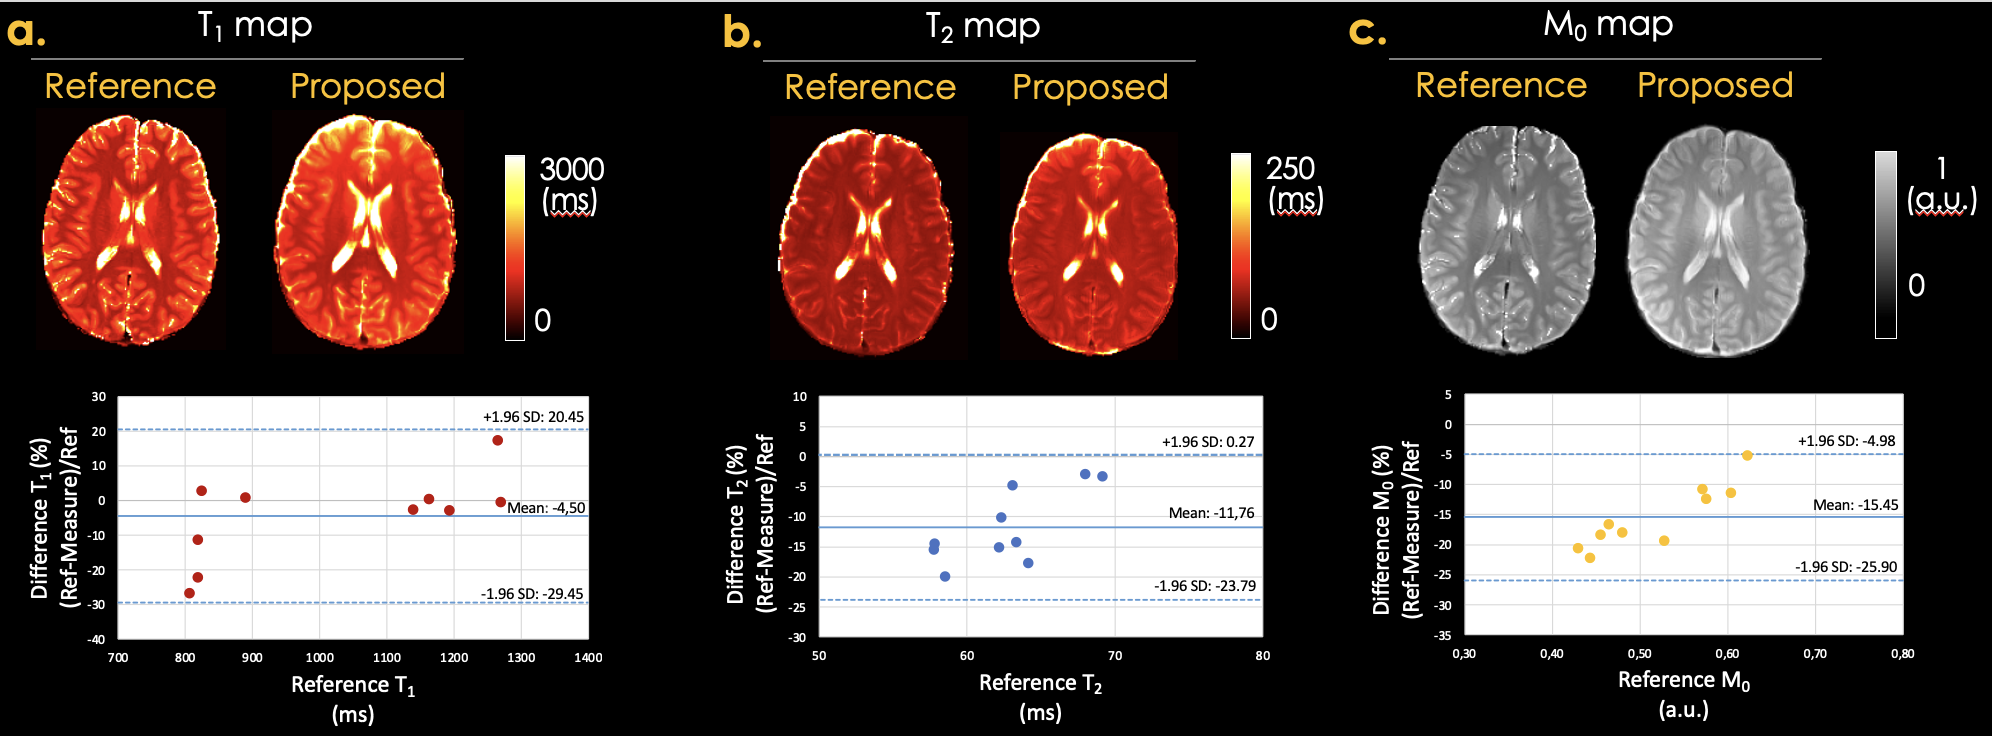
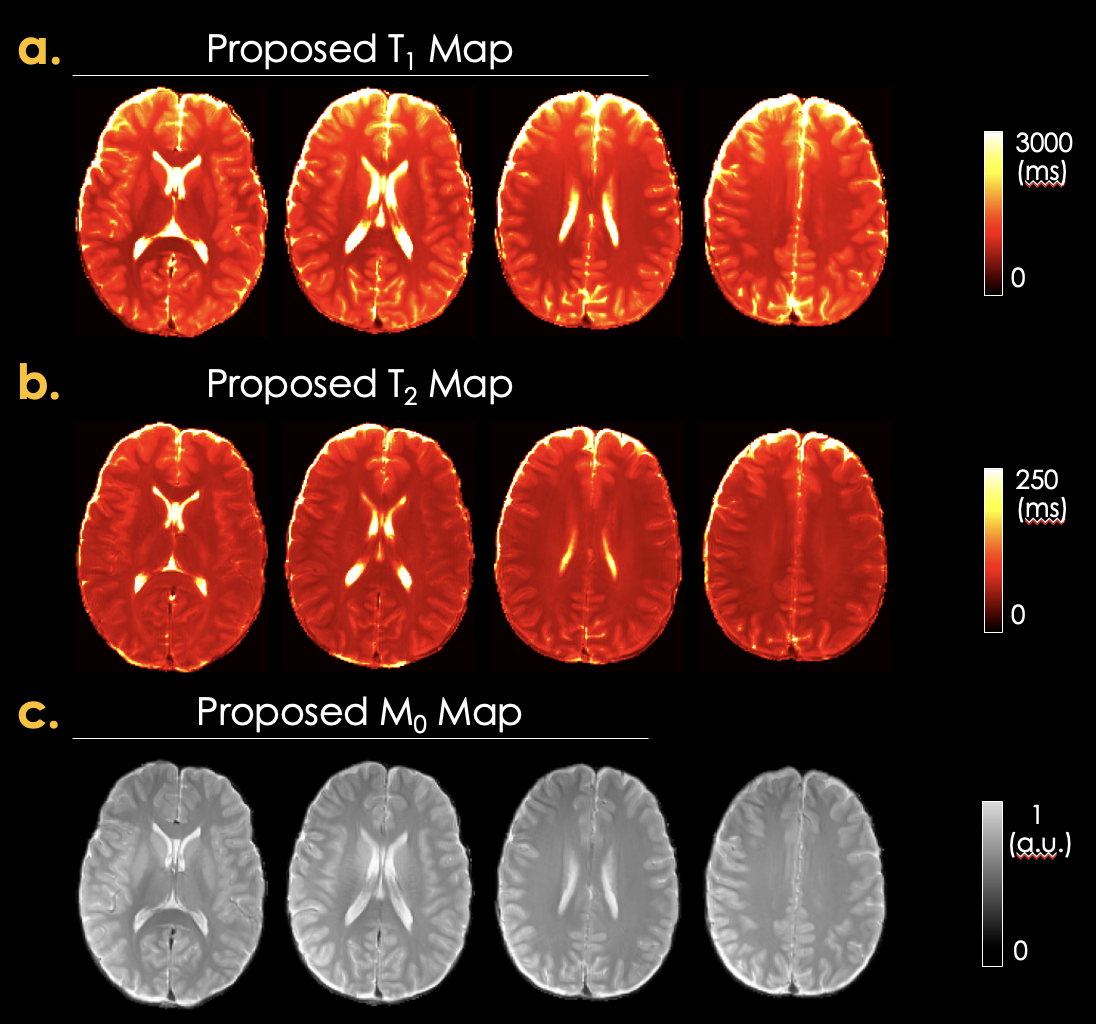
Figure 2: the proposed self-supervised SSIMPLE produced high-fidelity parameter maps for the synthetic data. The RMSE values are 25.89%, 6.88%, and 10.26% for the T1, T2, and PD maps, excluding CSF, respectively.Figure 3: the proposed self-supervised SSIMPLE estimated high-quality quantitative maps with minor biases of 4.5%, 11.76%, and 15.45% for the T1, T2, and PD maps, respectively. Bland-Altman plots were generated using measurements from white matter and gray matter.
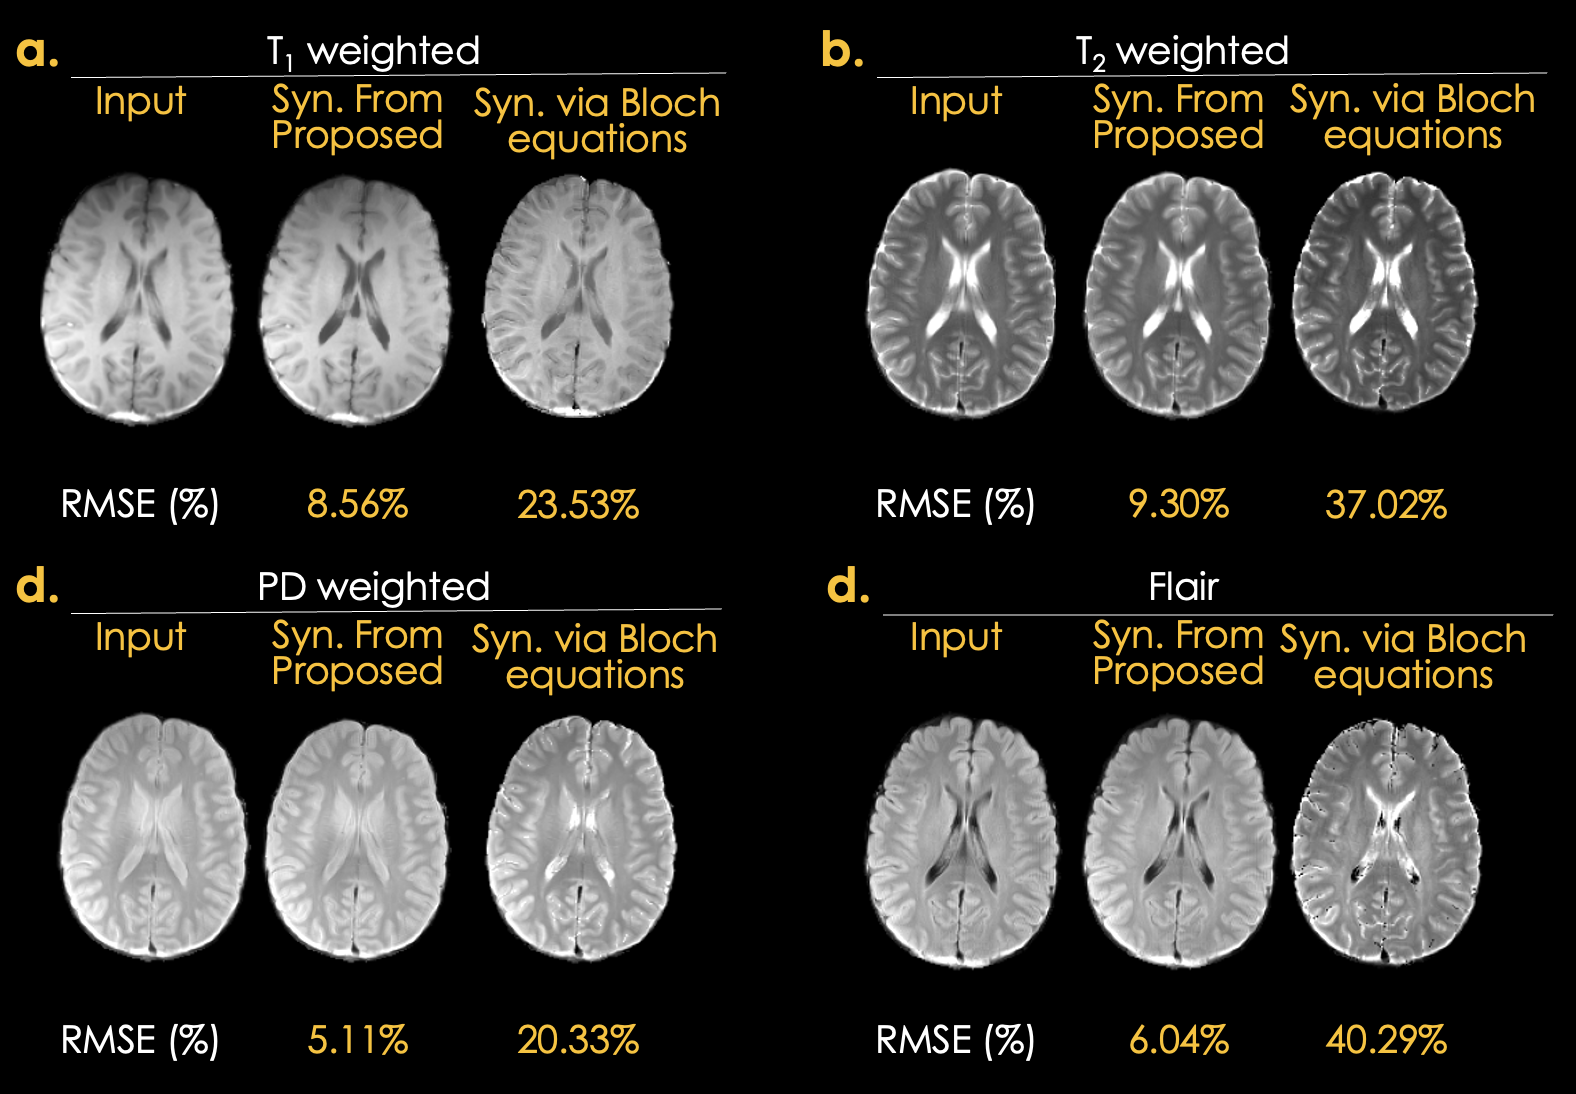
Figure 4: synthesized contrast-weighted images using the estimated parameter maps via SSIMPLE have higher fidelity compared to synthesized contrast-weighted images using Bloch equations directly on the reference maps estimated from multi-inversion and multi-echo acquisitions.
Figure 5: additional exemplar slices of estimated quantitative maps via SSIMPLE are shown for in vivo data.
Discussion and Conclusion
High-fidelity T1, T2, and PD maps were obtained using the proposed self-supervised learning method, SSIMPLE. The need for additional constraints1, such as total variation loss on M0 map, a loss for constraining the mean value of the M0, and losses for constraining T1 and T2 values in the CSF and parameters to weight these constraints are obviated by using trainable scale parameters, which are estimated jointly with the parameter maps during training.As demonstrated in Figure 4, high-fidelity contrast-weighted images cannot be directly synthesized with Bloch equations and reference parameter maps. This is likely because the maps and Bloch equations are insufficient to account for additional MR physics, such as magnetization transfer effects, which are known to contribute to the contrast of TSE images (e.g., FLAIR) significantly. In contrast, our self-supervised loss function produces highly similar synthetic images by explicitly seeking parameter maps consistent with the input contrast-weighted images. However, this results in minor biases: 4.5% in T1, 11.76% in T2, and 15.45% in PD maps.
In conclusion, we proposed self-supervised SSIMPLE, which does not require external reference data and additional constraints, enabling high-fidelity parameter mapping from standard clinical images.
Acknowledgements
This work was supported by research grants NIH R01 EB028797, P41 EB030006, U01 EB026996, R03 EB031175, R01 EB032378, UG3 EB034875, and NVidia Corporation for computing support.References
1. Qiu S, Christodoulou AG, Sati P, Xie Y, Li D. Physics-guided self-supervised learning for retrospective T1 and T2 mapping from conventional weighted brain MRI. In: ISMRM 2023. ; p. 2168.
2. Kvernby S, Warntjes MJB, Haraldsson H, Carlhäll C-J, Engvall J, Ebbers T. Simultaneous three-dimensional myocardial T1 and T2 mapping in one breath hold with 3D-QALAS. J. Cardiovasc. Magn. Reson. 2014;16:102.
3. Barral JK, Gudmundson E, Stikov N, Etezadi-Amoli M, Stoica P, Nishimura DG. A robust methodology for in vivo T1 mapping. Magn. Reson. Med. 2010;64:1057–1067.
4. Trzasko JD, Mostardi PM, Riederer SJ, Manduca A. Estimating T1 from multichannel variable flip angle SPGR sequences. Magn. Reson. Med. 2013;69:1787–1794.
Figures