3715
Simultaneous brain susceptibility, T1 and T2 quantification at 7T with phase-cycled balanced steady-state free precession1Department of Diagnostic, Interventional and Pediatric Radiology (DIPR), Inselspital, Bern University Hospital, University of Bern, Bern, Switzerland, 2Translational Imaging Center (TIC), Swiss Institute for Translational and Entrepreneurial Medicine, Bern, Switzerland, 3Graduate School for Cellular and Biomedical Sciences, University of Bern, Bern, Switzerland, 4CSEM - Swiss Center for Electronics and Microtechnology, Bern, Switzerland, 5CIBM Center for Biomedical Imaging, Lausanne, Switzerland, 6Department of Diagnostic and Interventional Radiology, Lausanne University Hospital and University of Lausanne, Lausanne, Switzerland, 7Department of Cardiology, Inselspital, University Hospital Bern, Bern, Switzerland, 8Advanced Clinical Imaging Technology, Siemens Healthineers International AG, Bern, Switzerland, 9Magnetic Resonance Methodology, Institute of Diagnostic and Interventional Neuroradiology, University of Bern, Bern, Switzerland
Synopsis
Keywords: Quantitative Imaging, Brain, Susceptibility, high-field, bSSFP
Motivation: Phase-cycled(PC) balanced steady-state free precession(bSSFP) sequences offer yet-to-be-explored capabilities for quantitative susceptibility mapping(QSM), T1, and T2 mapping, particularly attractive for 7T applications.
Goal(s): To determine the potential of PC-bSSFP for simultaneous QSM, T1 and T2 mapping in the brain at 7T.
Approach: PC-bSSFP-based off-resonance, tissue phase, T1 and T2 maps are compared with reference maps obtained from ME-GRE and MP2RAGE, in three subjects at 7T.
Results: PC-bSSFP-based off-resonance and tissue phase maps agreed with ME-GRE-based references with absolute mean errors of 13.2±3Hz and 8.9±3.7Hz, respectively. PC-bSSFP-based T1 and T2 maps matched the expected brain contrast with high precision.
Impact: At 7T, PC-bSSFP enables quantitative measurements of susceptibility, T1, and T2, within one acquisition, while providing high quality weighted images with a clear distinction between different brain structures.
Introduction
Quantitative susceptibility mapping (QSM) is a phase-based technique to obtain valuable information about the magnetic susceptibility of tissue composition1,2. For QSM, multi-echo gradient-recalled echo (ME-GRE) acquisitions are the established gold standard but have inherent limitations, namely being T2* weighted and thus suffering from low signal in regions of large B0 heterogeneity. Phase-cycled balanced steady state free precession (PC-bSSFP) can be used to obtain unique elliptical-shaped complex signal profiles in which both off-resonance3,4 and relaxation times5 are encoded. This study aims to develop an algorithm for off-resonance mapping based on PC-bSSFP, to determine its potential for QSM in comparison with reference methods6 in the human brain and to investigate the simultaneous quantification of T1 and T2 at 7T.Methods
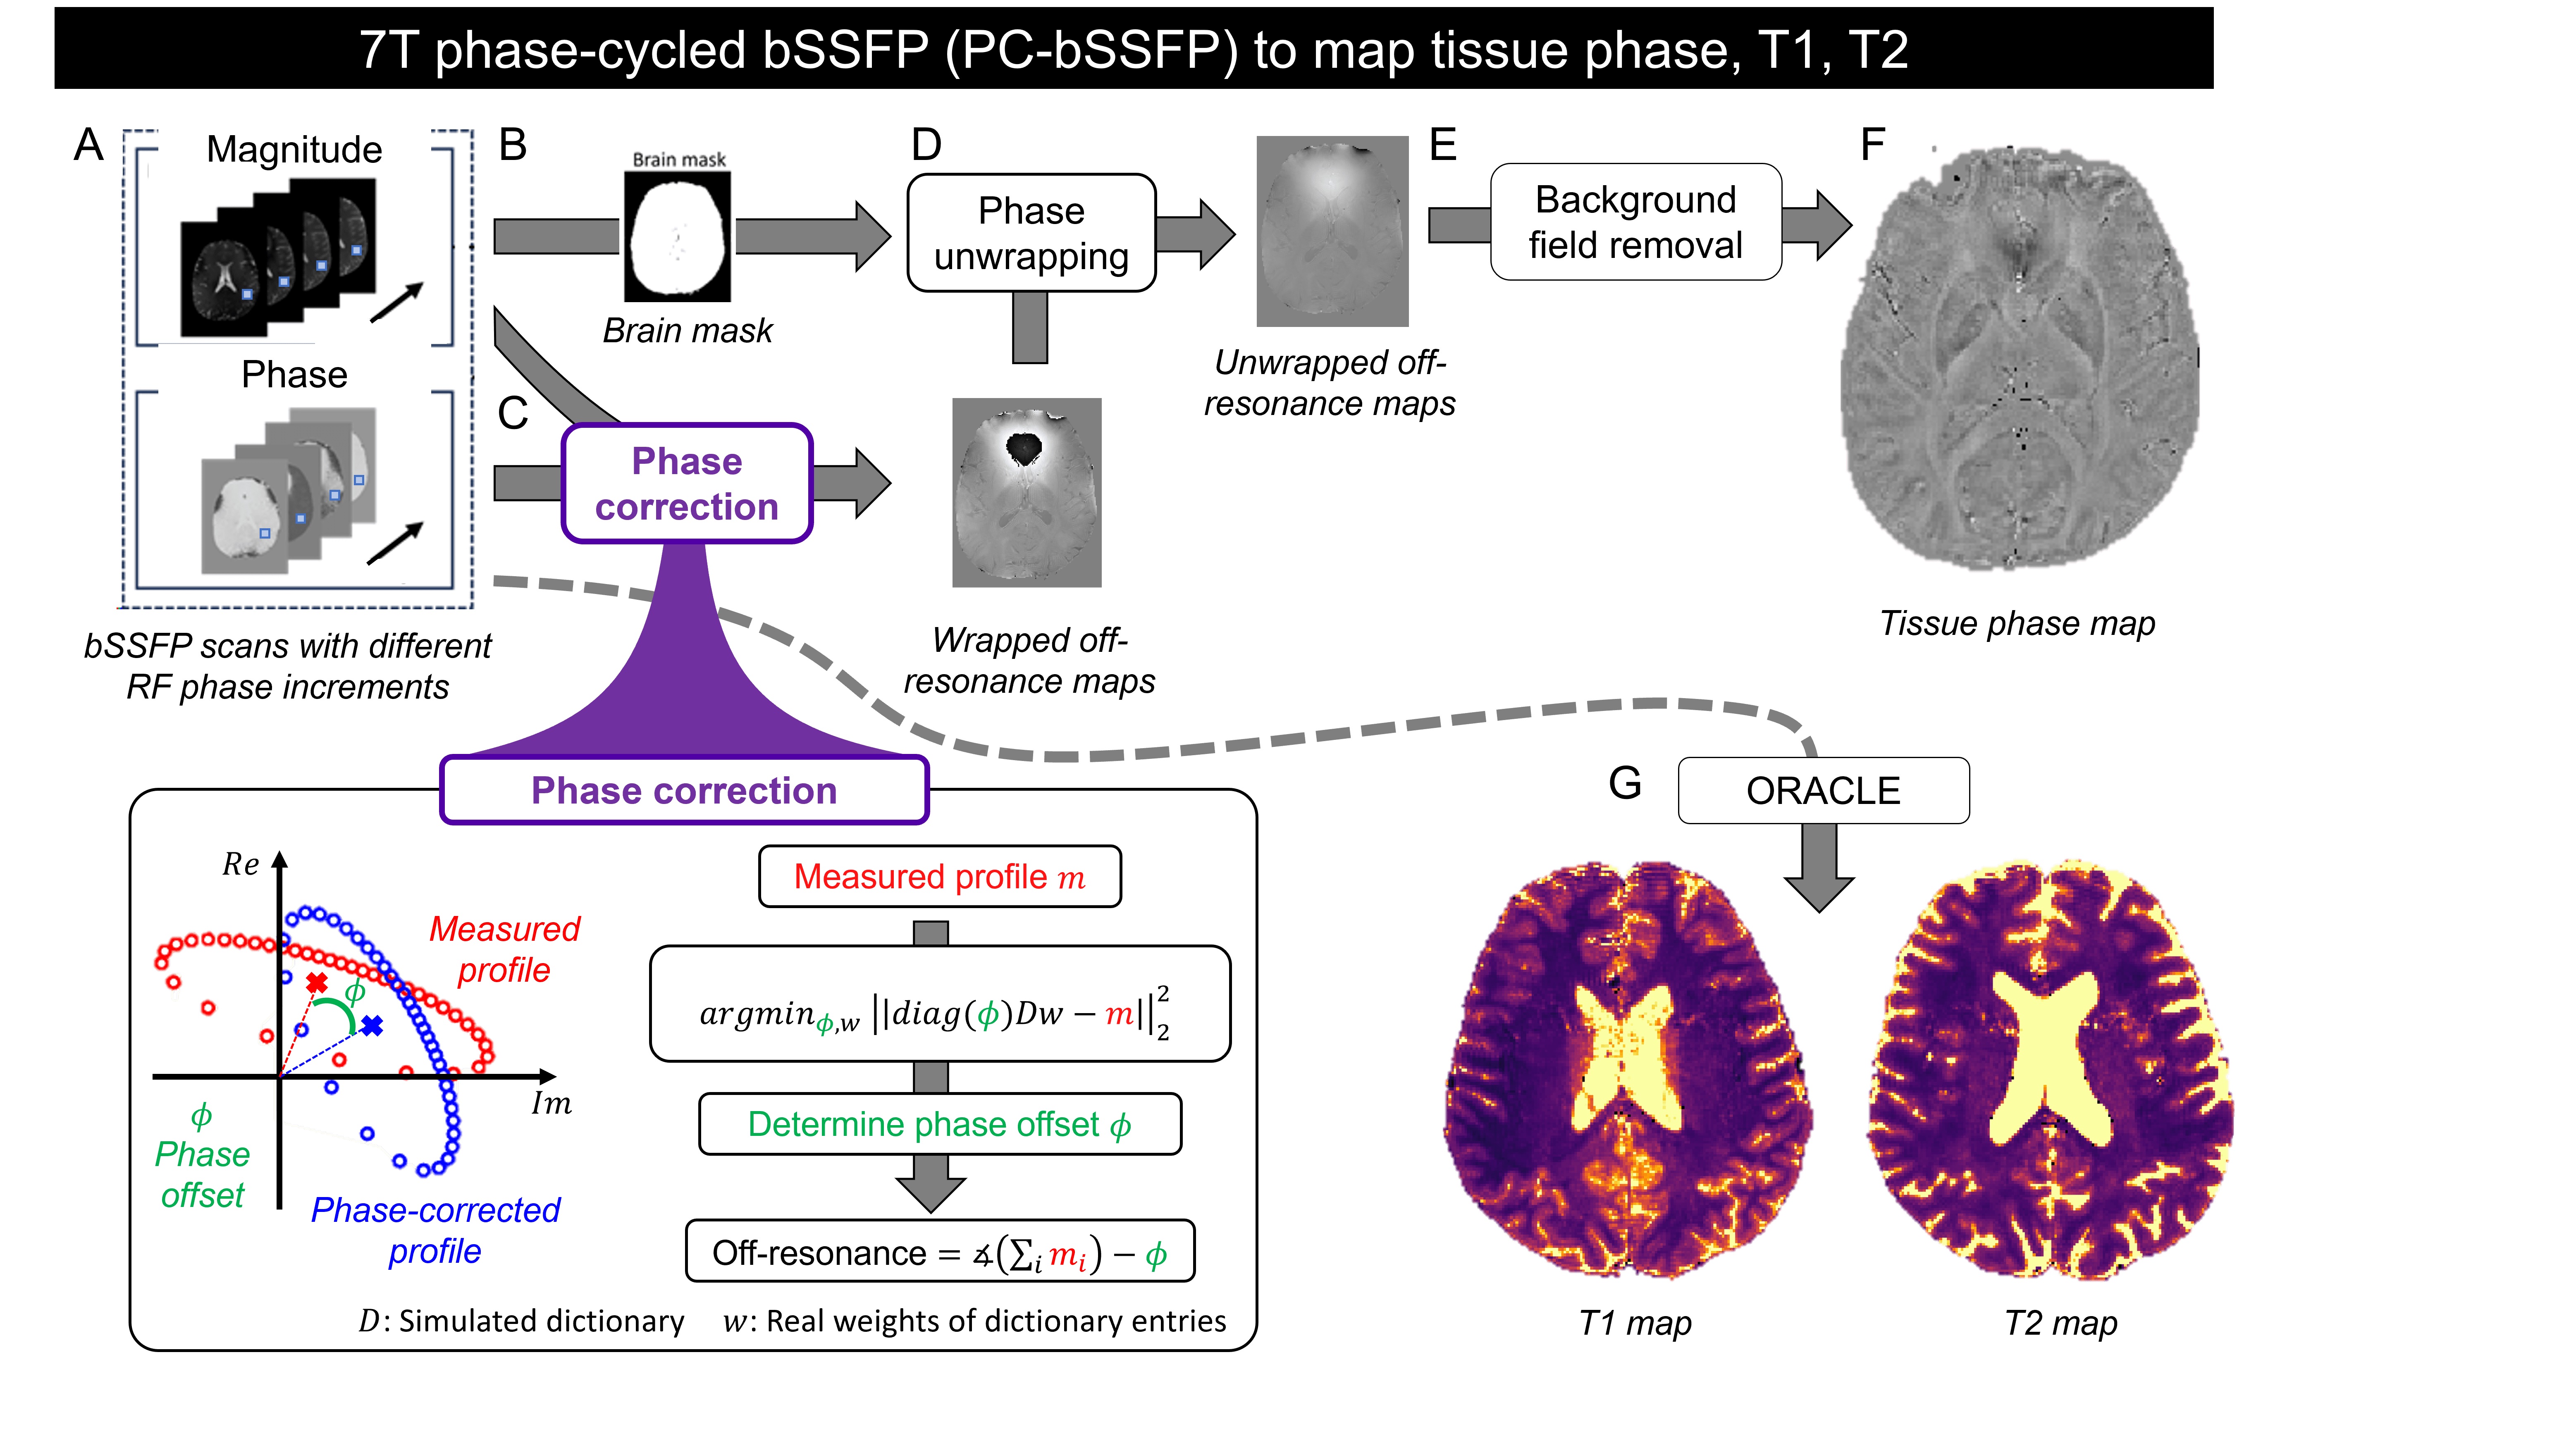
Off-resonance estimation based on PC-bSSFP data: Individual data points on an elliptical bSSFP profile, obtained in each voxel, can rotate around origin due to phase accumulation between the application of radiofrequency (RF) excitation pulse and data acquisition. The phase of the complex mean of the bSSFP profile estimates the tissue phase accumulated due to local off-resonance. However, bSSFP profiles also rotate in the complex plane due to systematic phase errors and coil-induced phase, which create a phase-offset3. To determine the phase-offset in each voxel, the following nonlinear least squares problem can be solved:$$argmin_{\phi,w}\left\|DwF(\phi)-m\right \|_2^2\;(Eq.1)$$ where D is a dictionary containing bSSFP profiles as entries, w is the real-valued weight of each entry, F(Φ) is the diagonal phase-offset matrix and m is the measured bSSFP profile. Eq.1 can be solved as proposed in7. After determining the phase offset, the off-resonance was estimated by subtracting the phase offset from the phase of the mean of the complex PC-bSSFP samples(Fig.1).T1 and T2 estimation: T1 and T2 relaxation times were quantified with ORACLE8.
Tissue Phase Estimation: To remove background field inhomogeneities and estimate tissue phase, v-SHARP9 from the STI-Suite software package10 was used.
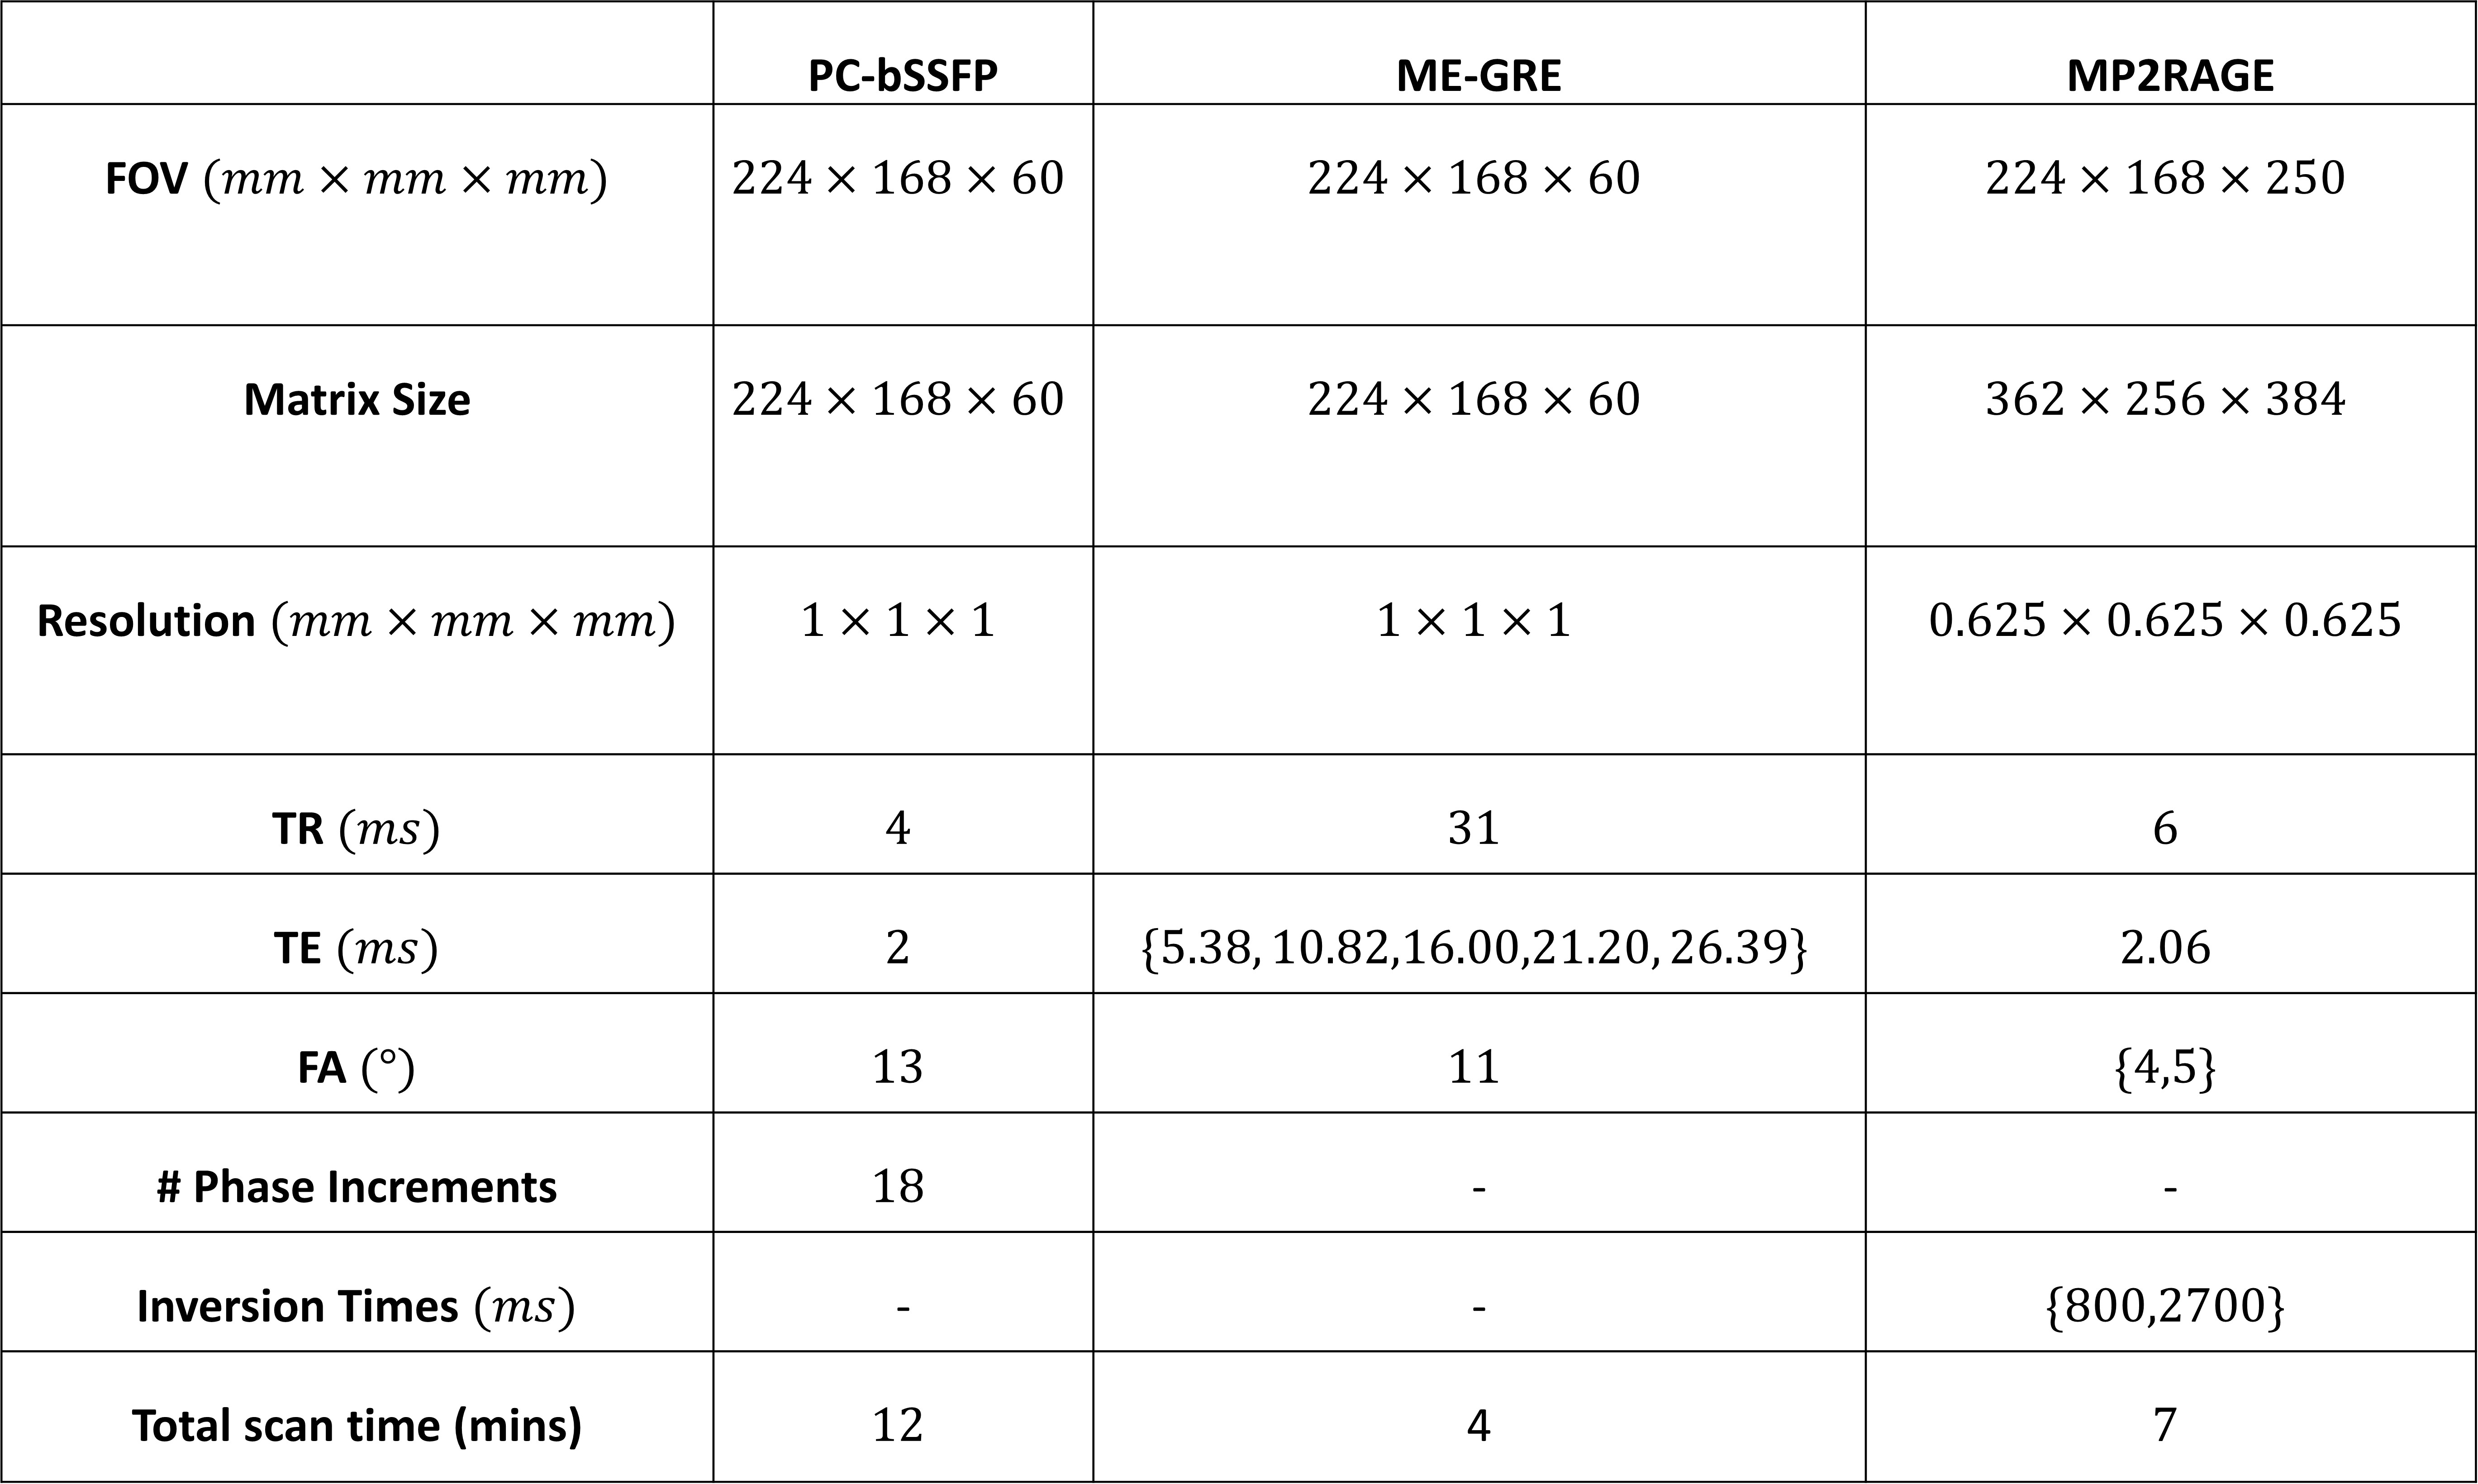
Experiments: Brain MRI data were acquired in n=3 healthy subjects at a 7T clinical MRI scanner (MAGNETOM Terra, Siemens Healthcare Erlangen, Germany) using a 32-channel head coil. The following acquisitions were performed: PC-bSSFP for off-resonance, T1, and T2 maps; ME-GRE for reference off-resonance maps and MP2RAGE11 for reference T1 maps (Fig.5 for acquisition parameters).
Data analysis: An intensity-based brain mask was created using single level binarization12, followed by skull stripping13 to be applied to all maps. The mean absolute difference value between PC-bSSFP and ME-GRE was calculated for both off-resonance and tissue phase maps for comparison. To determine mean T1 and T2 values in different regions of the brain, masks of white matter (WM), gray matter (GM) and cerebrospinal fluid (CSF) regions were created with k-means14 on the magnitude bSSFP images. Mean values are reported in each region.
Results
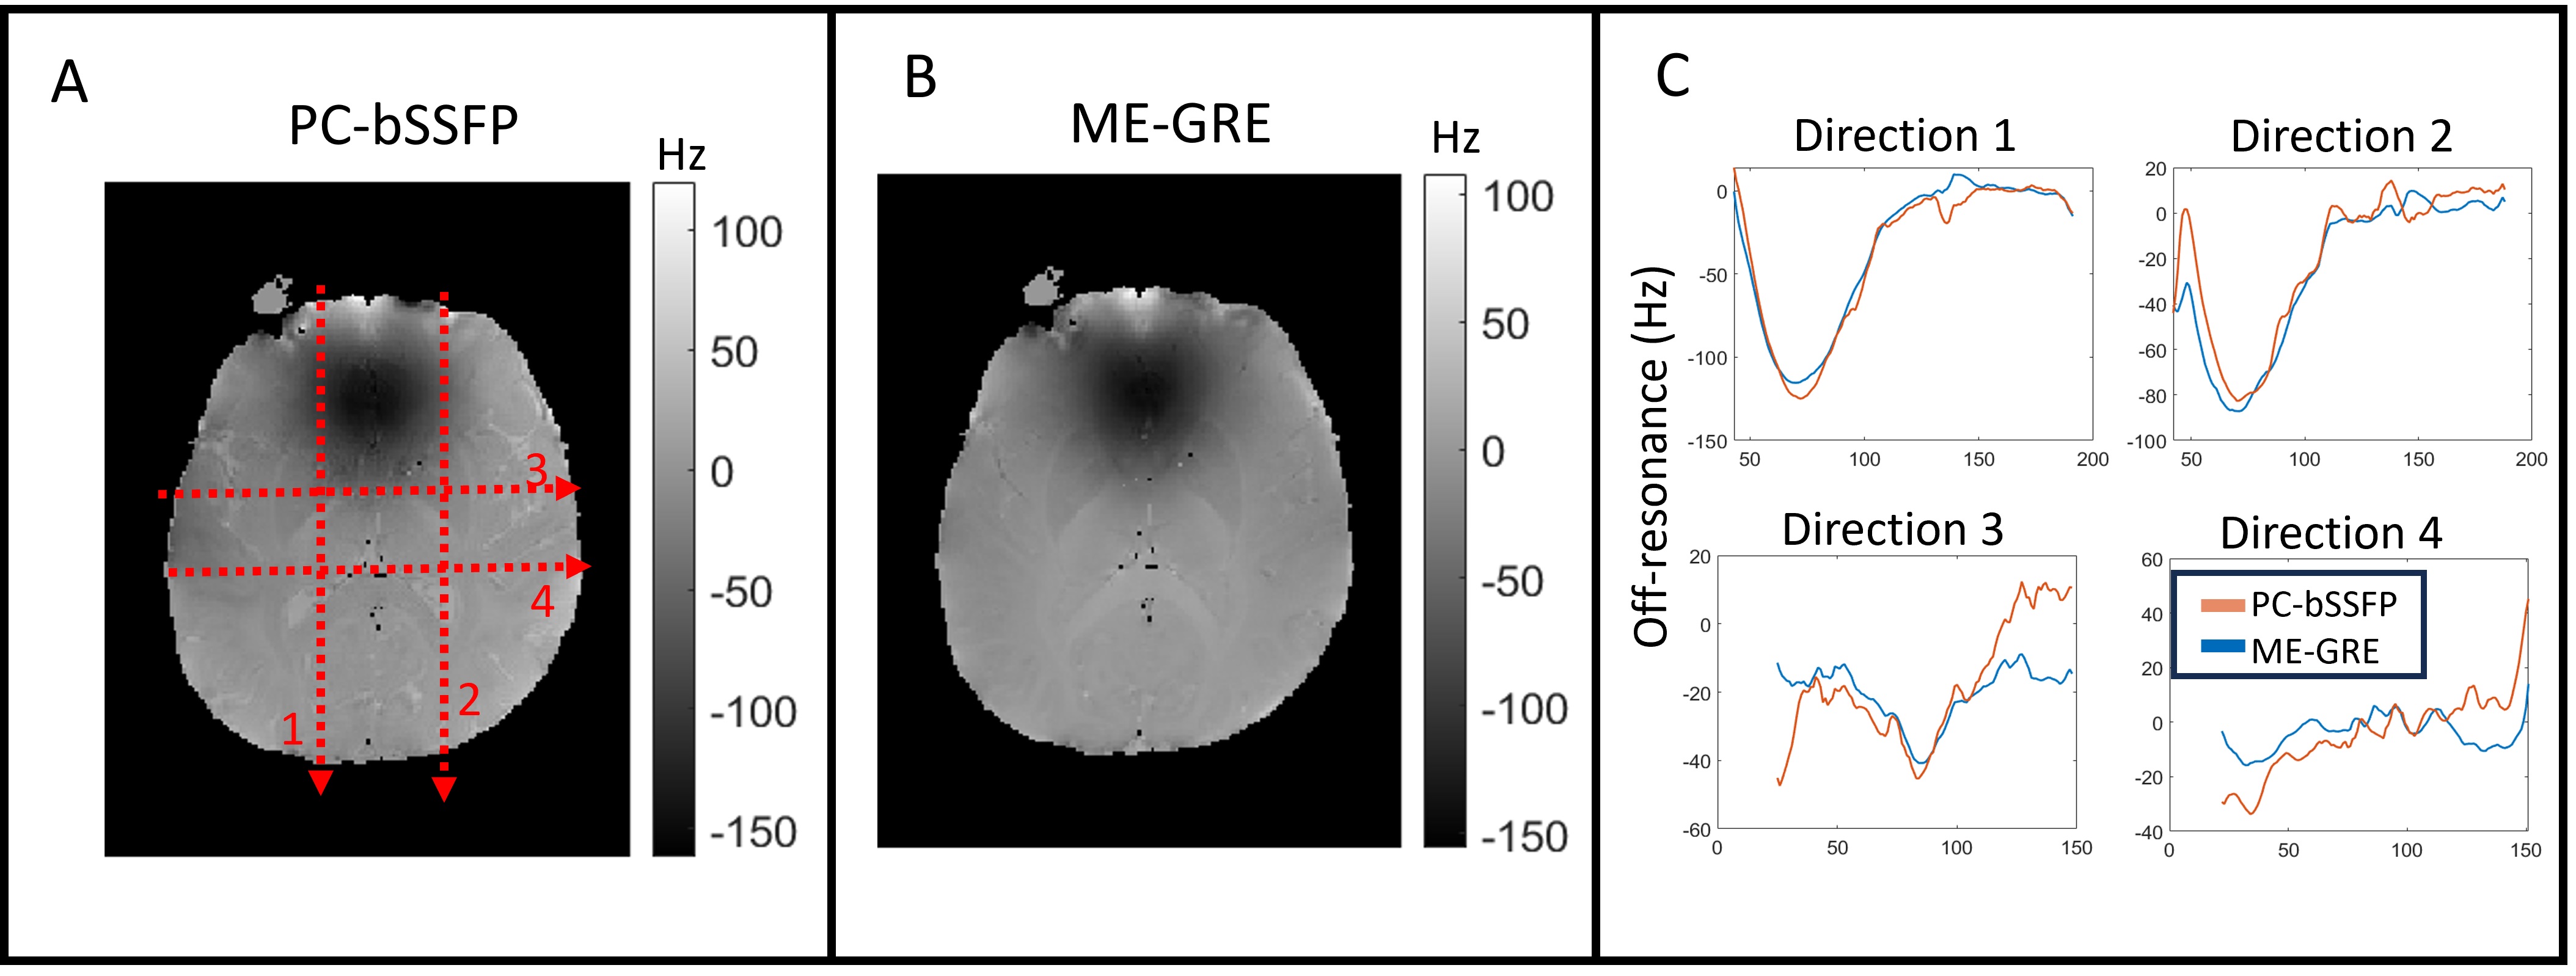
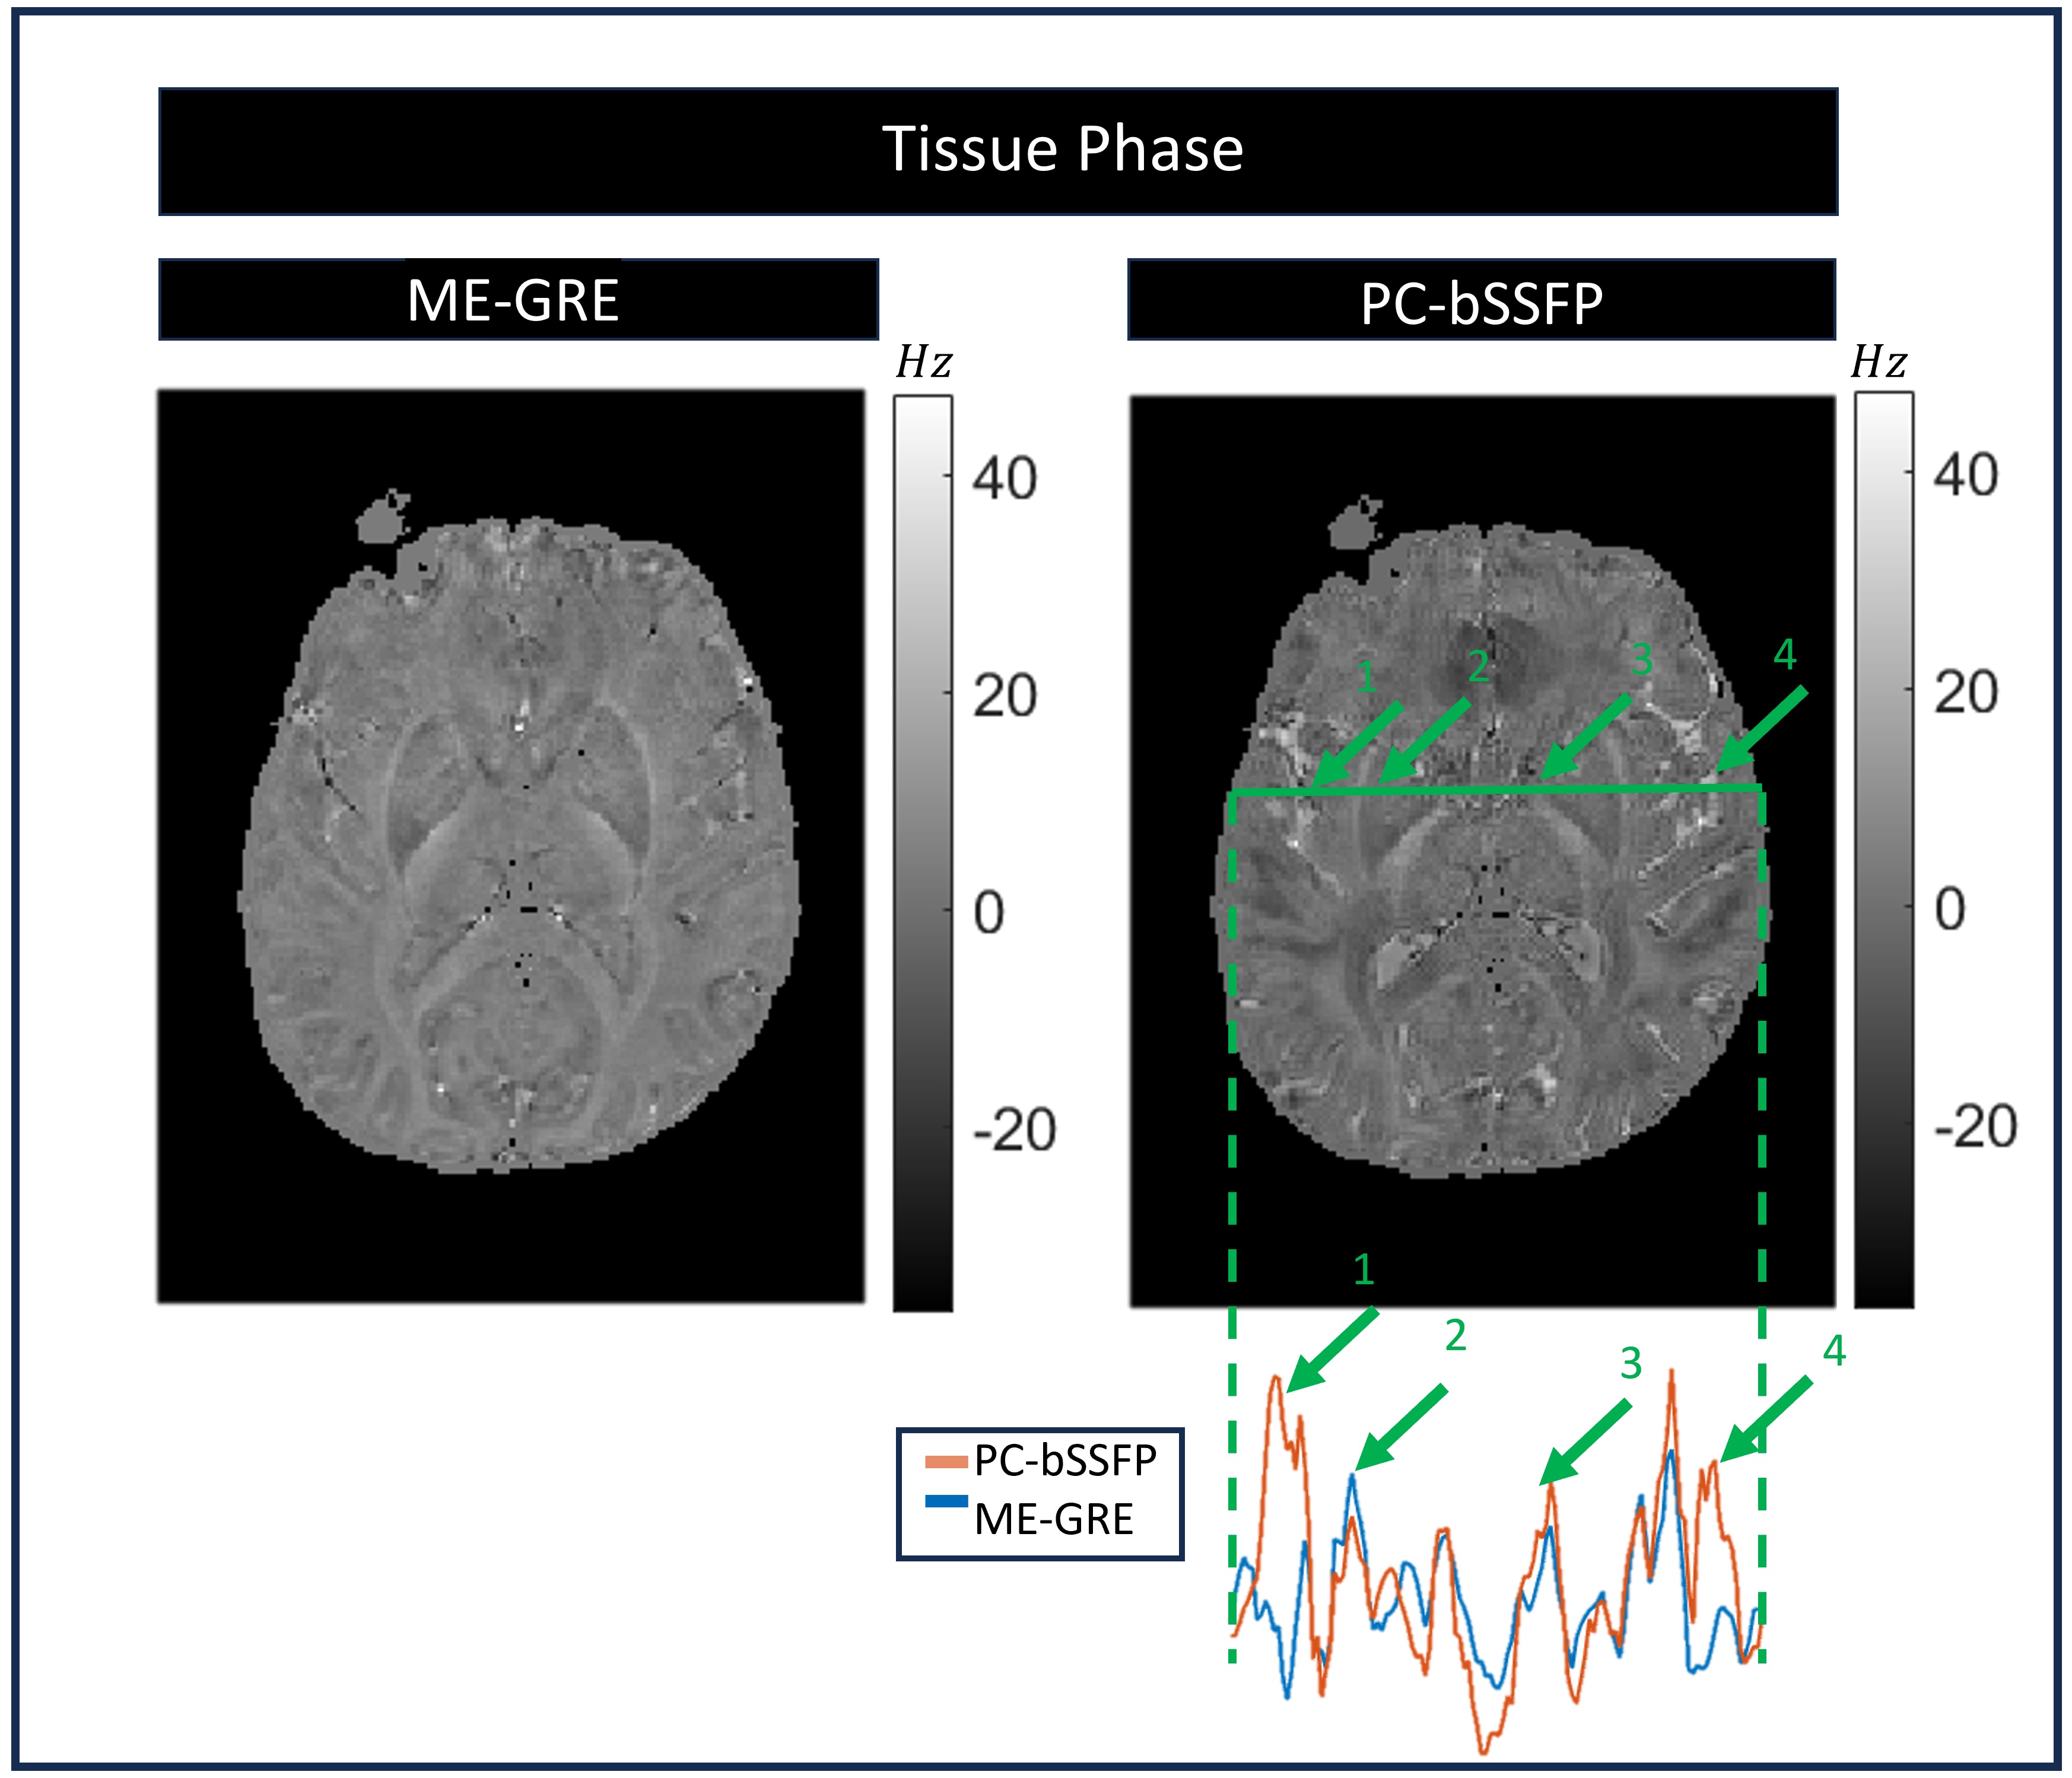
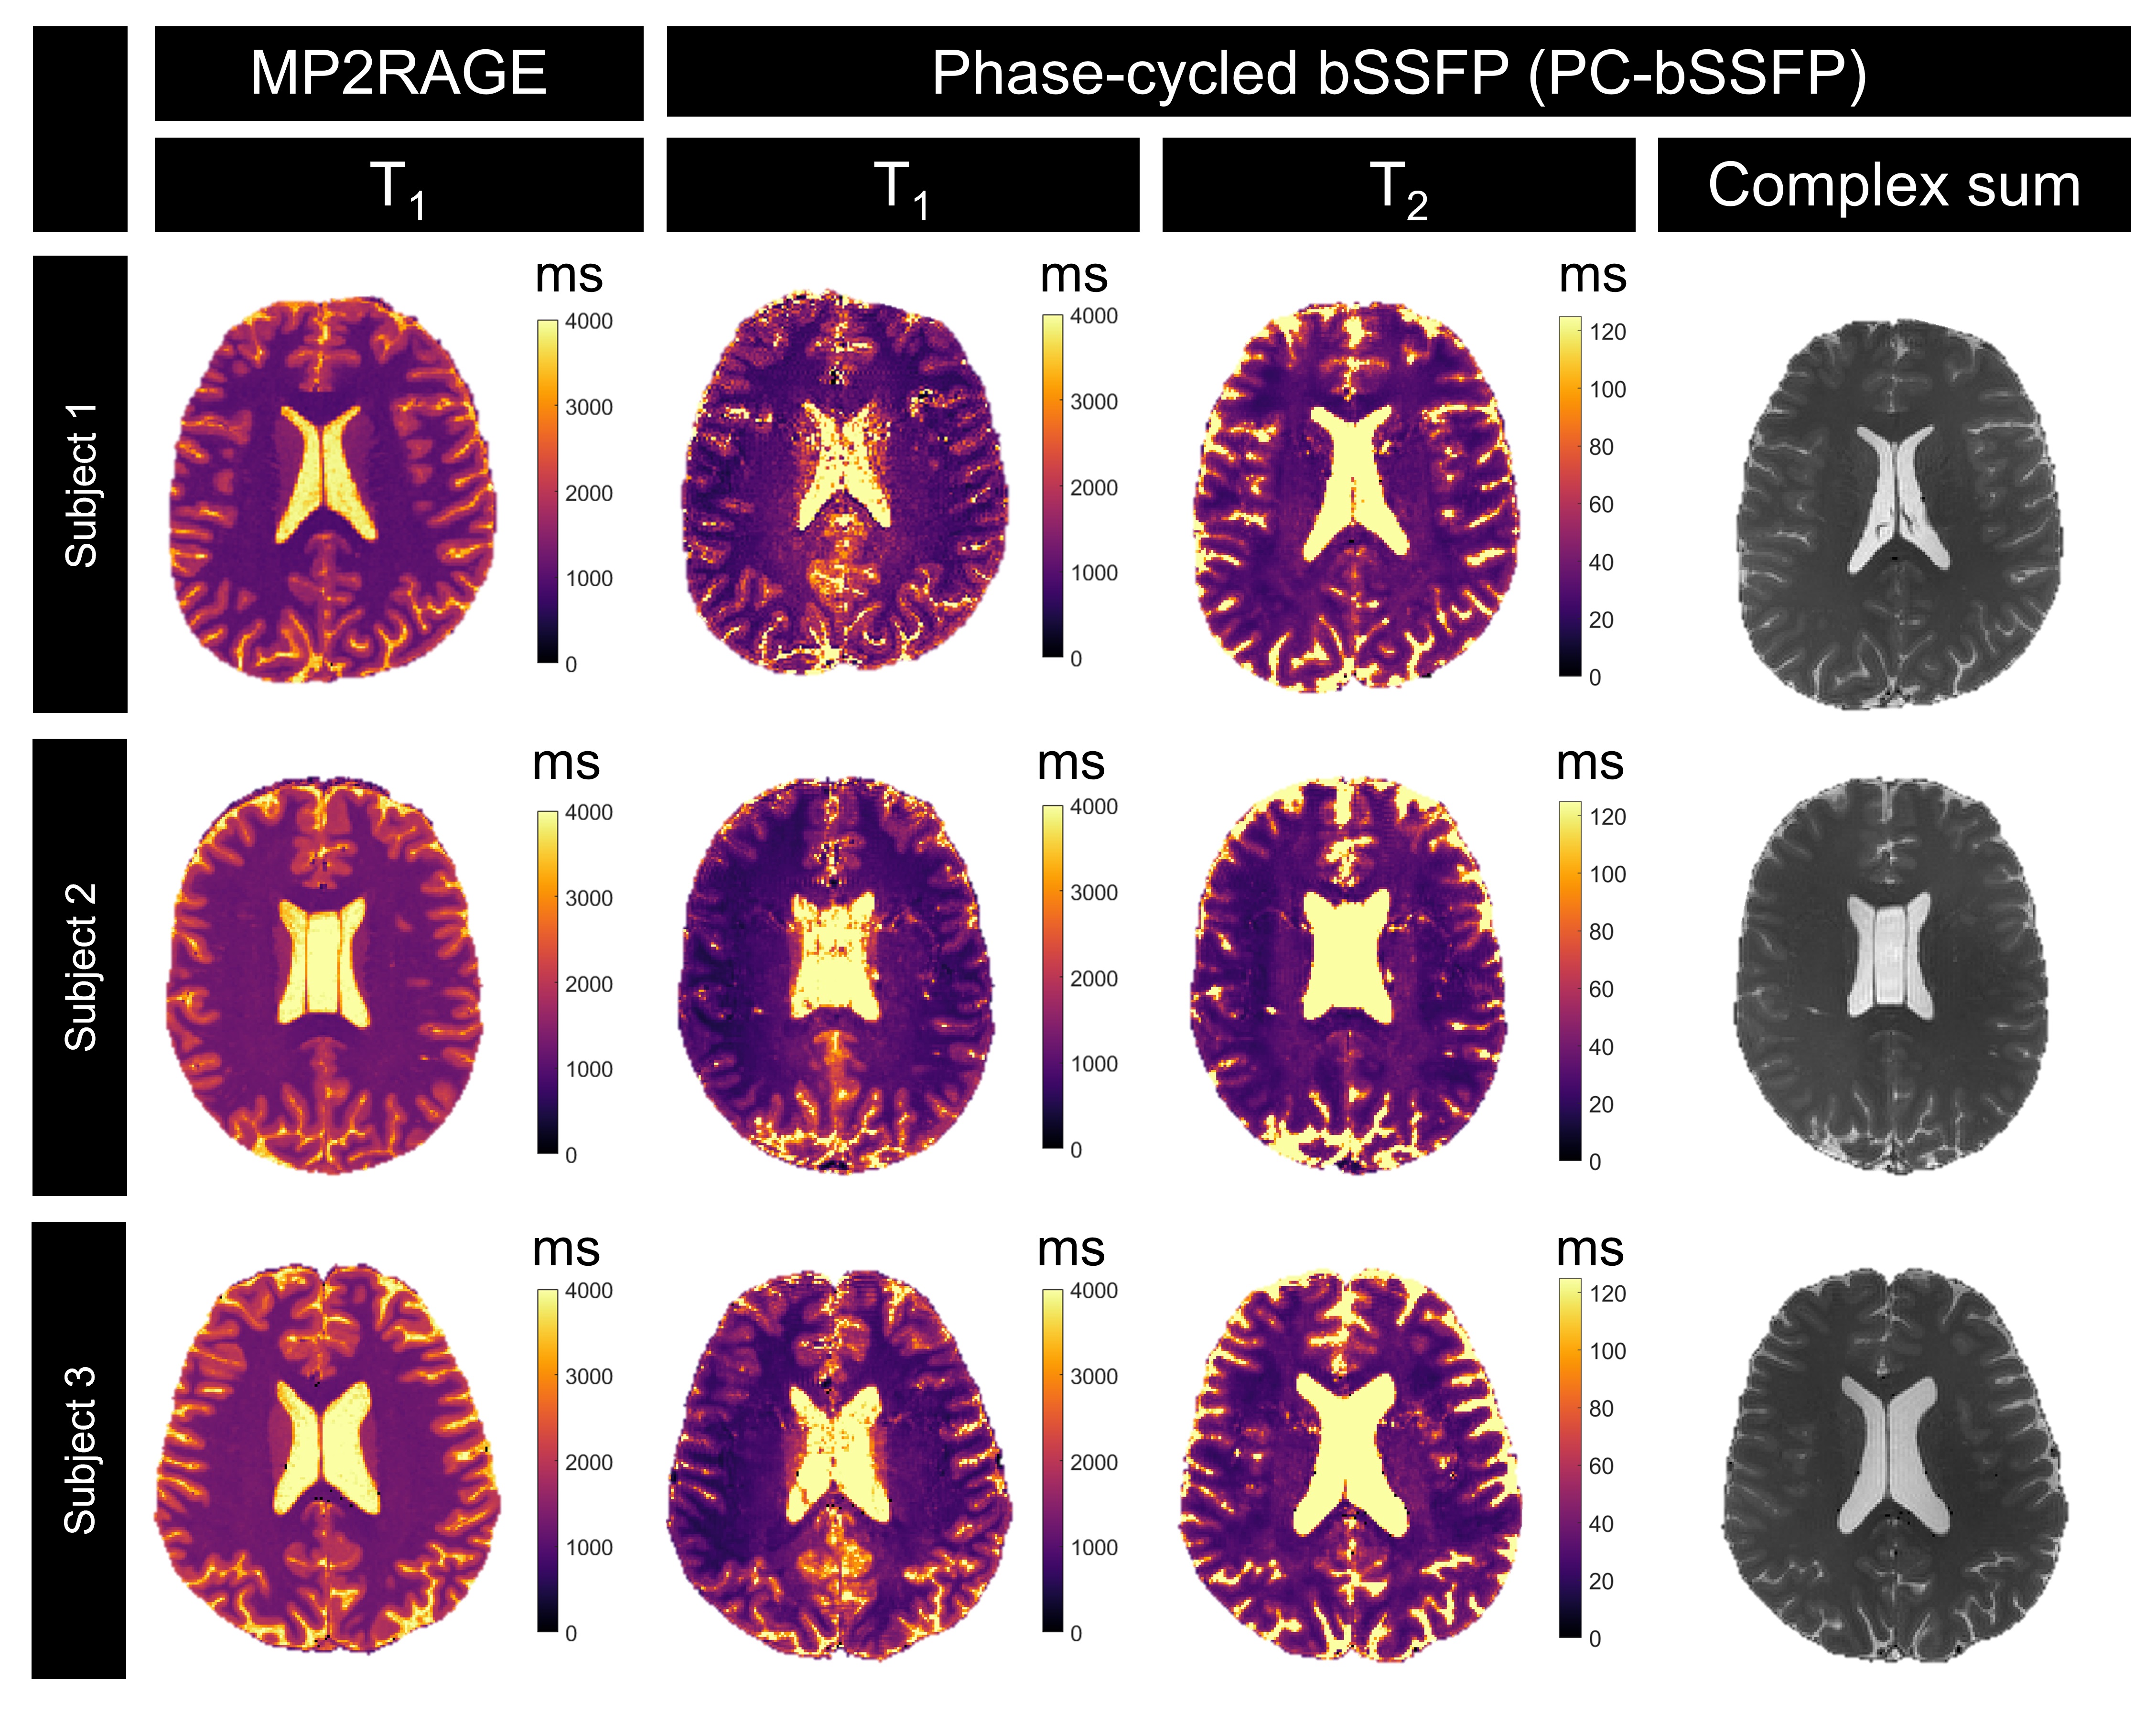
The estimated off-resonance and tissue phase maps of PC-bSSFP agreed well with the references based on ME-GRE (Fig.2,3). The mean absolute error between ME-GRE and PC-bSSFP in the off-resonance and tissue phase maps was 13±2Hz and 8.9±3.7Hz, respectively. A comparison of tissue phase demonstrated an overestimation (Fig.3) in CSF regions. After masking out CSF regions, the mean absolute error in the off-resonance and tissue phase maps obtained with both techniques was 12.1±1Hz and 2.9±1Hz, respectively. Average T1 values for WM, GM and CSF on a selected slice by PC-bSSFP were 1253±43ms, 1612±99ms and 3213±108ms, respectively. Average T1 values found for WM, GM and CSF by MP2RAGE were 1311±14ms, 2020±39ms and 3609±16ms, respectively. Average T2 values found for WM, GM and CSF by PC-bSSFP were 62±5ms, 81±9ms and 233±15ms, respectively. Quantitative maps given in Fig.4 demonstrate contrast similarities in brain structure with reference MP2RAGE T1 maps.Discussion
With low mean absolute errors, the off-resonance and tissue phase maps from PC-bSSFP and reference were in agreement. On the tissue phase maps, anatomical structures were well preserved. Reduction in tissue phase error after CSF mask application suggests an overestimation of tissue phase in CSF, related to asymmetries in bSSFP profiles, which may be caused by chemical exchange15. The underestimation of T1 and T2 values, especially in WM and CSF, with respect to the reference map and previously reported values16,17, were also attributed to potential signal asymmetries18 and magnetization transfer effects19. Future work will aim to reduce the PC-bSSFP scan time and address the estimation biases found in this study.Conclusion
A novel processing method is proposed and tested to extend multiparametric quantification capabilities of PC-bSSFP to susceptibility mapping. Combined with the capability of PC-bSSFP for relaxation time quantification, this study demonstrates the feasibility of PC-bSSFP for multiparametric quantification at 7T.Acknowledgements
The present study was funded by the Swiss National Science Foundation (grant number PCEFP2_194296 and 185909), by the Translational Imaging Center (TIC) of the Swiss Institute for Translational and Entrepreneurial Medicine (SITEM), and by CSEM – Swiss Center for Electronics and Microtechnology.References
[1] A. Deistung, F. Schweser, and J. R. Reichenbach, ‘Overview of quantitative susceptibility mapping’, NMR Biomed., vol. 30, no. 4, p. e3569, Apr. 2017, doi: 10.1002/nbm.3569.
[2] S. Eskreis‐Winkler et al., ‘The clinical utility of QSM: disease diagnosis, medical management, and surgical planning’, NMR Biomed., vol. 30, no. 4, p. e3668, Apr. 2017, doi: 10.1002/nbm.3668.
[3] G. M. Rossi et al., ‘SPARCQ: A new approach for fat fraction mapping using asymmetries in the phase-cycled bSSFP signal profile’, 2020, doi: 10.48550/ARXIV.2005.09734.
[4] Y. Shcherbakova, C. A. T. Van Den Berg, C. T. W. Moonen, and L. W. Bartels, ‘PLANET: An ellipse fitting approach for simultaneous T 1 and T 2 mapping using phase-cycled balanced steady-state free precession: Ellipse Fitting Approach for T 1 and T 2 Mapping’, Magn. Reson. Med., vol. 79, no. 2, pp. 711–722, Feb. 2018, doi: 10.1002/mrm.26717.
[5] O. Bieri and K. Scheffler, ‘Fundamentals of balanced steady state free precession MRI: Fundamentals of Balanced SSFP MRI’, J. Magn. Reson. Imaging, vol. 38, no. 1, pp. 2–11, Jul. 2013, doi: 10.1002/jmri.24163.
[6] Y. Wang and T. Liu, ‘Quantitative susceptibility mapping (QSM): Decoding MRI data for a tissue magnetic biomarker’, Magn. Reson. Med., vol. 73, no. 1, pp. 82–101, Jan. 2015, doi: 10.1002/mrm.25358. [7] M. Bydder, ‘Solution of a complex least squares problem with constrained phase’, Linear Algebra Its Appl., vol. 433, no. 11–12, pp. 1719–1721, Dec. 2010, doi: 10.1016/j.laa.2010.07.011.
[8] N. M. J. P. J.A.M. Bastiaansen, ‘Decoding the phase-cycled bSSFP signal for maximized parameter quantification - T1, T2, proton density and magnetic field inhomogeneity’, 2023 ISMRM ISMRT Annu. Meet. Exhib., 2023.
[9] L. Li and J. S. Leigh, ‘High-Precision Mapping of the Magnetic Field Utilizing the Harmonic Function Mean Value Property’, J. Magn. Reson., vol. 148, no. 2, pp. 442–448, Feb. 2001, doi: 10.1006/jmre.2000.2267.
[10] W. Li, B. Wu, and C. Liu, ‘STI Suite: A software package for quantitative susceptibility imaging’, Proc Intl Soc Mg Reson Med, vol. 22, 2014.
[11] K. R. O’Brien et al., ‘Robust T1-Weighted Structural Brain Imaging and Morphometry at 7T Using MP2RAGE’, PLoS ONE, vol. 9, no. 6, p. e99676, Jun. 2014, doi: 10.1371/journal.pone.0099676.
[12] N. Otsu, ‘A Threshold Selection Method from Gray-Level Histograms’, IEEE Trans. Syst. Man Cybern., vol. 9, no. 1, pp. 62–66, Jan. 1979, doi: 10.1109/TSMC.1979.4310076.
[13] P. Kalavathi and V. B. S. Prasath, ‘Methods on Skull Stripping of MRI Head Scan Images—a Review’, J. Digit. Imaging, vol. 29, no. 3, pp. 365–379, Jun. 2016, doi: 10.1007/s10278-015-9847-8.
[14] M. Ahmed, R. Seraj, and S. M. S. Islam, ‘The k-means Algorithm: A Comprehensive Survey and Performance Evaluation’, Electronics, vol. 9, no. 8, p. 1295, Aug. 2020, doi: 10.3390/electronics9081295.
[15] R. Heule, A. Deshmane, M. Zaiss, K. Herz, P. Ehses, and K. Scheffler, ‘Structure or Exchange? On the Feasibility of Chemical Exchange Detection with Balanced Steady‐State Free Precession in Tissue – An In Vitro Study’, NMR Biomed., vol. 33, no. 3, p. e4200, Mar. 2020, doi: 10.1002/nbm.4200.
[16] W. D. Rooney et al., ‘Magnetic field and tissue dependencies of human brain longitudinal 1 H 2 O relaxation in vivo’, Magn. Reson. Med., vol. 57, no. 2, pp. 308–318, Feb. 2007, doi: 10.1002/mrm.21122.
[17] A. Seginer and R. Schmidt, ‘Phase-based fast 3D high-resolution quantitative T2 MRI in 7 T human brain imaging’, Sci. Rep., vol. 12, no. 1, p. 14088, Aug. 2022, doi: 10.1038/s41598-022-17607-z.
[18] R. Heule, J. Bause, O. Pusterla, and K. Scheffler, ‘Multi‐parametric artificial neural network fitting of phase‐cycled balanced steady‐state free precession data’, Magn. Reson. Med., vol. 84, no. 6, pp. 2981–2993, Dec. 2020, doi: 10.1002/mrm.28325.
[19] P. Van Gelderen, X. Jiang, and J. H. Duyn, ‘Effects of magnetization transfer on T 1 contrast in human brain white matter’, NeuroImage, vol. 128, pp. 85–95, Mar. 2016, doi: 10.1016/j.neuroimage.2015.12.032.
Figures