3713
Validation of a High Contrast Technique and T1 Values Obtained by Divided Subtracted Inversion Recovery (dSIR)1Mātai Medical Research Institute, Gisborne, New Zealand, 2Imaging Institute Cleveland Clinic, Cleveland, OH, United States
Synopsis
Keywords: Quantitative Imaging, Quantitative Imaging, Validation
Motivation: To validate a 2 point high contrast T1 technique using the National Institute of Standards and Technology (NIST) T1 phantom.
Goal(s): Qualitative results produced by the divided subtracted IR (dSIR) images have been shown to give unprecedented T1 contrast in case studies of neuroinflammation [1]. The present study validates the theoretical mechanism of contrast in a standardized commercial T1 phantom.
Approach: Experiments were performed at 1.5T to compare the empirical signal response versus the theoretical prediction in a phantom with known T1s.
Results: The signal response was found to match the predicted bipolar variation very closely.
Impact: Clinicians wishing to employ 2 point T1 estimation techniques can be satisfied that the results are grounded in theory and are quantitatively validated.
Introduction
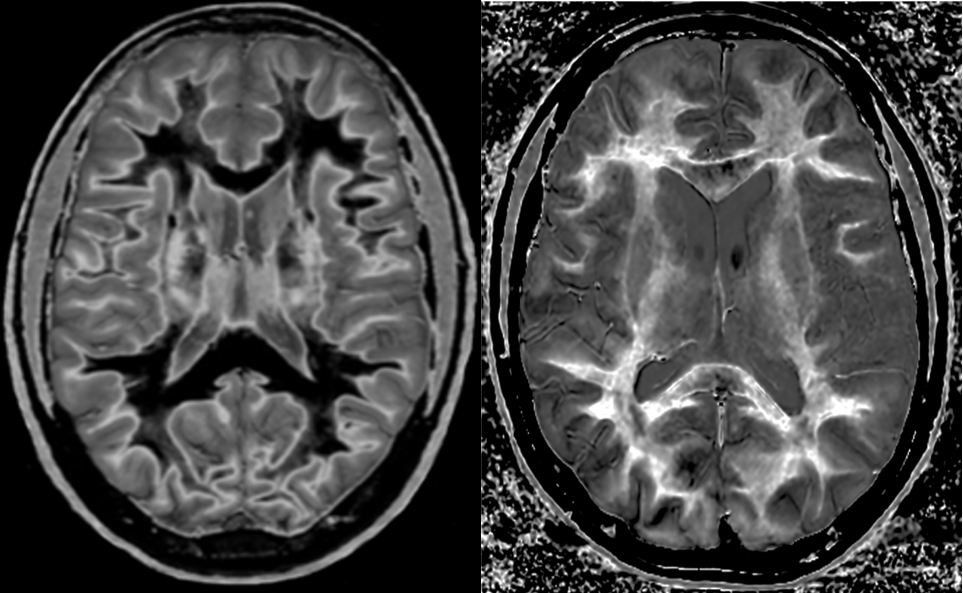
A number of 2-point techniques for obtaining highly T1 contrasted images have been described recently [1-5]. These acquire images at 2 inversion times (TIs) and perform simple mathematical operations - multiplication, addition, subtraction, division - on the complex or magnitude images. This results in an essentially pure T1 contrast normalized for T2, coil shading and other influences on the MR signal, but shaped by one of several tissue property filters.The bipolar dSIR filter [1] (similar to the FLAWS-hc technique [3-4]) has recently been found especially useful in detecting white matter abnormalities in patients with MS and TBI but exhibiting no abnormalities on T2FLAIR and T2W. The changes observed are ascribed to small T1 perturbations due to neuroinflammation that are insufficient to generate contrast on standard clinical sequences.
The present study develops a model for the origin of the high T1 contrast in dSIR images and performs a validation of the accuracy in a standard phantom. The primary purpose is to increase confidence in the high sensitivity of dSIR images to T1 and to relate the observed contrast to a precise physical quantity.
Theory
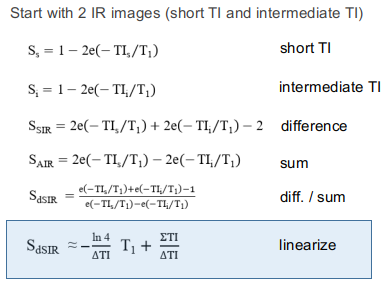
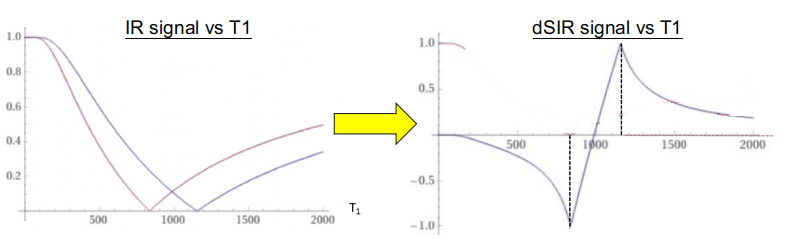
Figure 1 outlines the procedure for forming the dSIR image from 2 IR images with a narrowly spaced ΔTI. The result is a scaled and shifted T1 map that exhibits a bipolar filter shape due to magnitude ambiguity at the null points. Although the ambiguity can be removed using the phase-difference between the IRs [4], in practice the reduction in dynamic range is advantageous for displaying the T1 in a specific range (between the null points - aka the "middle Domain").Figure 2 shows the theoretical bipolar filter response of dSIR versus T1. Three key features are exemplified:
- Linearity in the middle Domain, which provides high T1 contrast over a narrow range of T1.
- Damped response outside the middle Domain, which reduces the dynamic range of the image.
- Extrema at ±1 that provide sharp boundaries between tissues with differing T1s.
Results
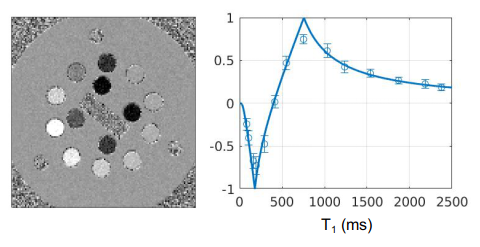
To validate the theoretical filter shape and accuracy of the T1 in the middle Domain, phantom experiments were performed at 1.5T on the NIST T1 phantom. Experimental conditions were: 1.5T, 2D spin echo sequence, TE 10 ms, TR 16 s, bandwidth 1000 Hz/pixel, body coil, matrix 128x128, slice 2 mm, no acceleration, no filtering, no post-processing. 11 inversion times were acquired in increments from 24 ms to 1024 ms. Fitted T1s using nonlinear least squares were in close agreement with published values [6] (slope 1.005±0.024, intercept -16±28 ms).Figure 4a shows the dSIR image produced from 2 TIs (124 and 524 ms). The compressed dynamic range has its peak signal at (ΣTI+ΔTI) / ln4 ≈ 756 ms and a zero crossing at ΣTI / ln4 ≈ 467 ms.
Figure 4b plots the dSIR signal versus the known T1 values in all phantom compartments. The error bar represents standard deviation. The corresponding theoretical dSIR curve is overlaid on the data points, showing good agreement across the range of T1 and close adherence to the bipolar filter shape.
Discussion
The dSIR and FLAWS-hc techniques are robust 2-point methods for generating high T1 contrast images [1-5]. Studies in patients have shown changes in white matter that are not detected on state-of-the-art clinical sequences [1]. The origin of the contrast can be traced to a magnification of T1 differences by a factor of ln4 / ΔTI over a narrow range of T1, and a damped response outside. The full dynamic range of T1 may be recovered using phase information [4], however a key clinical feature of the dSIR is it focus on a specific T1 window coupled with sharp T1 boundaries. The factor ln4 / ΔTI implies that sensitivity increases with a smaller ΔTI (which has been empirically reported [1]) at the expense of accuracy outside the middle Domain. This narrow focus differs from prior approaches to T1 estimation and permits a minimal 2-point acquisition rather than general T1 mapping with multiple TIs.In conclusion, the qualitative features of dSIR have been supported by theoretical derivation (Figure 1) and quantitative validation in the NIST phantom (Figure 4), which increases confidence in the unprecedented contrast observed in patient images.
Acknowledgements
No acknowledgement found.References
[1] Ma YJ, Moazamian D, Cornfeld DM, Condron P, Holdsworth SJ, Bydder M, Du J, Bydder GM. Improving the understanding and performance of clinical MRI using tissue property filters and the central contrast theorem, MASDIR pulse sequences and synergistic contrast MRI. Quant Imaging Med Surg. 2022 Sep;12(9):4658-4690. doi: 10.21037/qims-22-394.
[2] Marques JP, Kober T, Krueger G, van der Zwaag W, Van de Moortele PF, Gruetter R. MP2RAGE, a self bias-field corrected sequence for improved segmentation and T1-mapping at high field. Neuroimage. 2010 Jan 15;49(2):1271-81. doi: 10.1016/j.neuroimage.2009.10.002.
[3] Beaumont J, Saint-Jalmes H, Acosta O, Kober T, Tanner M, Ferré JC, Salvado O, Fripp J, Gambarota G. Multi T1-weighted contrast MRI with fluid and white matter suppression at 1.5 T. Magn Reson Imaging 2019;63:217-25. 10.1016/j.mri.2019.08.010
[4] Beaumont J, Gambarota G, Saint-Jalmes H, Acosta O, Ferré JC, Raniga P, Fripp J. High-resolution multi-T1 -weighted contrast and T1 mapping with low B 1 >+ sensitivity using the fluid and white matter suppression (FLAWS) sequence at 7T. Magn Reson Med 2021;85:1364-78. 10.1002/mrm.28517
[5] Dokumacı AS, Aitken FR, Sedlacik J, Bridgen P, Tomi-Tricot R, Mooiweer R, Vecchiato K, Wilkinson T, Casella C, Giles S, Hajnal JV, Malik SJ, O'Muircheartaigh J, Carmichael DW. Simultaneous Optimization of MP2RAGE T1 -weighted (UNI) and FLuid And White matter Suppression (FLAWS) brain images at 7T using Extended Phase Graph (EPG) Simulations. Magn Reson Med. 2023 Mar;89(3):937-950. doi: 10.1002/mrm.29479.
[6] Kathryn E. Keenan, Karl F. Stupic, Michael A. Boss, Stephen E. Russek, Thomas L. Chenevert, Pottumarthi V. Prasad, Wilburn E. Reddick, Jie Zheng, Peng Hu, Edward F. Jackson. ISMRM 24th Annual Meeting 2016:3290
Figures