3712
Test-retest reliability of myelin volume fraction quantified with multicomponent MPnRAGE1Medical Physics, University of Wisconsin-Madison, Madison, WI, United States, 2Waisman Center, University of Wisconsin-Madison, Madison, WI, United States, 3Pediatrics, University of Wisconsin-Madison, Madison, WI, United States
Synopsis
Keywords: Quantitative Imaging, Brain, Myelin
Motivation: There is a need for rapid and high-resolution myelin water imaging techniques, while high test-retest reliability is necessary for widespread adoption.
Goal(s): Evaluate the repeatability of multicomponent relaxometry with MPnRAGE.
Approach: Data from 12 adolescent subjects scanned 3 consecutive times were reconstructed with motion-correction and fit to multicomponent MPnRAGE model. Coefficient of variation (CoV) was calculated across the 3 scans for each subject for several white and gray matter regions.
Results: Mean CoV was <7% across white matter regions. Myelin volume fraction trends between regions were also consistent with prior T2-based techniques.
Impact: A recently developed T1-based technique for myelin water imaging with MPnRAGE demonstrates high repeatability across consecutive scans. Multicomponent relaxometry with MPnRAGE enables high-resolution and motion-corrected myelin mapping in under 10 minutes of scan time.
Introduction
Myelin water imaging (MWI) techniques have been utilized to study the development and degradation of the myelin sheath that surrounds nerve axons and plays a critical and unique role in brain connectivity and communication. The primary assumption for MWI is that the signal from water within the myelin lipid bilayers can be disentangled from other signals via multicomponent relaxometry1. Prior work with different pulse sequences and analysis techniques have consistently reported at least two water compartments with distinct T1 and T2 relaxation times, with the faster relaxing of the two being assigned to “myelin water”. Historically, multi-echo T2 (MET22,3,4) relaxometry and T1 & T2 steady-state (mcDESPOT5) techniques have been the primary techniques for MWI. More recently, T1-based techniques have been developed using inversion time series from the PURR6 and MPnRAGE7,8 pulse sequences, the latter forming the basis of this work. The extension of MPnRAGE to perform multicomponent relaxometry enables the calculation of myelin volume fraction (MVF) maps that are high-resolution (1 mm3), motion-corrected, and require less than 10 minutes of scan time. The purpose of this work is to examine the test-retest repeatability of MVF from multicomponent MPnRAGE.Methods
Study population and data collection: Six male and six female children between the ages of 6 and 14 years (9.4 ± 2.6 years) underwent three 7-minute MPnRAGE exams without the use of sedation and with and without padding to suppress motion9,10,11. MPnRAGE acquisition parameters included TR=4.9ms, TE=1.8ms, flip angles of 4° (325 views) and 8° (61 views), and a delay time of 500ms before each preparation pulse.Reconstruction and multicomponent fitting: MPnRAGE data were motion corrected as described in Kecskemeti et al., 2018 and reconstructed with a local low-rank subspace approach consisting of 8 basis functions generated to span the expected range of parameters. Parameter fitting was performed in PyTorch by minimizing mean squared error of all voxels using the L-BFGS optimizer. First, a single component fit with three unknowns (T1, IE, B1) was performed, and the B1 map smoothed with a Gaussian blur and fixed7,12 to eliminate an unknown from the following multicomponent fit with five unknowns (T1F, IEF, T1S, IES, and MVF).
Analysis: Region of interest (ROI) analysis was performed by aligning the MPnRAGE T1-weighted images to MNI space with ANTs and inverse warping the JHU and Harvard-Oxford brain atlases to native space. The coefficient of variation (CoV) of each region across the repeated scans was computed. Additionally, MVF maps were transformed to MNI space and a mean MVF map was created from all 36 acquisitions (12 subjects with 3 acquisitions each).
Results
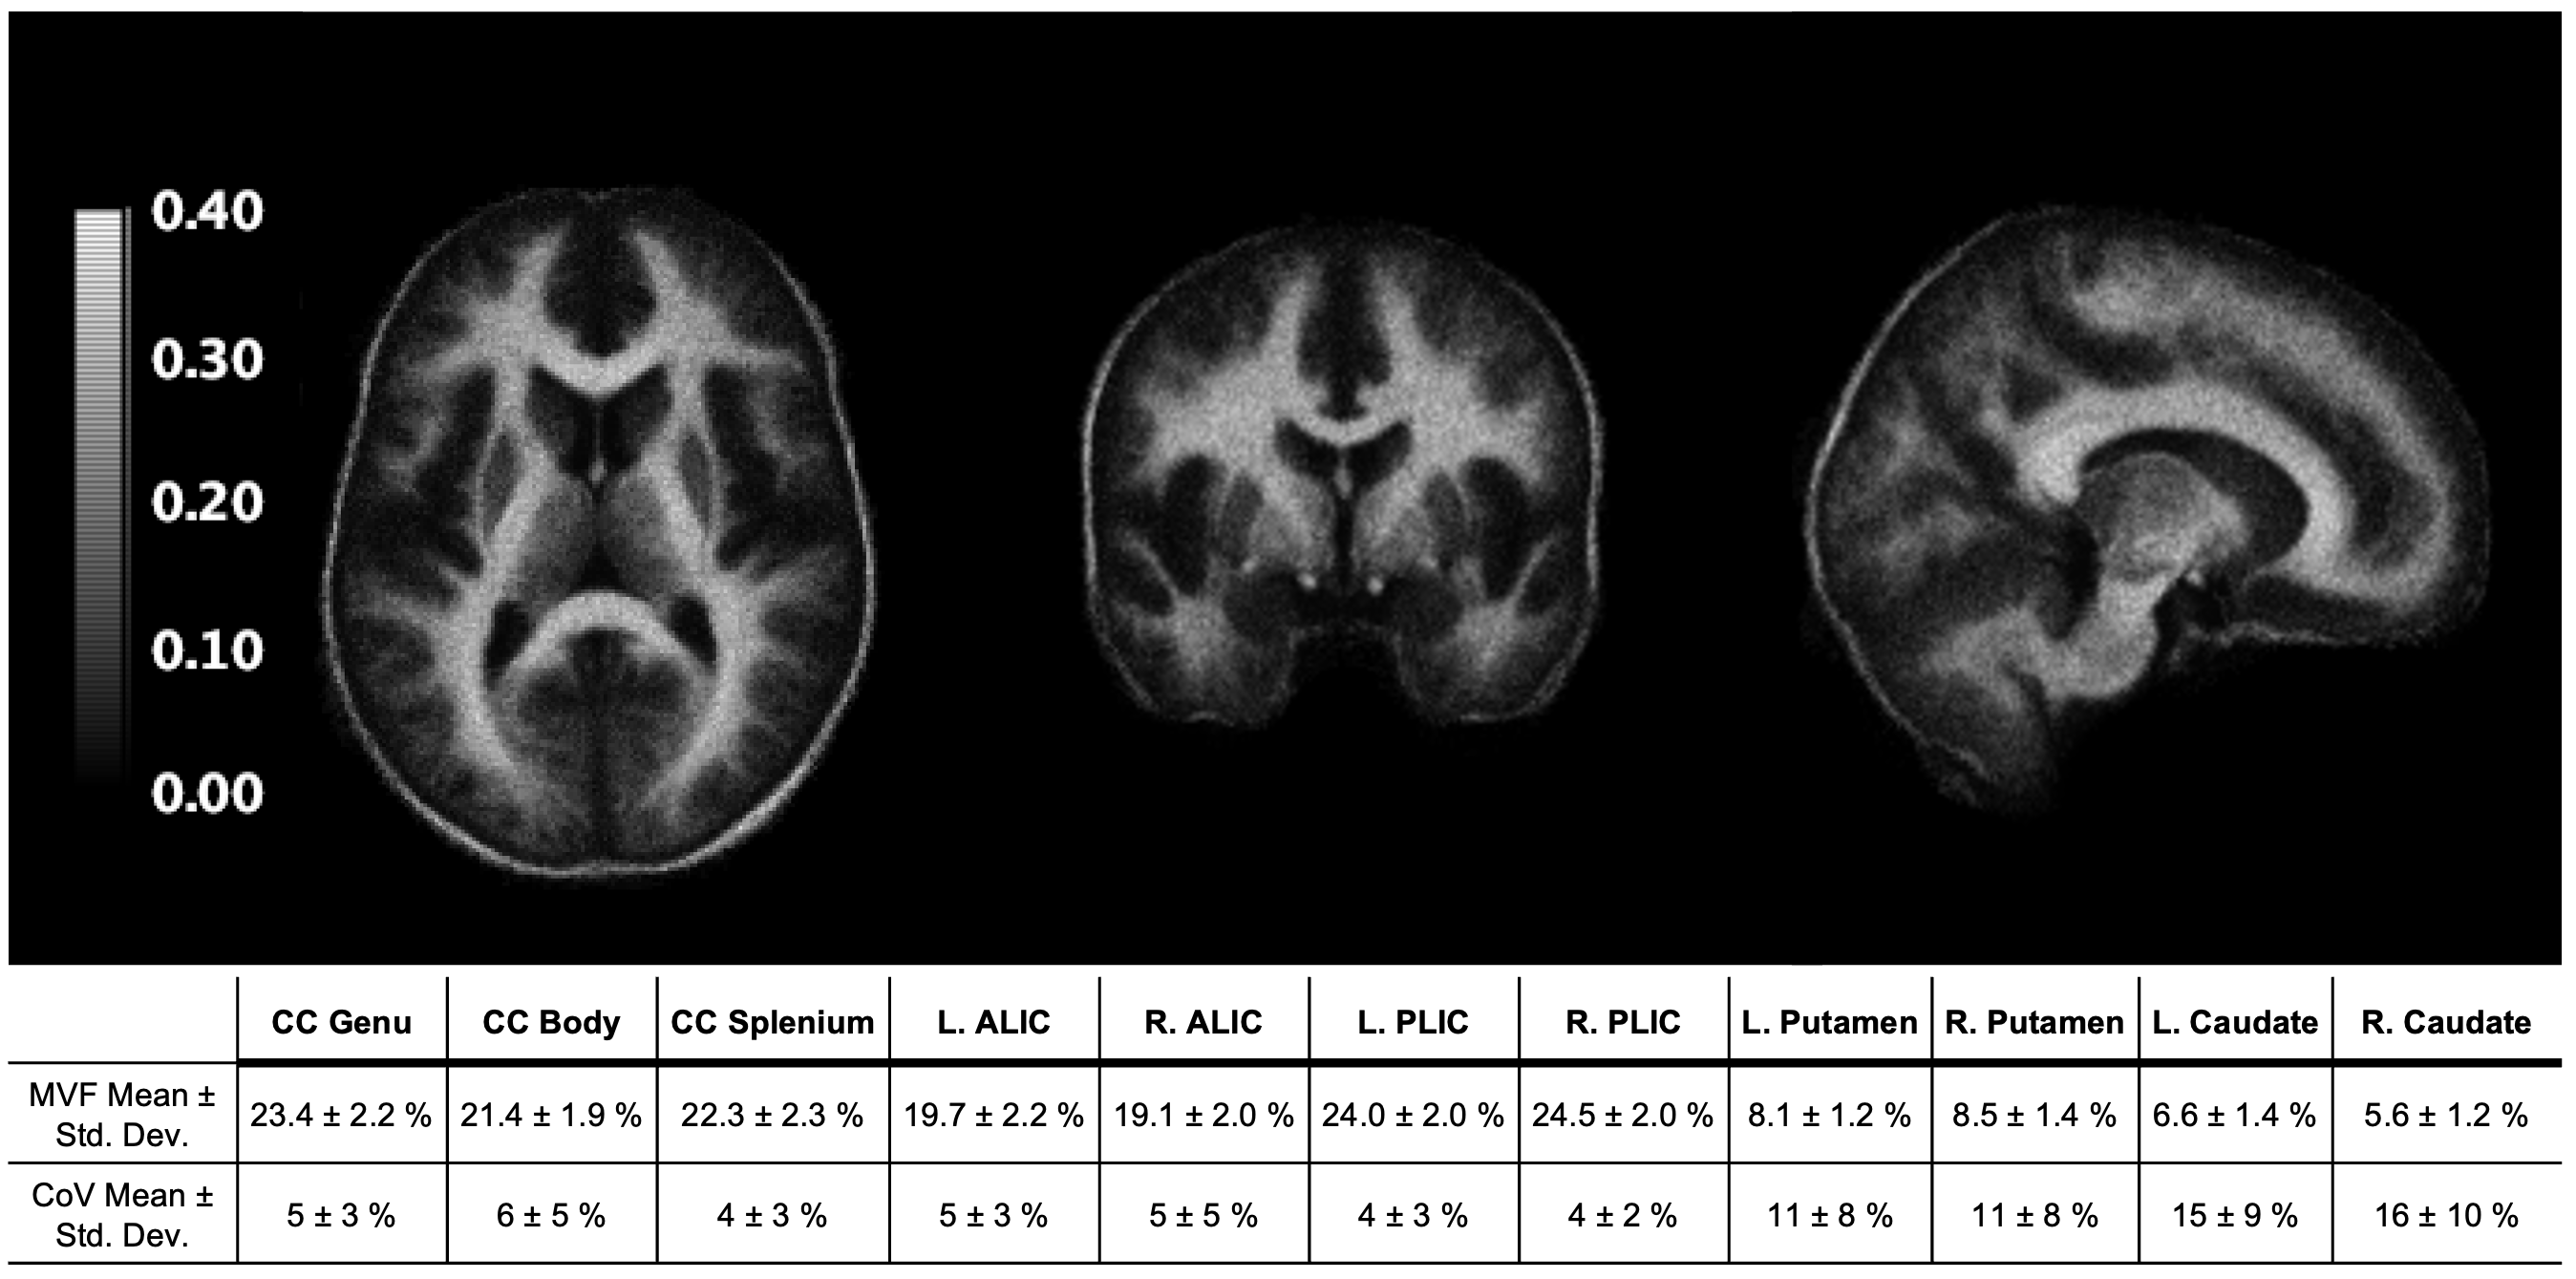
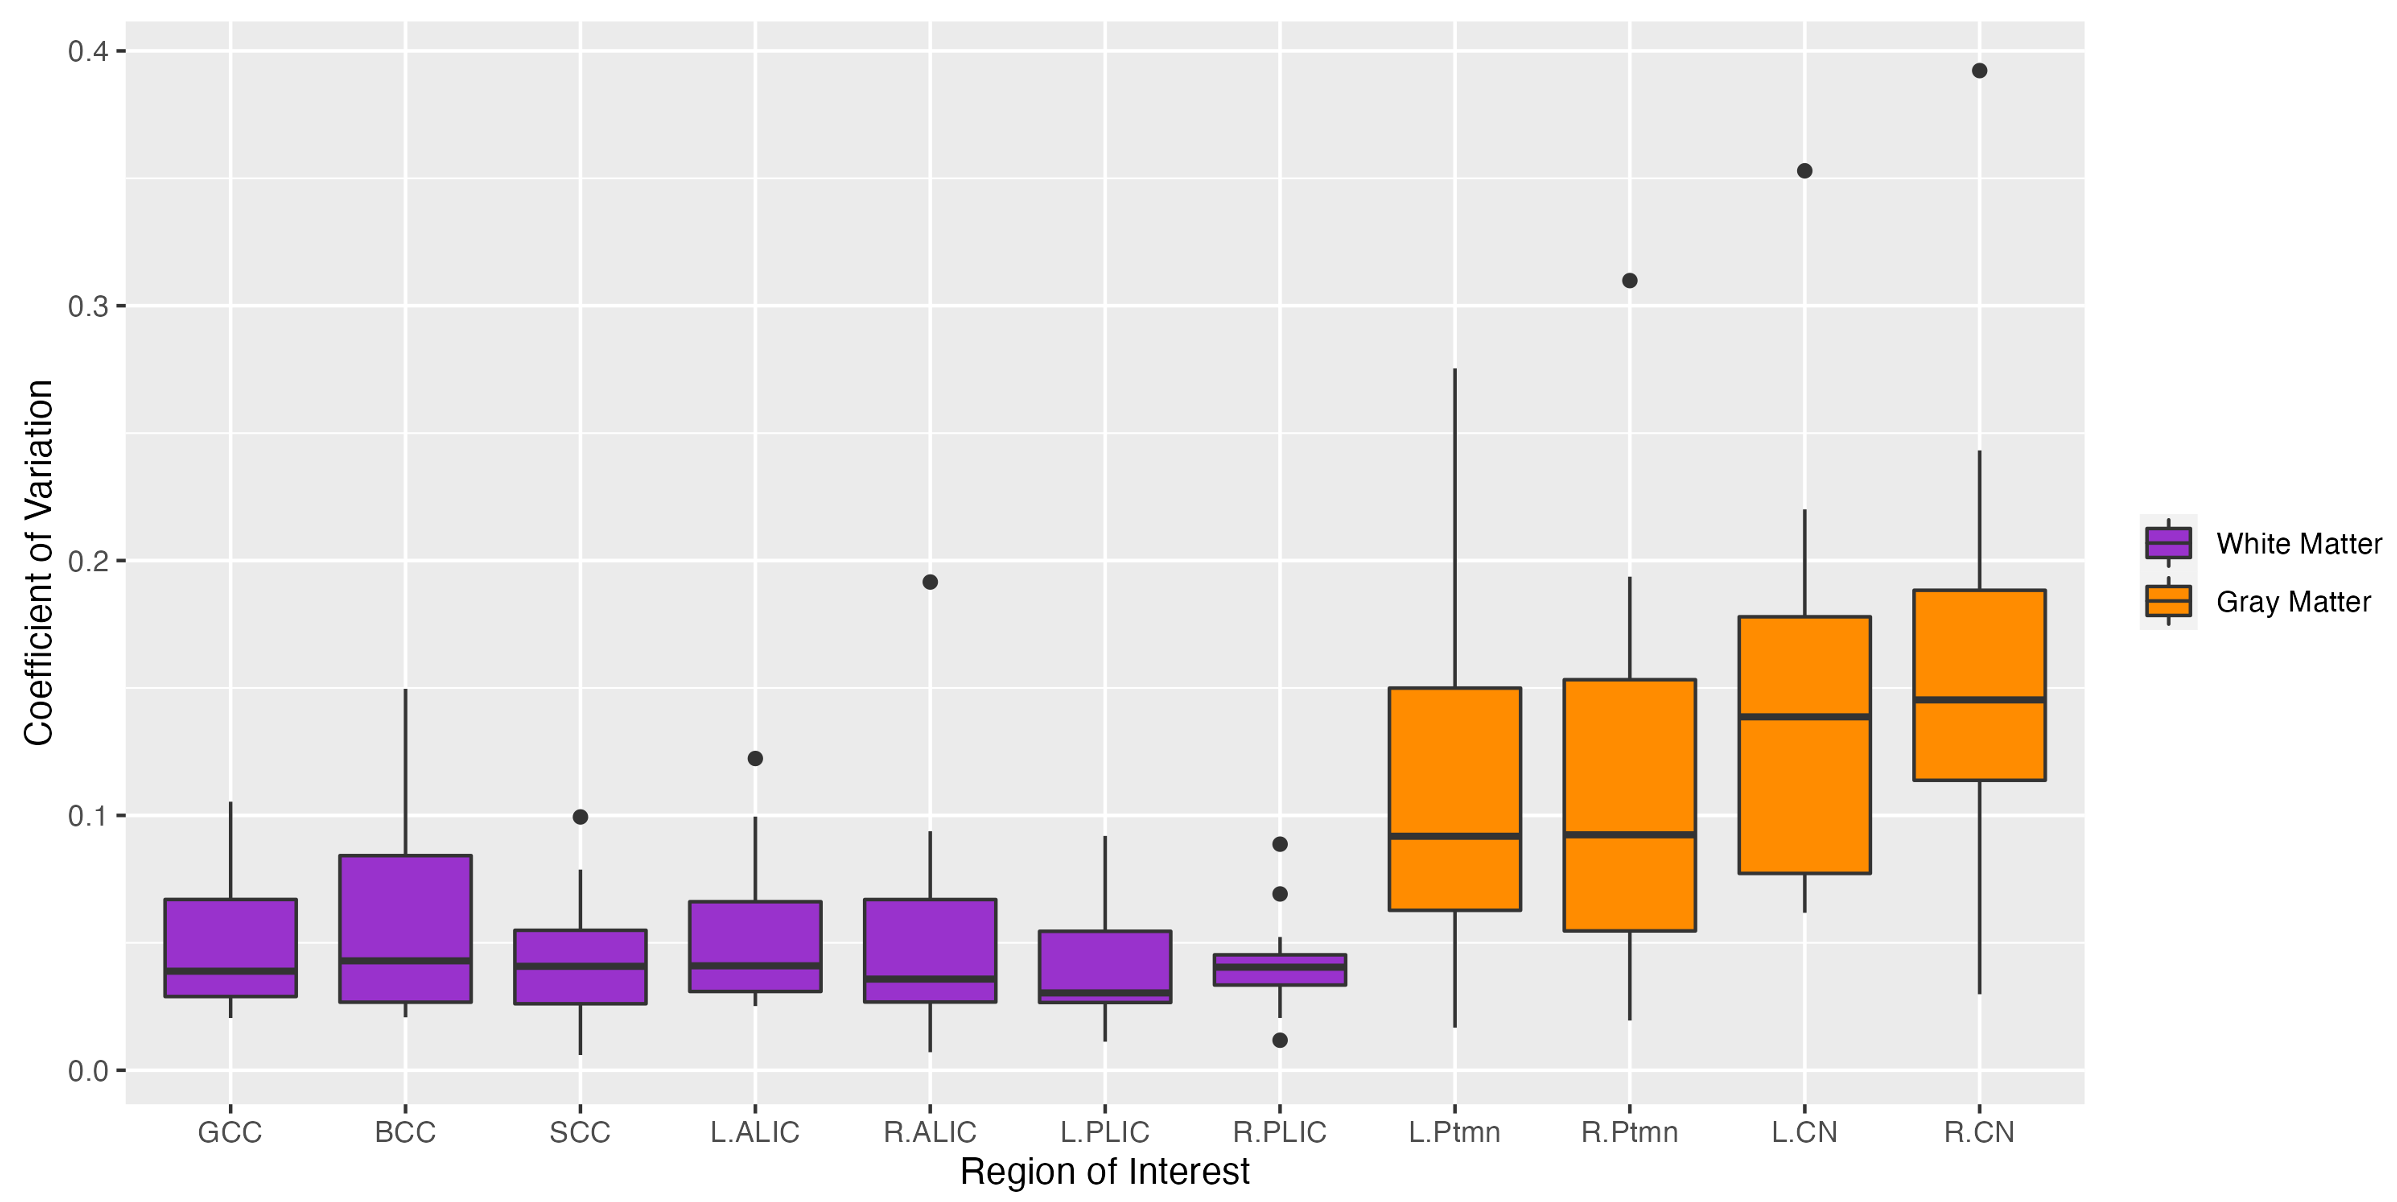
The mean MVF map and ROI values across all acquisitions are shown in Figure 1. The mean MVF in the genu, body, and splenium of the corpus callosum was 23.4%, 21.4%, and 22.3% respectively. In the anterior and posterior limbs of the internal capsule, the mean MVF was 19.4% and 24.3%. MVF was lower in the gray matter, at 8.3% in the putamen and 6.1% in the caudate.Box plots displaying mean CoV results for each region across all 12 subjects is shown in Figure 2. Across all selected white matter ROIs, the mean CoV was below 7% for each ROI. The CoV for selected gray matter ROIs was higher than in white matter.
Discussion
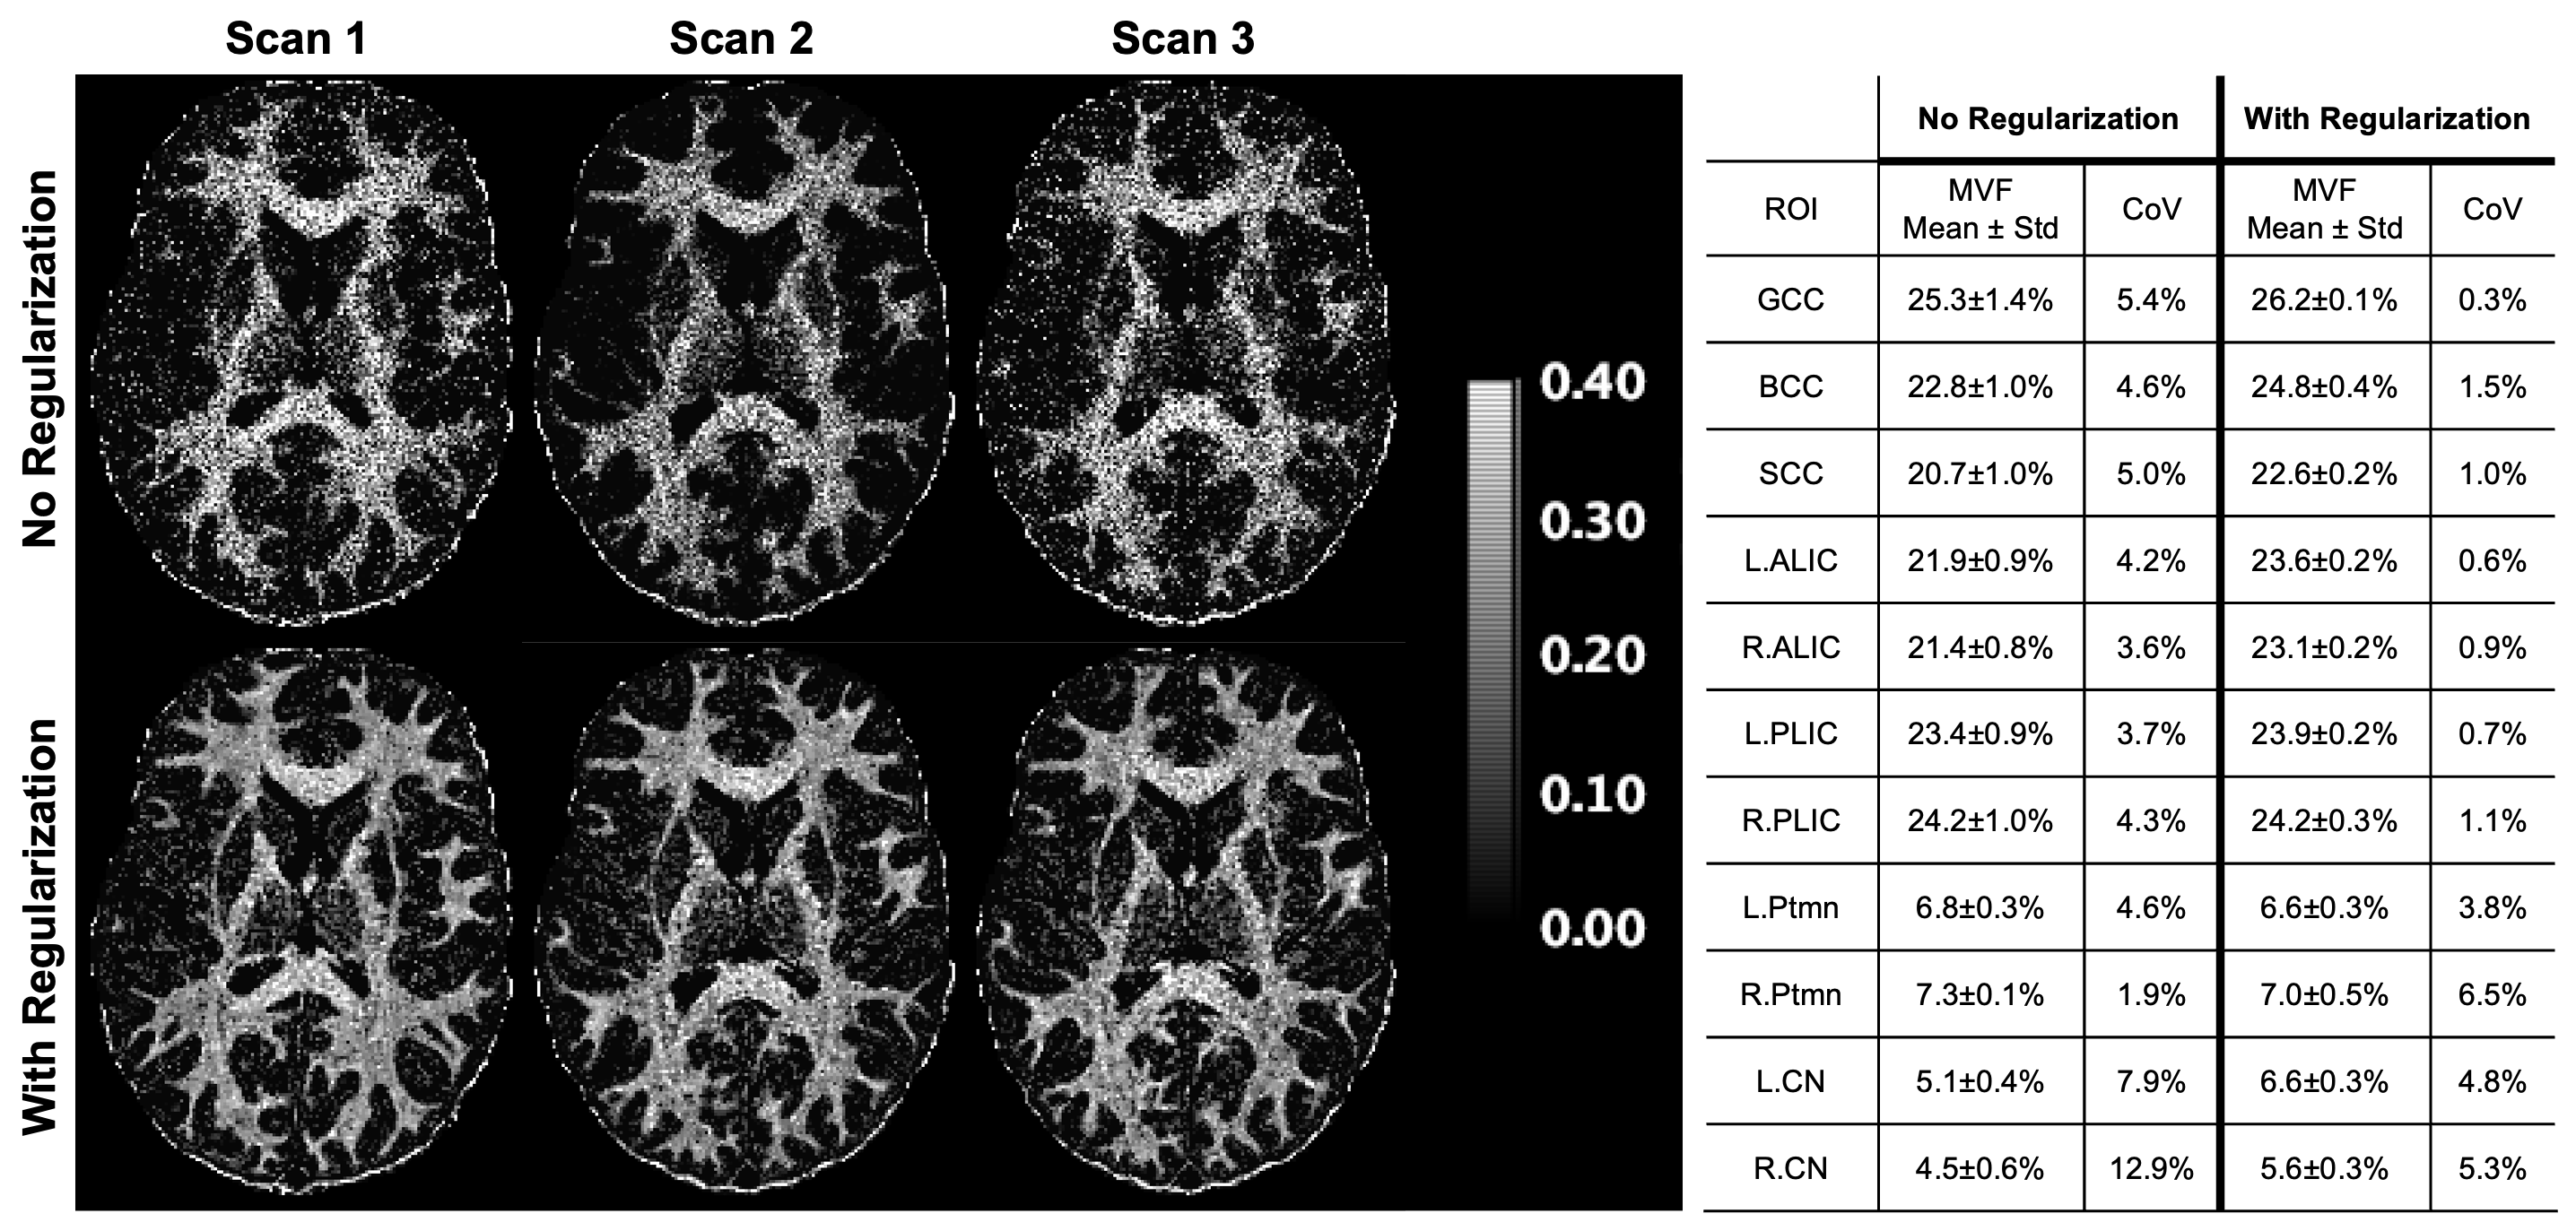
Our results demonstrate that MVF derived from multicomponent MPnRAGE is repeatable, with CoV values less than 7% in white matter. Additionally, the change in MVF values between regions is in general agreement with multi-echo T2 techniques: MVF is greater in the posterior internal capsules than the corpus callosum; MVF is greater in the putamen compared to the caudate3,4. However, individual MVF maps remain noisy, and we hypothesize this noise is contributing to higher CoV for test-retest. A number of additional strategies are currently being investigated to improve fitting quality and decrease CoV, such as adding more fitting passes with fixed parameters and fewer unknowns. Additionally, spatial regularization can be implemented in the whole-volume fitting procedure. Preliminary results with L1 and L2 regularization during fitting demonstrate a decrease in noise and CoV (Figure 3), but further work is needed to ensure the fitting results are not overregularized.Conclusion
Multicomponent MPnRAGE is a promising new MWI technique, capable of acquiring motion-corrected myelin maps with 1 mm3 isotropic resolution in under 10 minutes. CoV values less than 7% in white matter indicate that the technique is repeatable, although further optimization is currently underway to improve performance.Acknowledgements
This work was supported by R00 MH11056 (Dr. Dean) from the National Institute of Mental Health and 1R01 HD108868 (Dr. Kecskemeti) from the Eunice Kennedy Shriver NICHD, National Institutes of Health. Infrastructure support was also provided, in part, by grant U54 HD090256 from the Eunice Kennedy Shriver NICHD, National Institutes of Health (Waisman Center).References
- Does M. D. (2018). Inferring brain tissue composition and microstructure via MR relaxometry. NeuroImage, 182, 136–148. https://doi.org/10.1016/j.neuroimage.2017.12.087
- MacKay, A., Whittall, K., Adler, J., Li, D., Paty, D., & Graeb, D. (1994). In vivo visualization of myelin water in brain by magnetic resonance. Magnetic resonance in medicine, 31(6), 673–677. https://doi.org/10.1002/mrm.1910310614
- Whittall, K. P., MacKay, A. L., Graeb, D. A., Nugent, R. A., Li, D. K., & Paty, D. W. (1997). In vivo measurement of T2 distributions and water contents in normal human brain. Magnetic resonance in medicine, 37(1), 34–43. https://doi.org/10.1002/mrm.1910370107
- Prasloski, T., Rauscher, A., MacKay, A. L., Hodgson, M., Vavasour, I. M., Laule, C., & Mädler, B. (2012). Rapid whole cerebrum myelin water imaging using a 3D GRASE sequence. NeuroImage, 63(1), 533–539. https://doi.org/10.1016/j.neuroimage.2012.06.064
- Deoni, S. C., Rutt, B. K., Arun, T., Pierpaoli, C., & Jones, D. K. (2008). Gleaning multicomponent T1 and T2 information from steady-state imaging data. Magnetic resonance in medicine, 60(6), 1372–1387. https://doi.org/10.1002/mrm.21704
- Labadie, C., Lee, J. H., Rooney, W. D., Jarchow, S., Aubert-Frécon, M., Springer, C. S., Jr, & Möller, H. E. (2014). Myelin water mapping by spatially regularized longitudinal relaxographic imaging at high magnetic fields. Magnetic resonance in medicine, 71(1), 375–387. https://doi.org/10.1002/mrm.24670
- Kecskemeti, S., Samsonov, A., Hurley, S. A., Dean, D. C., Field, A., & Alexander, A. L. (2016). MPnRAGE: A technique to simultaneously acquire hundreds of differently contrasted MPRAGE images with applications to quantitative T1 mapping. Magnetic resonance in medicine, 75(3), 1040–1053. https://doi.org/10.1002/mrm.25674
- Weaver, J. M., Kecskemeti, S., Guerrero-Gonzalez, J. M., Alexander, A. L., Dean, D. C. (2023). High-Resolution Myelin Water Imaging Using MPnRAGE. Proceedings of the Annual Meeting of the International Society for Magnetic Resonance in Medicine. https://submissions.mirasmart.com/ISMRM2023/Itinerary/Files/PDFFiles/ViewAbstract.aspx
- Kecskemeti, S. R., & Alexander, A. L. (2020). Test-retest of automated segmentation with different motion correction strategies: A comparison of prospective versus retrospective methods. NeuroImage, 209, 116494. https://doi.org/10.1016/j.neuroimage.2019.116494
- Kecskemeti, S., & Alexander, A. L. (2020). Three-dimensional motion-corrected T1 relaxometry with MPnRAGE. Magnetic resonance in medicine, 84(5), 2400–2411. https://doi.org/10.1002/mrm.28283
- Kecskemeti, S., Freeman, A., Travers, B. G., & Alexander, A. L. (2021). FreeSurfer based cortical mapping and T1-relaxometry with MPnRAGE: Test-retest reliability with and without retrospective motion correction. NeuroImage, 242, 118447. https://doi.org/10.1016/j.neuroimage.2021.118447
- Clare, S., & Jezzard, P. (2001). Rapid T(1) mapping using multislice echo planar imaging. Magnetic resonance in medicine, 45(4), 630–634. https://doi.org/10.1002/mrm.1085
Figures