3709
Fast Spin Echo based T2 Mapping with Point Spread Function Correction1Physics, University of Windsor, Windsor, ON, Canada
Synopsis
Keywords: Quantitative Imaging, Relaxometry, FSE, PSF, optimization
Motivation: Fast Spin Echo (FSE) based method can provide faster T2 mapping compared to the multi-echo spin echo method. However, the varying Point Spread Functions (PSFs) among different echo time images lead to artifacts in the T2 and proton density ($$$\rho$$$) maps.
Goal(s): Developing an algorithm to address PSF artifacts in the FSE-based method that enables faster and more accurate T2 mapping.
Approach: An optimization process was designed to determine voxel-wise T2 and $$$\rho$$$ values consistent with the acquired data, especially considering various PSFs.
Results: The method was validated through simulations, phantom measurements, and mouse brain scans, resulting in improved T2 and $$$\rho$$$ maps.
Impact: The method enabled high-quality, fast T2 mapping without the need for any modifications to the FSE pulse sequence. Therefore, it can be readily applied to quantitative studies on subjects that can be imaged with FSE.
Introduction
T2 mapping can be employed to quantitatively study a wide range of pathologies. It is achieved by acquiring a series of T2 weighted images and performing voxel-wise fitting. The commonly used multi-echo spin-echo method requires long scan times. Individual T2 weighted images can be acquired with fast spin echo (FSE), and the total scan time can be reduced by collecting only a moderate number of images. However, these images with different echo times (TEs) have different point spread functions (PSFs), leading to artifacts in the T2 map, such as blurring and edge enhancement. A correction using the average T2 value can be performed to reduce these artifacts 1. However, this correction method may not be effective when there is a large range of T2 values. We propose an iterative PSF correction method that enables fast and accurate T2 mapping.Methods
The flow of the proposed method is illustrated in Figure 1. The average correction, or uncorrected T2 map, and shortest TE image are used as initial guesses for T2 and proton density ($$$\rho$$$), respectively. An optimization process is then conducted, iteratively updating the T2 and $$$\rho$$$ maps to minimize the error between predicted images and the measured T2 weighted images. In this study, the Bound Optimization BY Quadratic Approximation method 2 was employed for the minimization. The cost function is $$cost=\sum_i\left \| \mathbf{x_{ik}}-\sum _j\rho_{jk}\hat{T}(j)\mathbf{PSF}(T_{2jk}, i))\right \|^2_2$$ where $$$\mathbf{\{x_{ik}\}}$$$ is a set of the $$$k$$$th lines from the image with $$$i$$$ different TEs. $$$\hat{T}(j)$$$ is the translation operator. $$$\rho_{jk}$$$ and $$$T_{2jk}$$$ are the proton density and transverse relaxation time at position $$$j$$$, respectively. $$$\mathbf{PSF}(T_{2jk}, i)$$$ is the PSF for a given T2, determined by the phase encoding scheme of the $$$i$$$th image.The method was validated by simulation, phantom and mouse brain experiments. 2D FSE T2 mapping experiments were conducted on an oil-water phantom with 14 TEs, ranging from 13.7 ms to 823 ms (FOV 60x60 mm2, voxel size 0.5x0.5 mm2, 17 mins scan time). 3D FSE T2 mapping experiments were performed on a mouse brain (10 TEs, FOV 22x22x18 mm3, voxel size 183x183x600 µm3, 2.8 hour scan time on a 1T system). The optimization time was 30 minutes for a single slice mouse brain on a 32 core CPU.
Results and Discussion
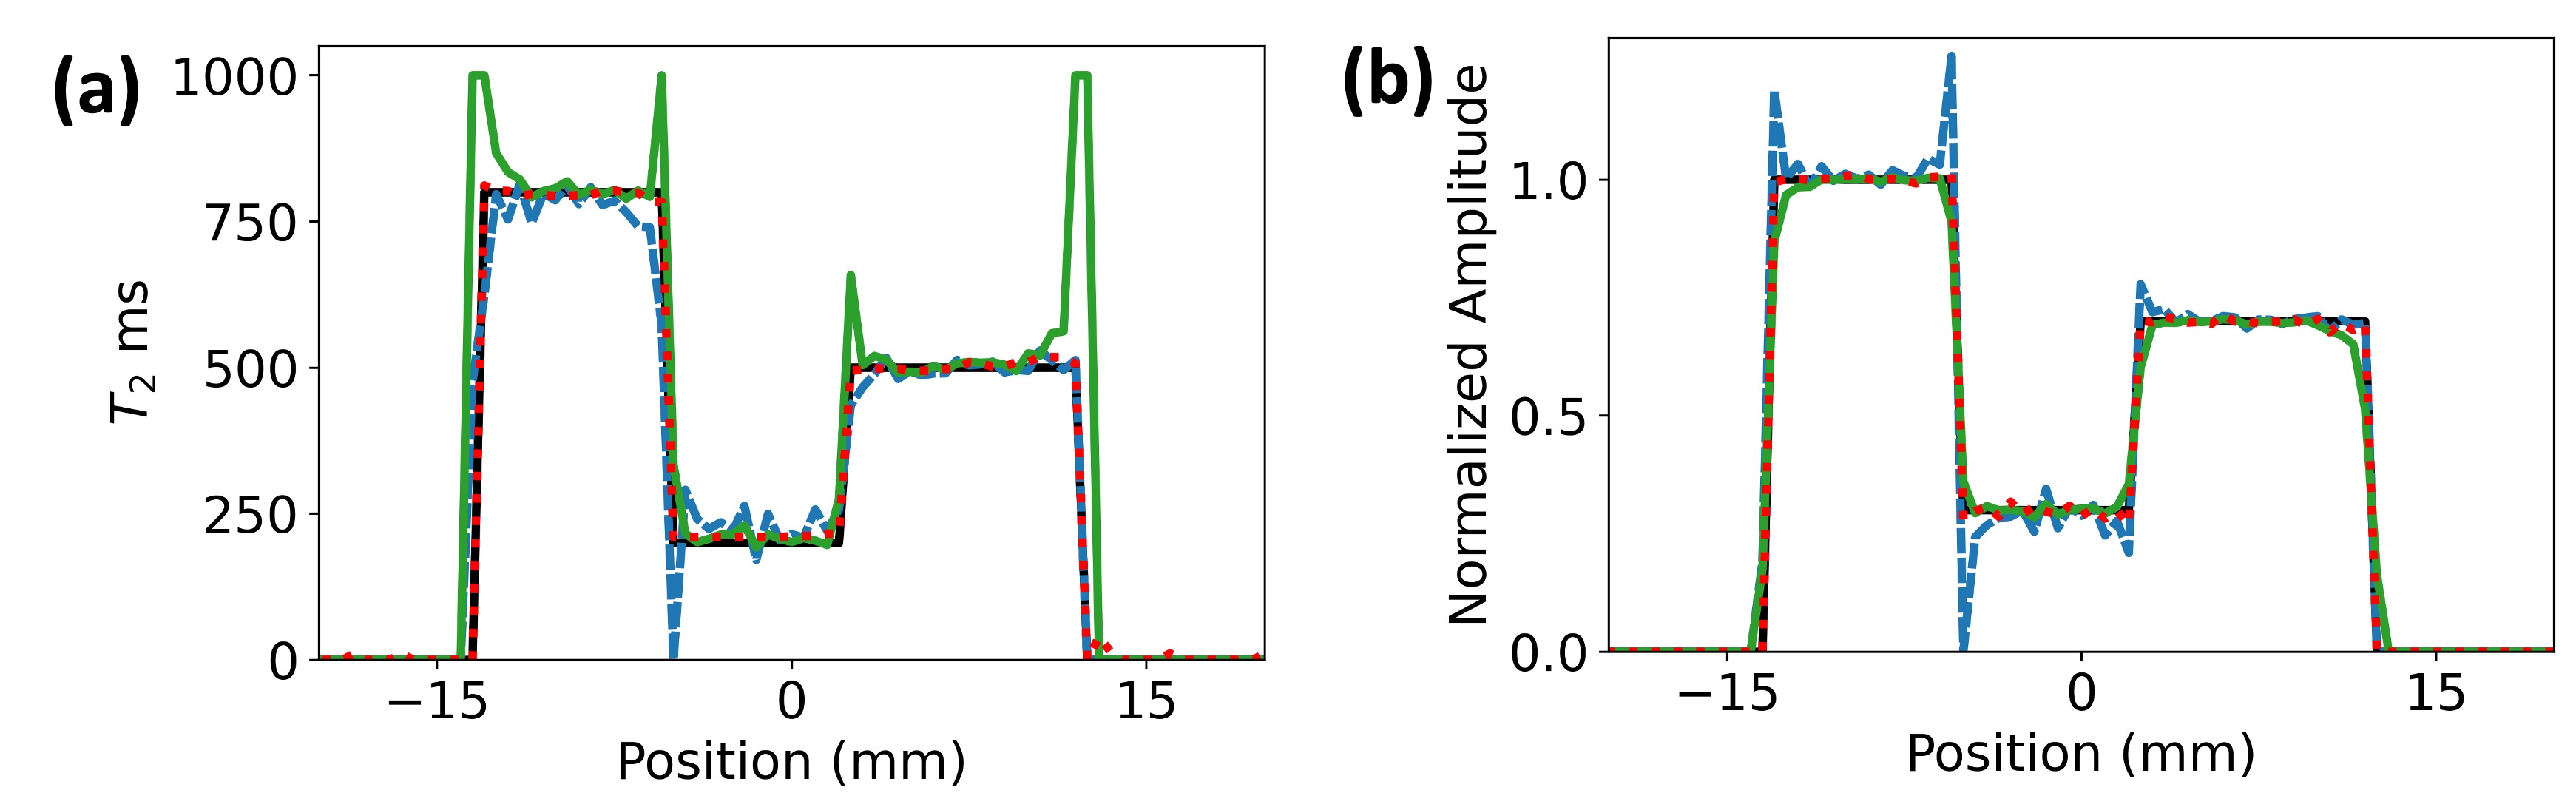
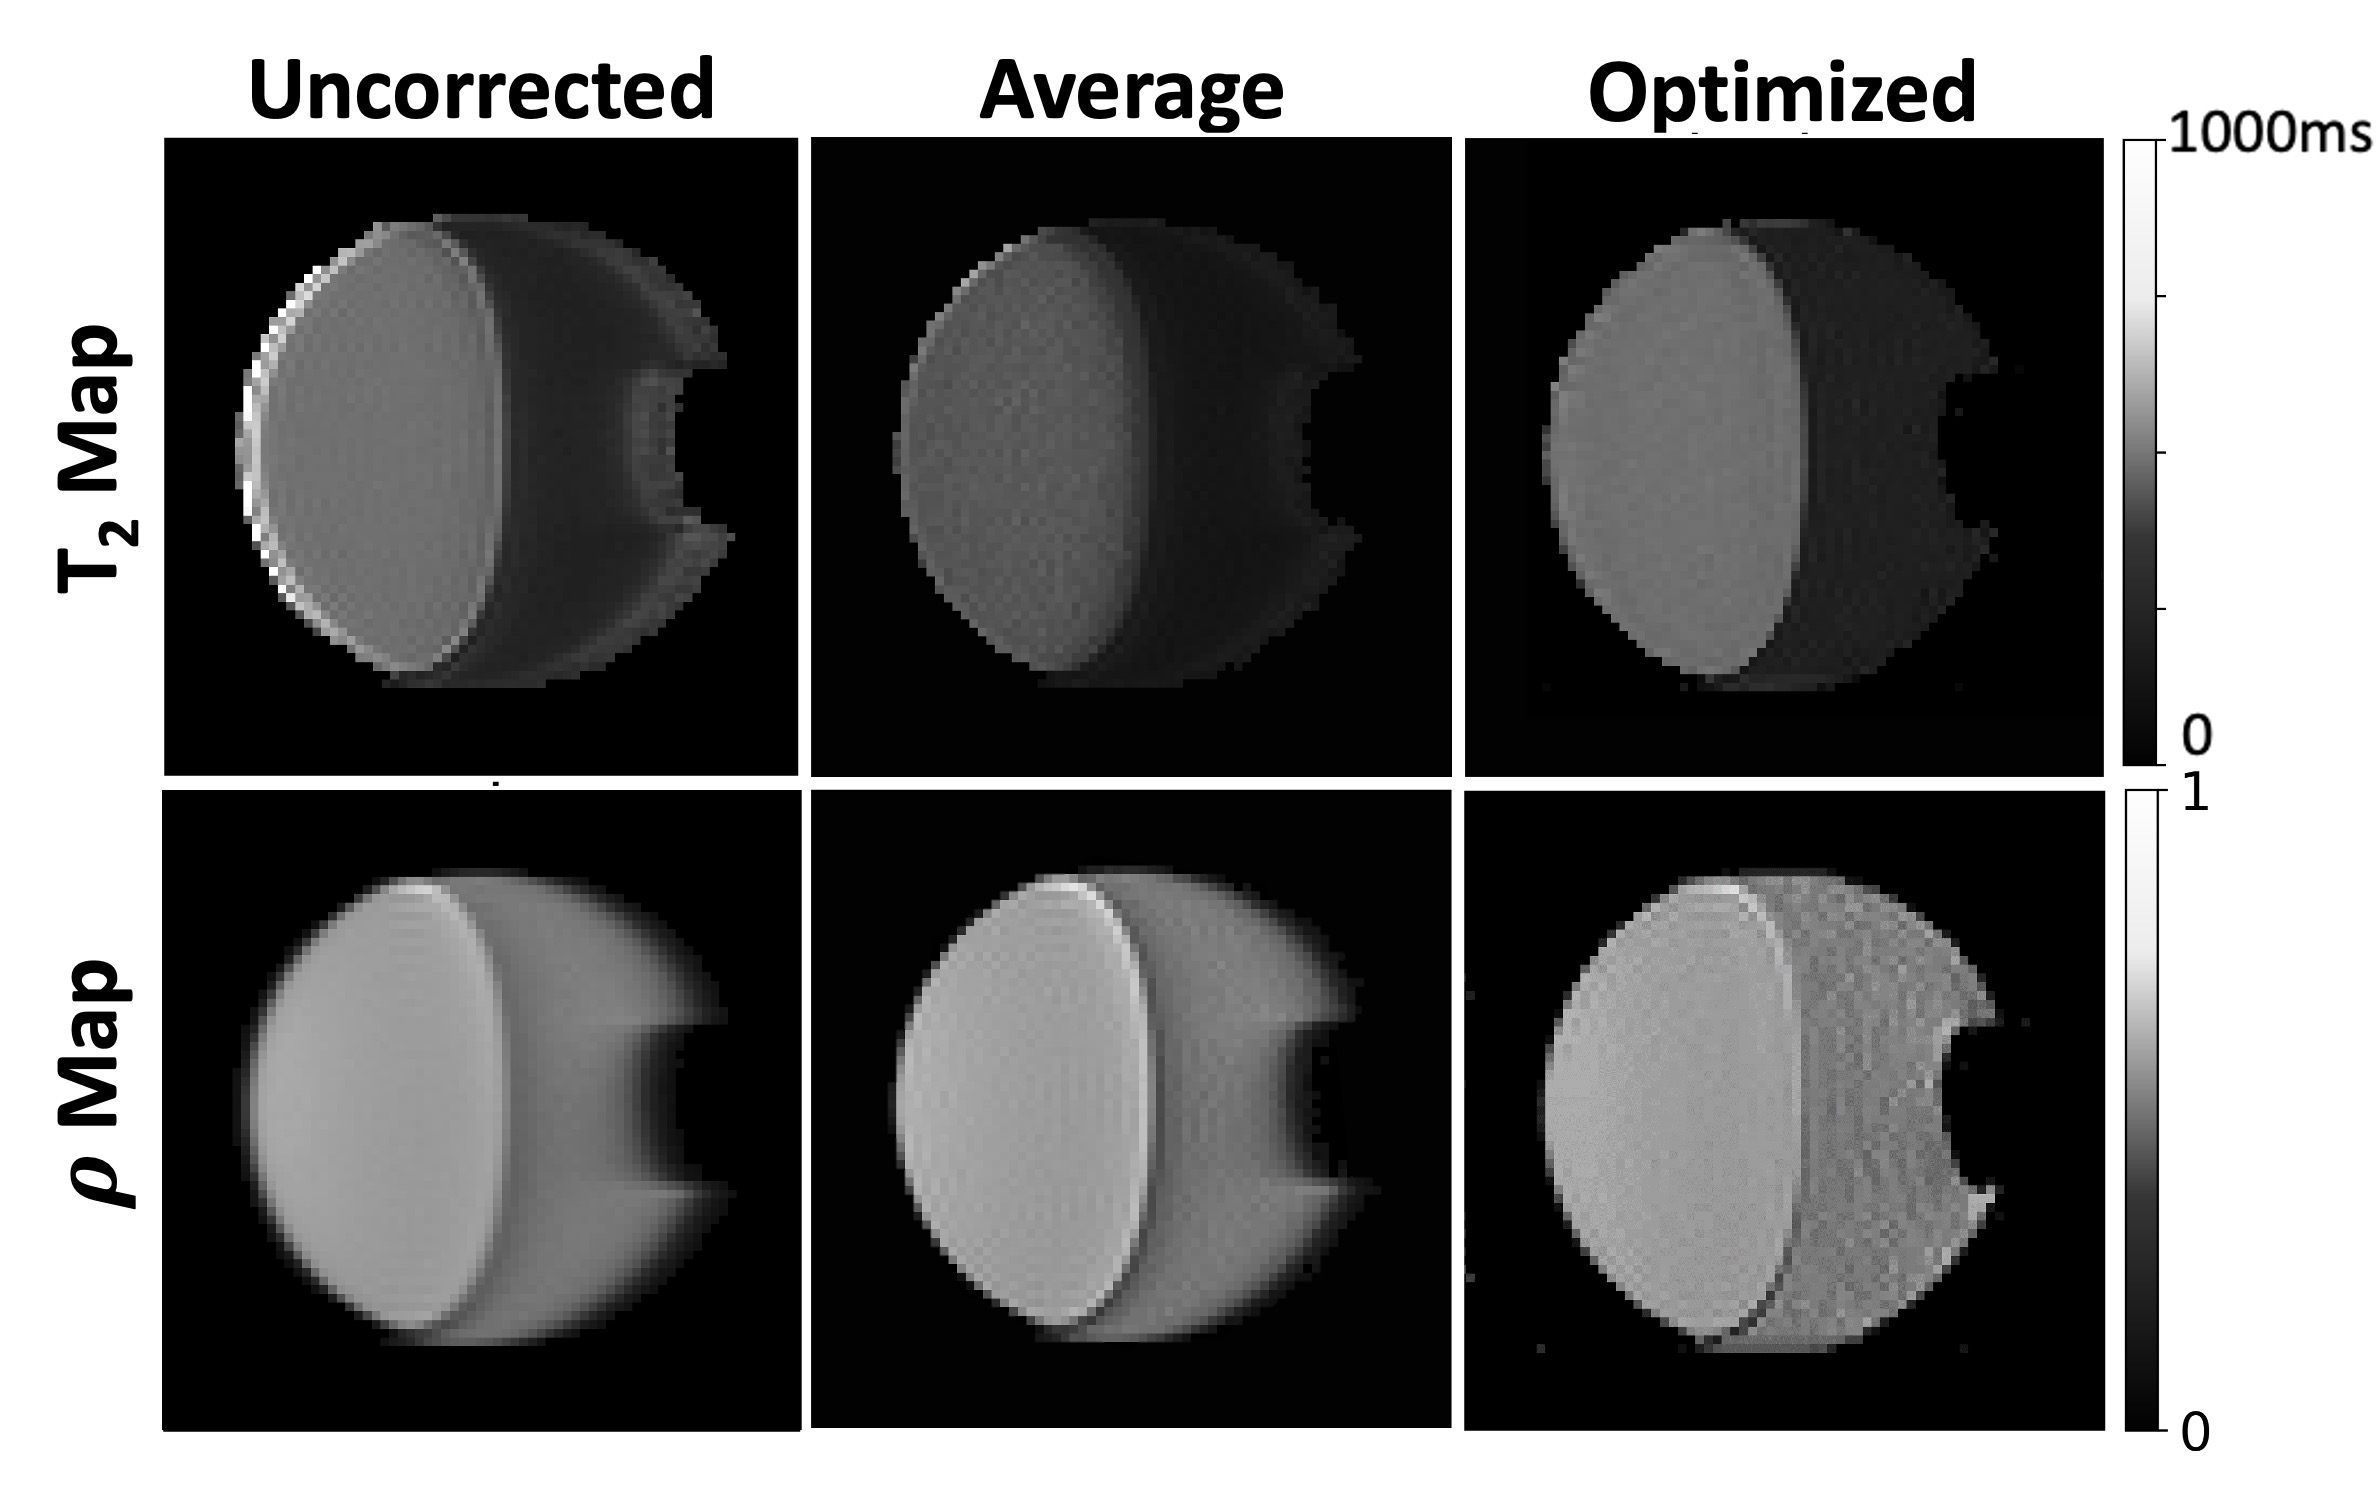
A single line from the T2 and $$$\rho$$$ maps in the simulation results is shown in Figure 2. The signal-to-noise ratio (SNR) was 100. In Figure 2a, the uncorrected T2 map, shown in green, exhibits significant edge enhancement, which is largely removed by the average correction in blue. However, the resulting profile appears noisier, and under-correction and over-correction occur in regions where T2 differs from the average value, leading to residual edge enhancement and blurring. The artifacts are enhanced in the $$$\rho$$$ map after average correction, as shown in Figure 2b. The proposed method yielded results shown in red, closely matching the ideal profile in black, without noise amplification and resolution degradation.Figure 3 displays the T2 (first row) and $$$\rho$$$ (second row) maps from the phantom experiment using the uncorrected (1st column), average corrected (2nd column) and the proposed (3rd column) methods. The results agreed very well with the simulation. The proposed method effectively eliminated the edge enhancement observed in the uncorrected T2 map and the average correction $$$\rho$$$ map. It also removed the apparent blurring in the uncorrected $$$\rho$$$ map and average correction T2 map. The average correction was not particularly effective, especially at the oil-water interface. The proposed method provides the most accurate quantitative maps.
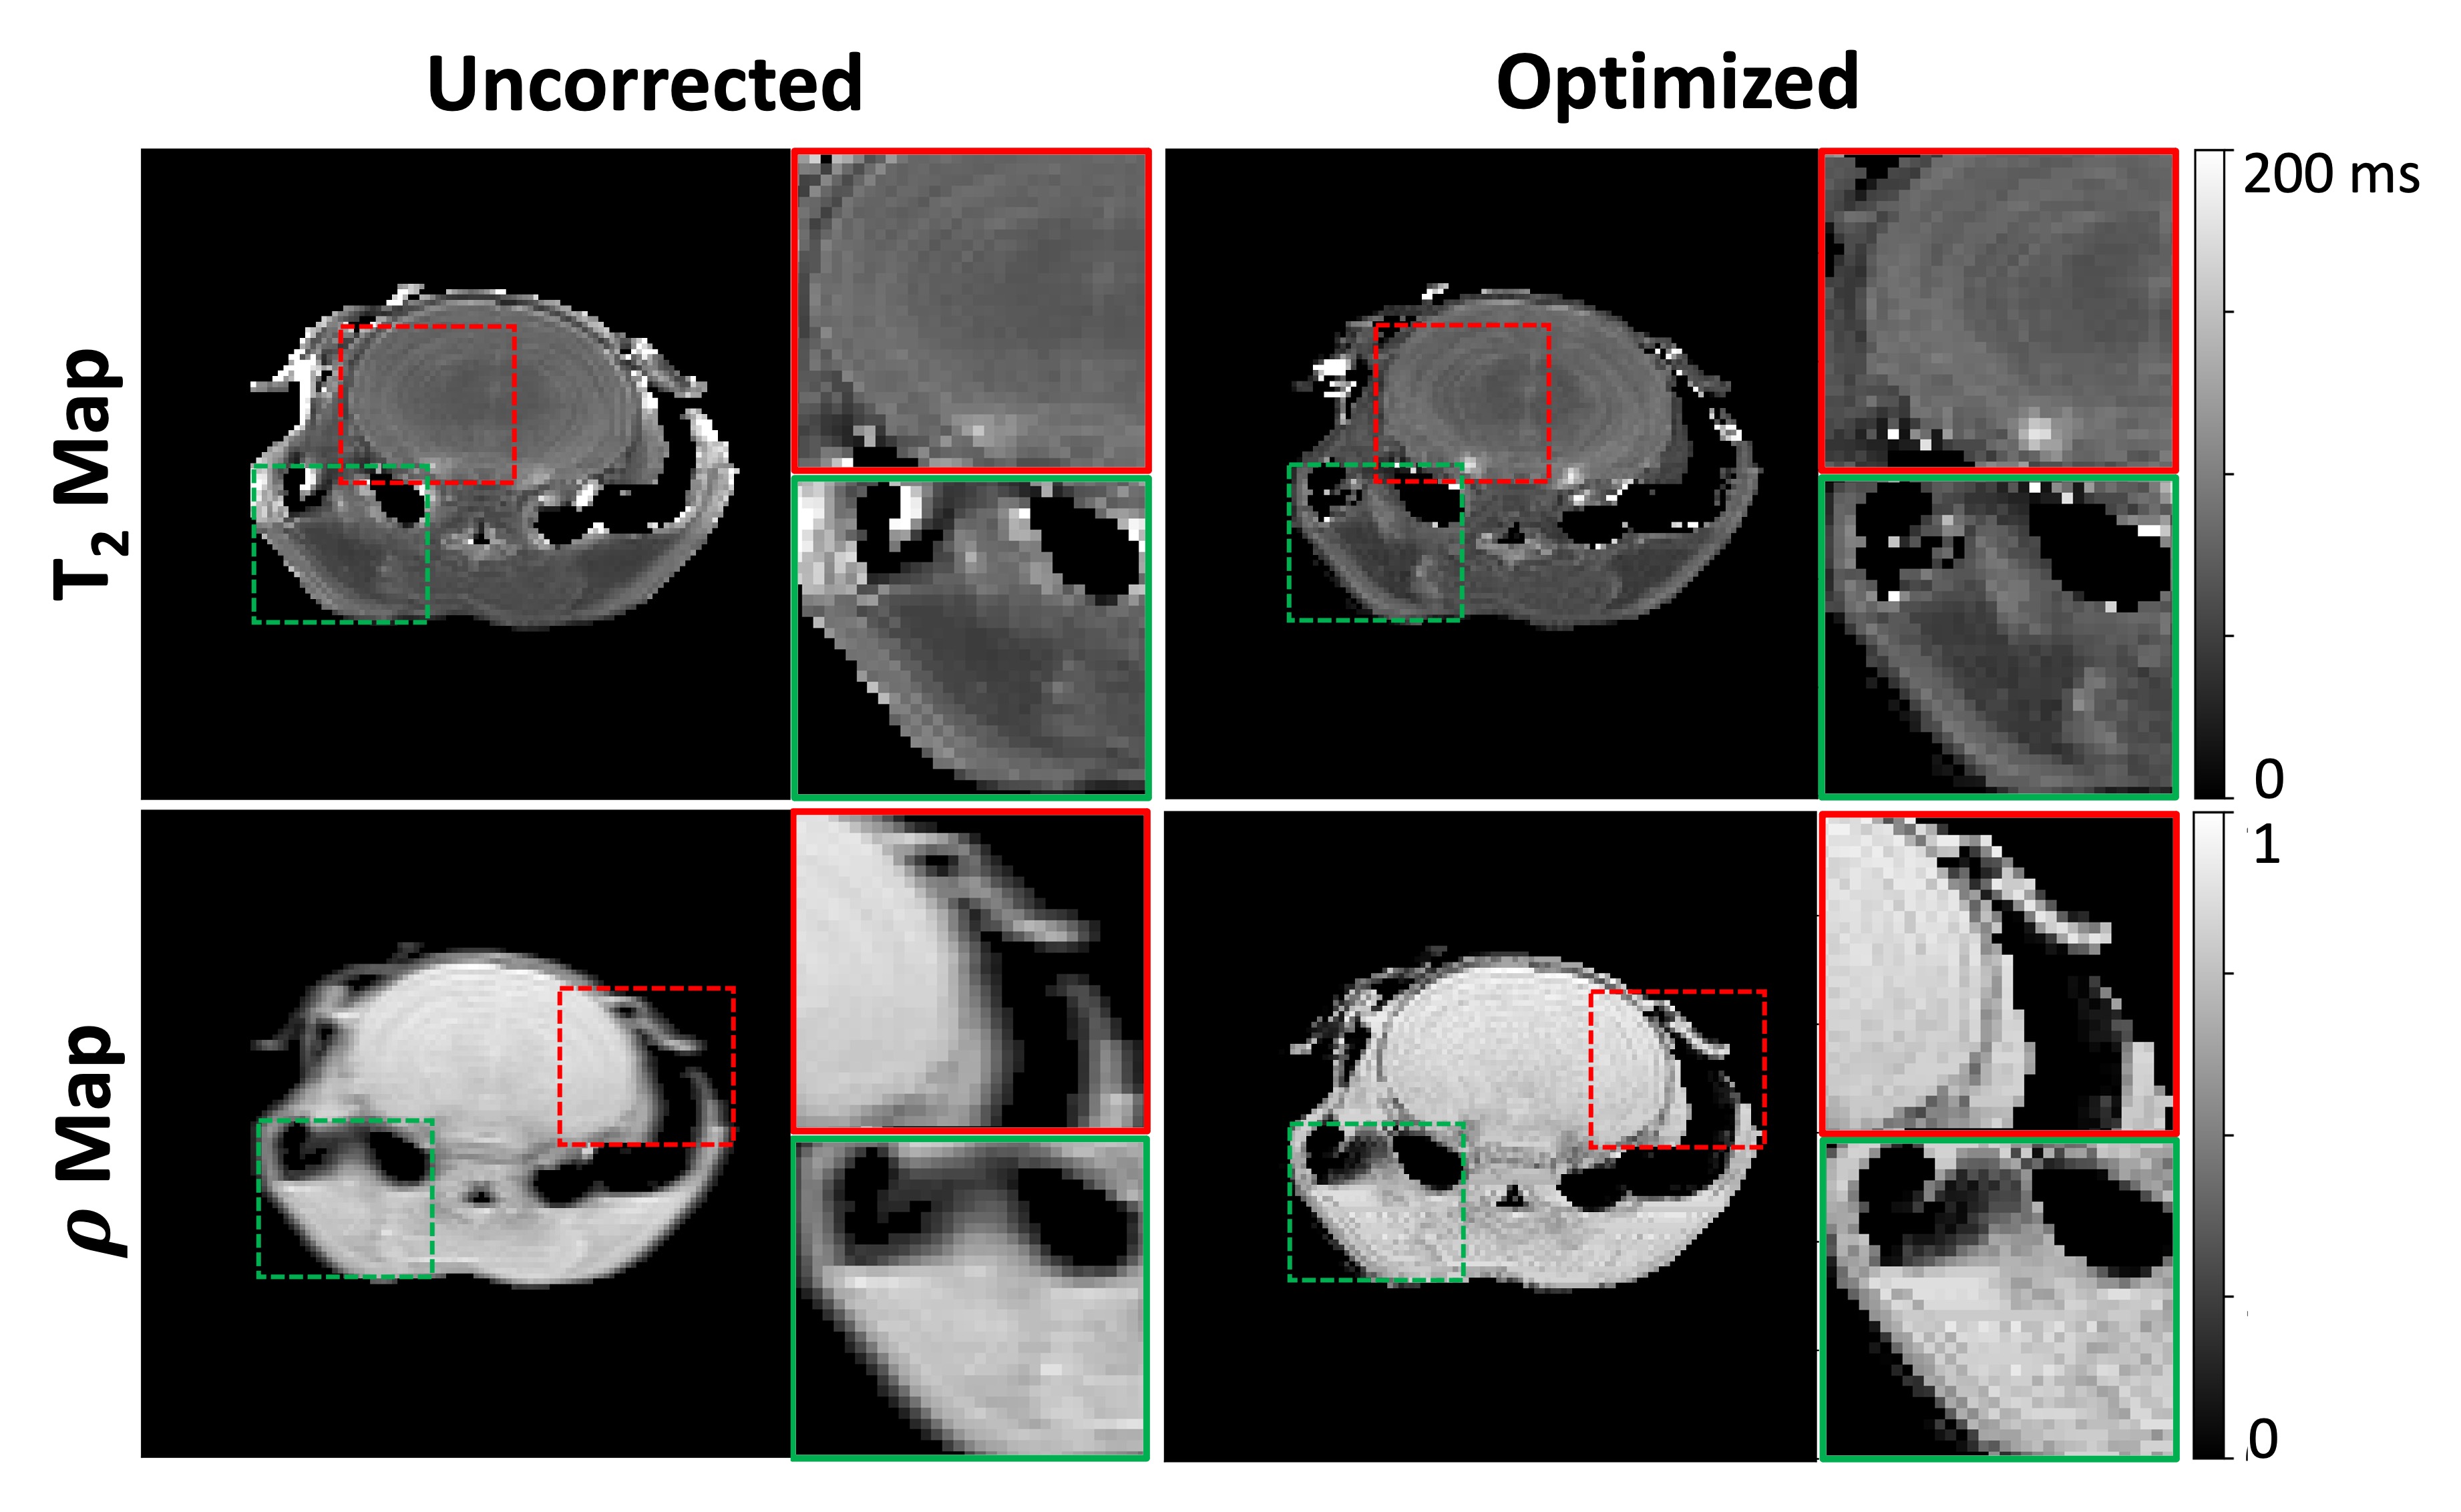
A slice of the 3D mouse brain FSE T2 mapping results is shown in Figure 4. The optimization method (2nd column) significantly improved the contrast and resolution of the T2 map (1st row) and $$$\rho$$$ map (2nd row). Notably, the hippocampus region is more discernible, and the CSF is more distinct in the optimized T2 map, as highlighted in the top zoomed view. Edge enhancement of T2 at the air-tissue interface was largely removed, as shown in the green window. The $$$\rho$$$ map shows low signal intensity around the ear, due to partial volume effect. This led to large errors in the uncorrected T2 map, while the optimization method was more robust. Blurring in the uncorrected $$$\rho$$$ map was substantially removed, and high-resolution features became visible.
Conclusion
An optimization method for PSF correction in FSE T2 mapping has been demonstrated. This method produces more accurate T2 and $$$\rho$$$ maps, largely eliminating blurring and edge enhancements, thus enabling quantitative studies without the need to modify the existing FSE pulse sequence.Acknowledgements
T. P. thanks NSERC Canada for a CGSD scholarship. D. X. thanks NSERC Canada for a Discovery Grant.References
1. Zhou X, Liang ZP, et al. Reduction of ringing and blurring artifacts in fast spin-echo imaging. J Magn Reson Imaging. 1993;3(5):803-7.
2. Powell M. The BOBYQA algorithm for bound constrained optimization without derivatives. Report DAMTP 2009/NA06, Centre for Mathematical Sciences, University of Cambridge, UK (August, 2009).
Figures