3708
T1 and T2 of the Human Brain at 64 mT: Measurement of 20 Participants1Magnetic Imaging Group, NIST, Boulder, CO, United States, 2Hyperfine, Guilford, CT, United States
Synopsis
Keywords: Quantitative Imaging, Brain
Motivation: To enable quantitative techniques at low-field, it is necessary to establish expected T1 and T2 values within the brain for healthy adults.
Goal(s): To measure and compare T1 and T2 of the healthy human brain at 64mT.
Approach: 20 healthy volunteers were imaged at 64mT. The resulting images were segmented using SynthSeg, and average values for T1 and T2 were computed over gray matter, white matter, and cerebrospinal fluid regions.
Results: Mean T1 and T2 were determined. Partial volume effects may limit the accuracy of the image segmentation and lead to large variations in gray matter and cerebrospinal fluid measurements.
Impact: To establish normative values for quantitative MRI at low field, 20 healthy individuals were scanned at 64 mT. T1 and T2 are reported for gray matter, white matter, and cerebrospinal fluid.
Introduction
Over the last few years, there has been a resurgence of work in low-field MRI (≤ 0.55T), with a mixture of self-built and commercially-available systems. These systems are capable of performing routine imaging with less cost and complexity than a conventional system, and there is interest in extending quantitative techniques to lower field strengths.Some quantitative MRI parameters are theoretically field-strength-invariant (e.g., T2), while others are expected to vary significantly with field strength (e.g., T1). Thus, quantitative thresholds established at other field strengths cannot be applied at all fields. To enable clinical use of low-field quantitative MRI, we aim to establish values for T1 and T2 in the gray matter (GM), white matter (WM), and cerebrospinal fluid (CSF) of healthy individuals at 64mT. This data was acquired over four months, and measurement stability was assessed during this time period to ensure data quality.
Methods
Quantitative brain imaging was performed on 20 healthy participants (7 female, ages 23-69) using a 64mT Hyperfine (Guilford, CT) Swoop 1.7 MRI system with software rc8.6 in accordance with Institutional Review Board guidelines.T1 was measured using six T1-weighted inversion-recovery images: TE= 7.0ms, TR=1.5s with TI=100, 200, 300, 700ms; and TR = 3.0s with TI=500, 1400ms (total scan time 56 minutes). T2 was measured with a vendor-provided multi-echo T2-mapping sequence1 (scan time 17 minutes). The resolution of the T1 and T2 maps were 1.6x1.6x5mm and 1.5x1.5x5mm.
T1 was acquired in a different session from T2 due to the duration of the T1 acquisitions. Images from each session were segmented separately rather than registering images from the two sessions.
Segmentation was performed with SynthSeg (v2.0, robust mode)2,3 using the TI=500ms image from the T1 dataset and the T2 map (Figure 1). The GM, WM, and CSF regions were eroded by 1, 2, and 2.5mm. The 64mT images were linearly interpolated to match the 1mm isotropic resolution of the segmentation. For each participant, mean T1 and T2 were computed for all three regions in a slab of slices extending ±25mm from the apex of the lateral ventricles.
To monitor the stability of the imaging system, data were acquired approximately once per week using a phantom with seven different samples representing brain tissue. Data were acquired using the vendor-provided T2-mapping sequence1, and a reference protocol with 15 TIs was used for T1.
Results and Discussion
Mean T1 (and standard deviation) across all participants are 373±30ms, 283±7ms, and 1194±524ms for GM, WM, and CSF (Figure 2). Mean T2 are 177±48ms, 107±14ms, and 1211±430ms (Figure 3). Relaxation in GM and WM is similar to previously reported values1,4. There is a marked increase in the standard deviation of GM T1 and T2 with age, potentially caused by the decrease in cortical volume with age5 (Figure 4). Older participants have a smaller GM volume to segment, leading to more pronounced partial-volume effects.Partial-volume effects arising from the 5 mm slice thickness used in this study made segmentation challenging and decreased the reliability of the measurements. Segmented volumes were eroded to remove edge voxels that might contain more than one tissue type, but the thinness of the cerebral cortex and the relatively small size of the lateral ventricles in some participants limited the extent of erosion. Thus, GM and CSF are most strongly impacted by partial volume effects. Subject motion is another potential source of error.
CSF was the most challenging to measure in this study. We optimized, modeled, and tested the T1 protocol, and it can accurately measure long T1 values (Figure 5, table). The measured T2 is slightly higher than T1 (although there is large overlap between the confidence intervals). This is most likely due to partial volume effects or subject motion.
Mean phantom T1 and T2 measurements were within ±6% of their mean value over the duration of the study, except for DI water which was within ±10% (Figure 5). Variability between participants, aside from WM T1, is larger than phantom sample variability (excluding DI water).
Conclusion
Using quantitative sequences and ML-based segmentation, brain T1 and T2 were estimated in 20 healthy individuals over a wide age range. Variation in WM was lower than in GM and CSF, and variation in GM increased with increasing age. The increased variability of GM and CSF can be attributed in part to challenges segmenting regions vulnerable to partial-volume effects.The 64mT system has sufficient stability to perform quantitative studies over several months. If partial-volume effects can be reduced, reliable segmentation and quantitative MRI could be feasible at low fields.
Acknowledgements
KVJ and SEO acknowledge research funding from the National Research Council Postdoctoral Fellowship. SEO would also like to acknowledge support from the NIST-PREP (Professional Research Experience Program), performed under the following financial assistance award 70NANB18H006 from U.S. Department of Commerce, National Institute of Standards and Technology.References
- Jordanova, K. V., Martin, M. N., Ogier, S. E., Poorman, M. E. & Keenan, K. E. In vivo quantitative MRI: T1 and T2 measurements of the human brain at 0.064 T. Magn. Reson. Mater. Phys. Biol. Med. (2023) doi:10.1007/s10334-023-01095-x.
- Billot, B. et al. SynthSeg: Segmentation of brain MRI scans of any contrast and resolution without retraining. Med. Image Anal. 86, 102789 (2023).
- Billot, B. et al. Robust machine learning segmentation for large-scale analysis of heterogeneous clinical brain MRI datasets. Proc. Natl. Acad. Sci. 120, e2216399120 (2023).
- O’Reilly, T. & Webb, A. G. In vivo T 1 and T 2 relaxation time maps of brain tissue, skeletal muscle, and lipid measured in healthy volunteers at 50 mT. Magn. Reson. Med. 87, 884–895 (2022).
- Lemaitre, H. et al. Normal age-related brain morphometric changes: nonuniformity across cortical thickness, surface area and gray matter volume? Neurobiol. Aging 33, 617.e1-617.e9 (2012).
Figures
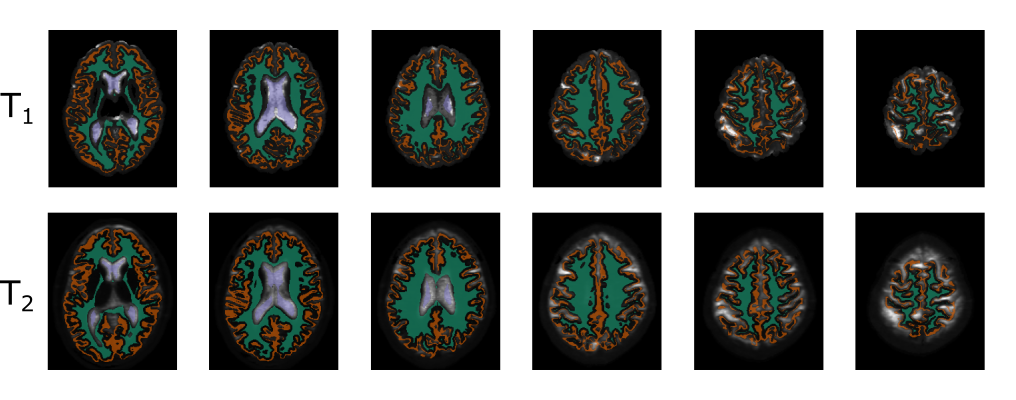
Example T1 and T2 maps with eroded segmentation regions overlaid on the corresponding map. Gray matter is orange, white matter is green, and CSF is blue. Slices shown cover the 50 mm thick slab used for analysis.
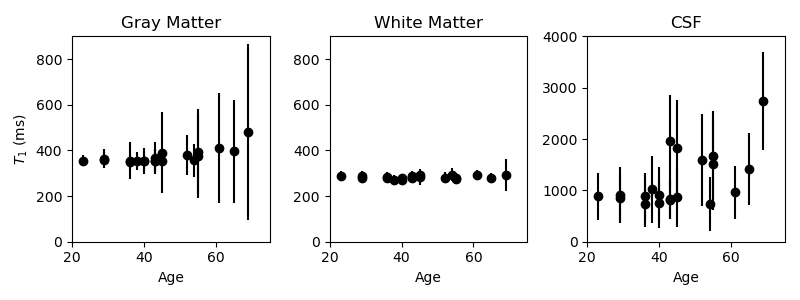
Mean T1 for each participant versus participant age. The large variation in gray matter and CSF can be attributed to partial volume effects. The increased variation of gray matter with age is potentially caused by age-related decreases in cortical thickness.
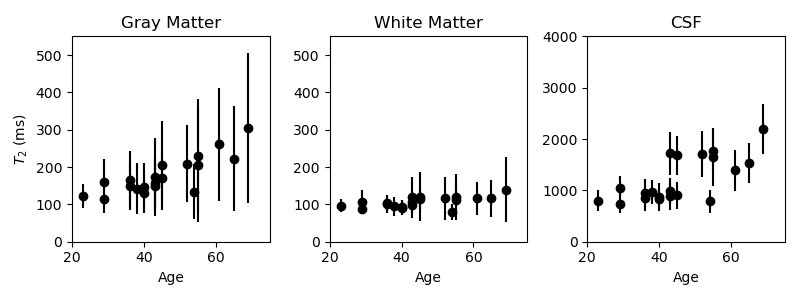
Mean T2 for each participant versus participant age. Variation in gray matter T2 (mean standard deviation of 93ms) is comparable to the gray matter T1 variation (105ms). Variation in white matter T2 (37ms) is slightly higher than in white matter T1 (24ms) There is less variability in CSF T2 (319ms) compared to CSF T1 (628ms), possibly due to the higher resolution of the T2 map.
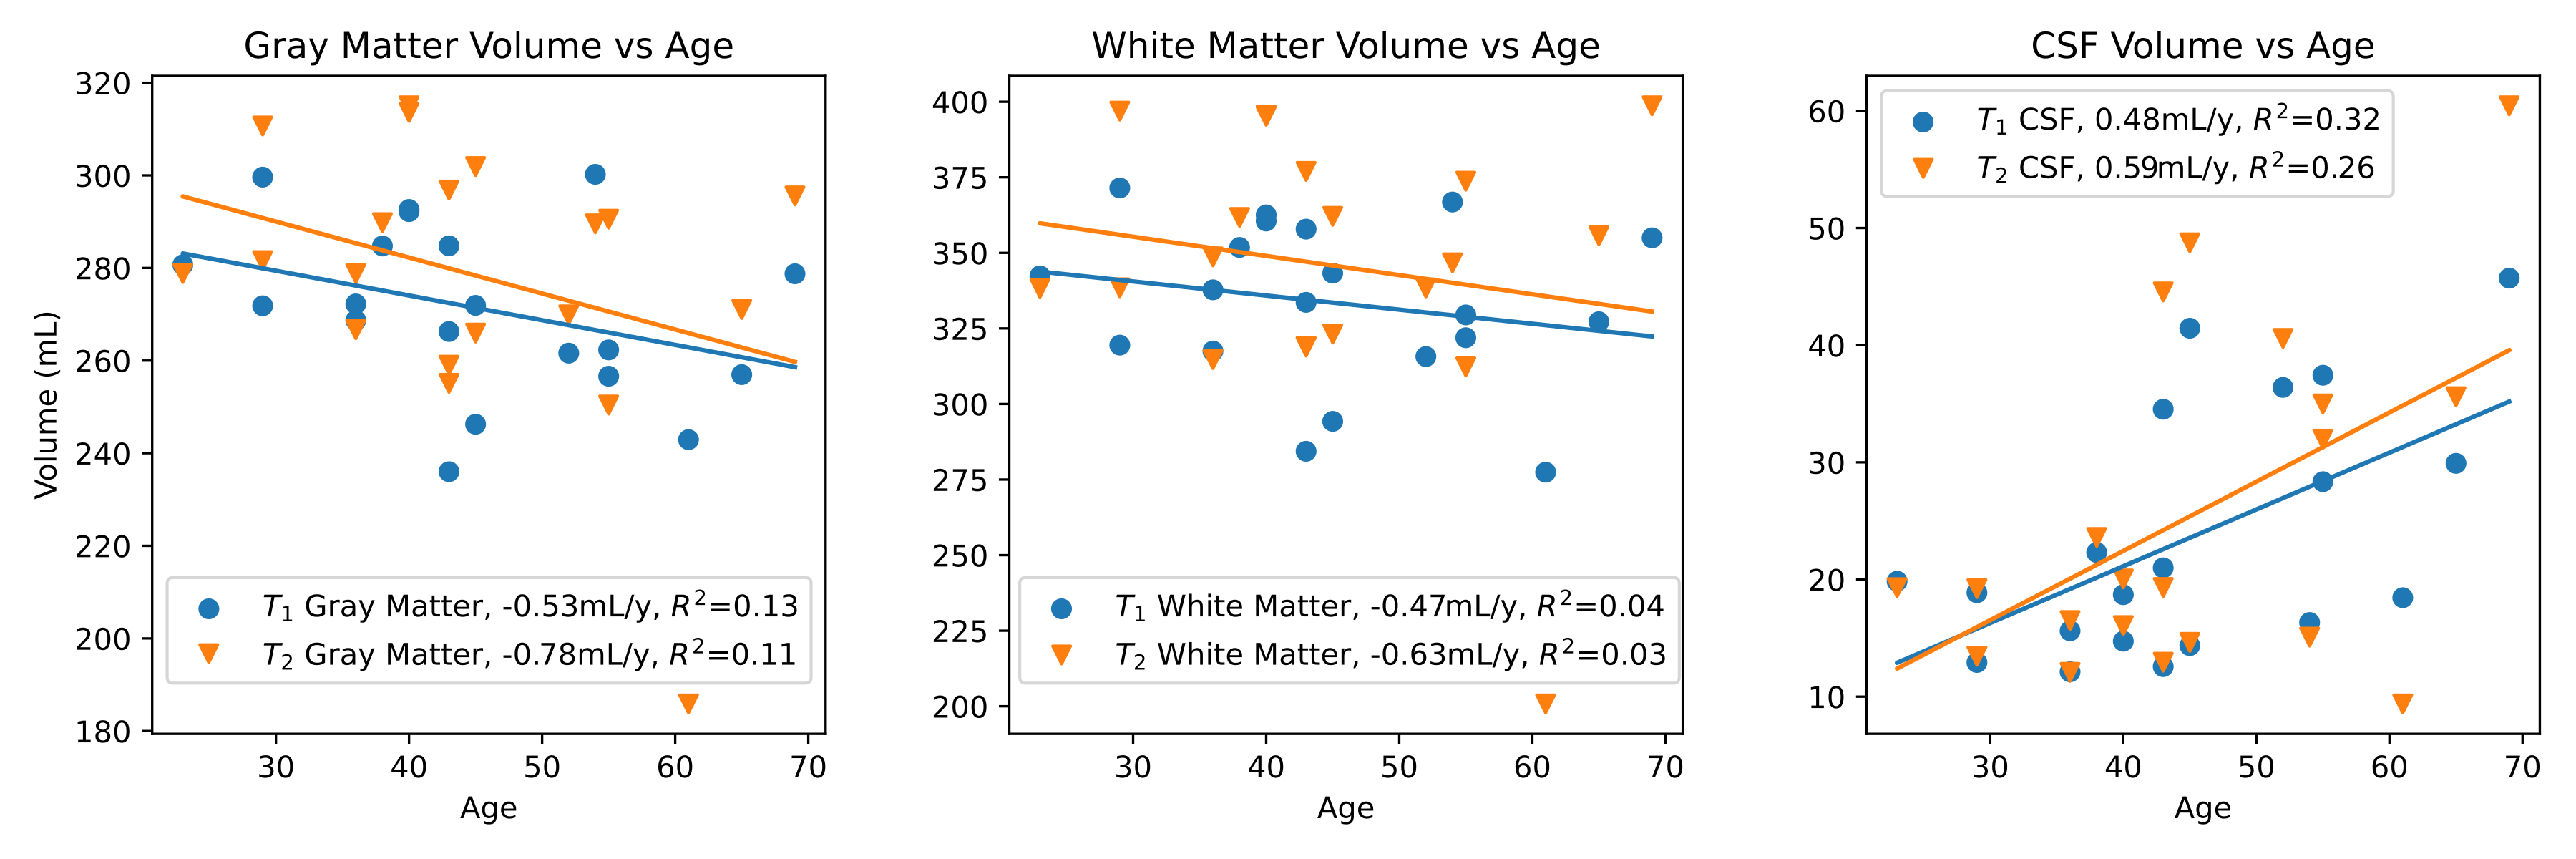
Change in segmentation volume as age increases. Volume is the un-eroded volume within the 50 mm slab. Linear regression for each image type (T1-weighted and T2 map) and tissue type were computed, and the slope and R2 are reported for each. Because gray matter is a thin layer and highly vulnerable to partial volume effects, it is the most impacted by age-related changes in volume.
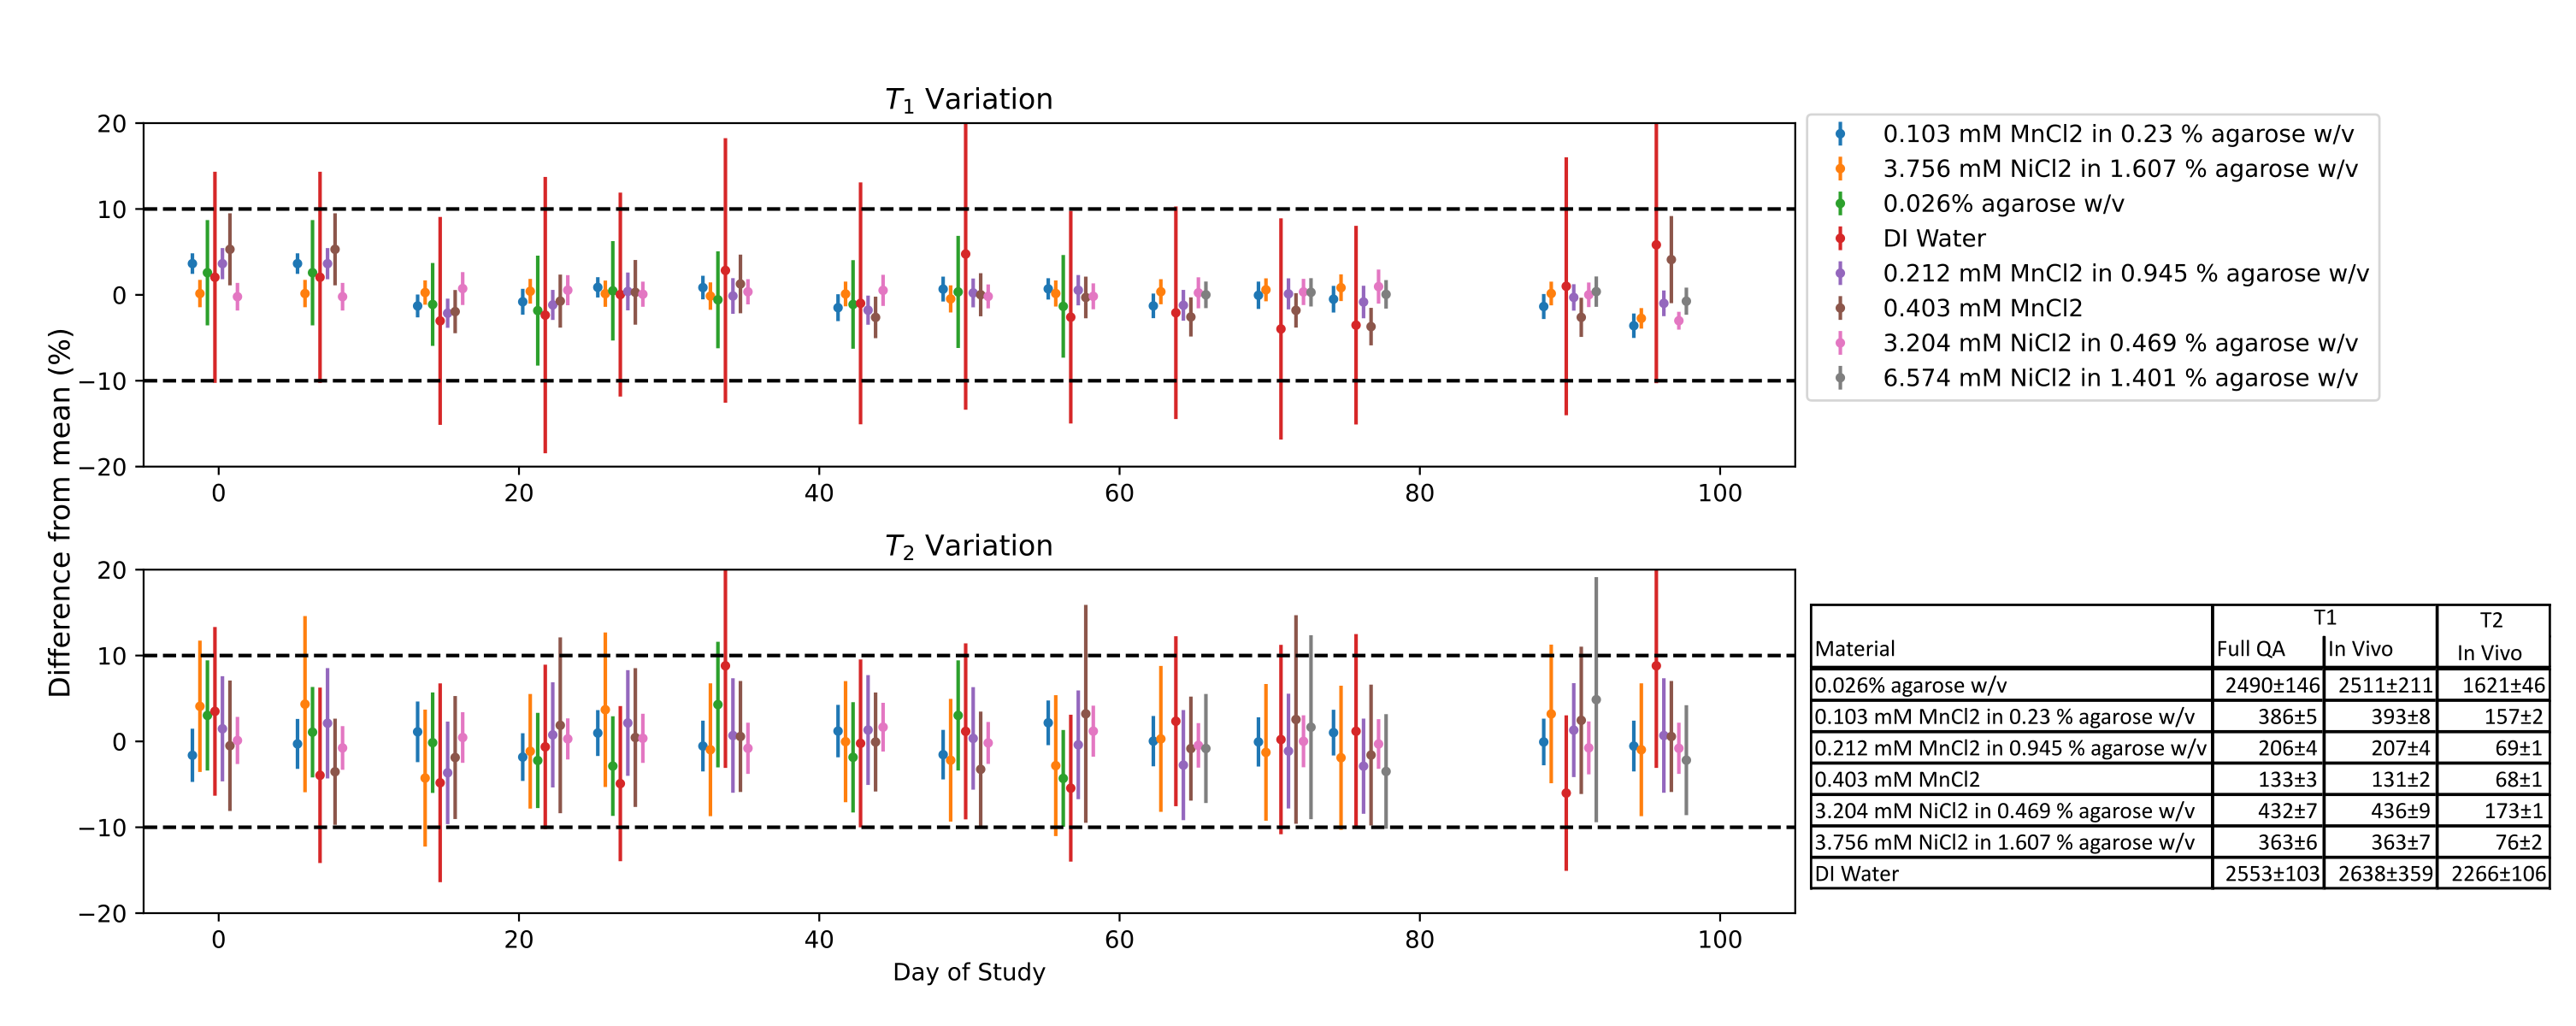
Plots show phantom stability over the duration of the study. Excluding DI water, mean T1 and T2 are within ±6% variation for the duration of the study. This is smaller than the variation of all measurements, except T1 in white matter. The table reports T1 measured by both the 15 TI and in vivo (mixed TR) protocols and T2 for all phantom materials. Both T1 protocols are able to measure even long T1s accurately.