3706
A Novel Approach for Simultaneous T1, T2, T2*, and Proton Density Mapping via Longitudinal Magnetization Control MOLED Acquisition1Xiamen University, Xiamen, China, 2Magnetic Resonance Center, Zhongshan Hospital Afflicated to Xiamen University, Xiamen, China, 3Clinical & Technical Solutions, Philips Healthcare, Beijing, China
Synopsis
Keywords: Quantitative Imaging, Quantitative Imaging, multiple overlapping-echo detachment, pulse sequence design
Motivation: Traditional multi-parameter mapping methods use different sequences to acquire images with varying TE or TI, posing challenges like registration, time consumption, and physiological asynchrony among parameters.
Goal(s): To rapid acquire self-registered multi-parametric maps.
Approach: A longitudinal magnetization control multiple overlapping-echo detachment (LMC-MOLED) imaging method was proposed. In the first phase of LMC-MOLED, T2-T2*-MOLED was acquired using the blip-up blip-down SE-EPI/GRE-EPI readout. Subsequently, after five T2-MOLED acquisitions were applied with varying delay intervals, MOLED images with distinct T1 weighting were captured.
Results: LMC-MOLED can simultaneously acquire five slices of multi-parametric maps, including T1, T2, T2*, PD, ΔB0, and B1, within 5.5 s.
Impact: LMC-MOLED is a novel and rapid simultaneous multi-parameter magnetic resonance quantitative method that may aid in the clinical diagnosis of diseases such as multiple sclerosis and tumors.
Introduction
Simultaneously obtaining multiple quantitative parameters is advantageous for comparisons between subjects or sites, longitudinal monitoring, and quantitatively detecting changes in biological tissues.1,2 Traditional multi-parameter quantification methods require the use of different sequences to acquire multiple images with varying echo time (TE) or inversion time, leading to issues of registration and time consumption. Simultaneously measuring multiple parameters in a single scan is one approach to address thischallenge.Here, a method based on longitudinal magnetization control multiple overlapping-echo detachment3,4 (LMC-MOLED) imaging is proposed for fast and accurate acquisition of T1, T2, T2*, PD, ΔB0 and B1 maps.
Methods
Pulse sequence designThe overall composition of the LMC-MOLED sequence is depicted in Figure 1a, comprising six MOLEDs with distinct phases. In the initial phase of LMC-MOLED, T2-T2*-MOLED is acquired using the blip-up blip-down SE-EPI/GRE-EPI, followed by the application of five T2-MOLEDs at varying intervals to capture MOLED images with differing T1 weighting. The MOLED module, as depicted in Figure 1b, commences by administering four RF pulses to generate signals with diverse contrast weightings.
The method of extended phase graph (EPG)5 was employed to analyze the echo signals acquired by the LMC-MOLED pulse sequence in detail. For the first phase, the four primary echo signals please refer to reference 3. Further, the signal strength of each phase relative to the first phase is obtained under the influence of T1 relaxation:
\begin{equation}
S_n=\left(\sum_{j=1}^{n-1} e^{-\sum_{i=j}^{n-1} \frac{\Delta_i}{T_1}} \cdot\left(\left(\cos ^4 \alpha \cdot \cos \beta\right)^{n-j}-\left(\cos ^4 \alpha \cdot \cos \beta\right)^{n-j-1}\right)+1\right) \cdot S_1
\end{equation}
where α represents the excitation pulse flip angle, β represents the refocusing pulse flip angle, Δi is the interval between the ith and (i+1)th phases, S1 represents the signal strength of the first phase, Sn represents the intensity of the nth phase relative to the first phase (n ≥ 2), and T1 is the longitudinal relaxation time. The equation neglects the effects of diffusion, T1 relaxation recovery between the four excitation pulses, and the durations of the pulses and gradients.
Deep learning reconstruction
The reconstruction of quantitative parametric maps necessitates the utilization of a deep learning network. The key steps involved in deep learning reconstruction were as follows: Initially, training data were synthesized using the MRiLab simulator6 with pulse sequence and parameters identical to those employed on the MRI scanner. Second, a U-Net was employed as reconstruction network, taking amplitudes and phases of LMC-MOLED images as input. During training, the network learnt the mapping relationship between LMC-MOLED signals and quantitative maps. During testing, the network was applied to LMC-MOLED images acquired from MRI scanner to generate T1, T2, T2*, PD, B1, and ΔB0 maps.
Experiments
Water phantom and human brain were scanned on a 3T MRI scanner (Ingenia CX, Philips Healthcare) with a 32-channel head coil. The LMC-MOLED sequence parameters were as follows: pulse flip angle α = 30°, field of view= 220 × 220 mm², imaging matrix = 160 × 156, echo spacing = 0.912 ms, and slice thickness = 3 mm for healthy volunteers and 5 mm for water phantom and tumor patients. The reference T1 maps were acquired using multi-shot IR-SE-EPI, T2 and PD maps were acquired using SE, T2* and ∆B0 maps were acquired using multi-echo GRE, and B1 maps were acquired using a double angle SE-EPI. This study was approved by the Institutional Review Board of Zhongshan Hospital, Xiamen University.
Results
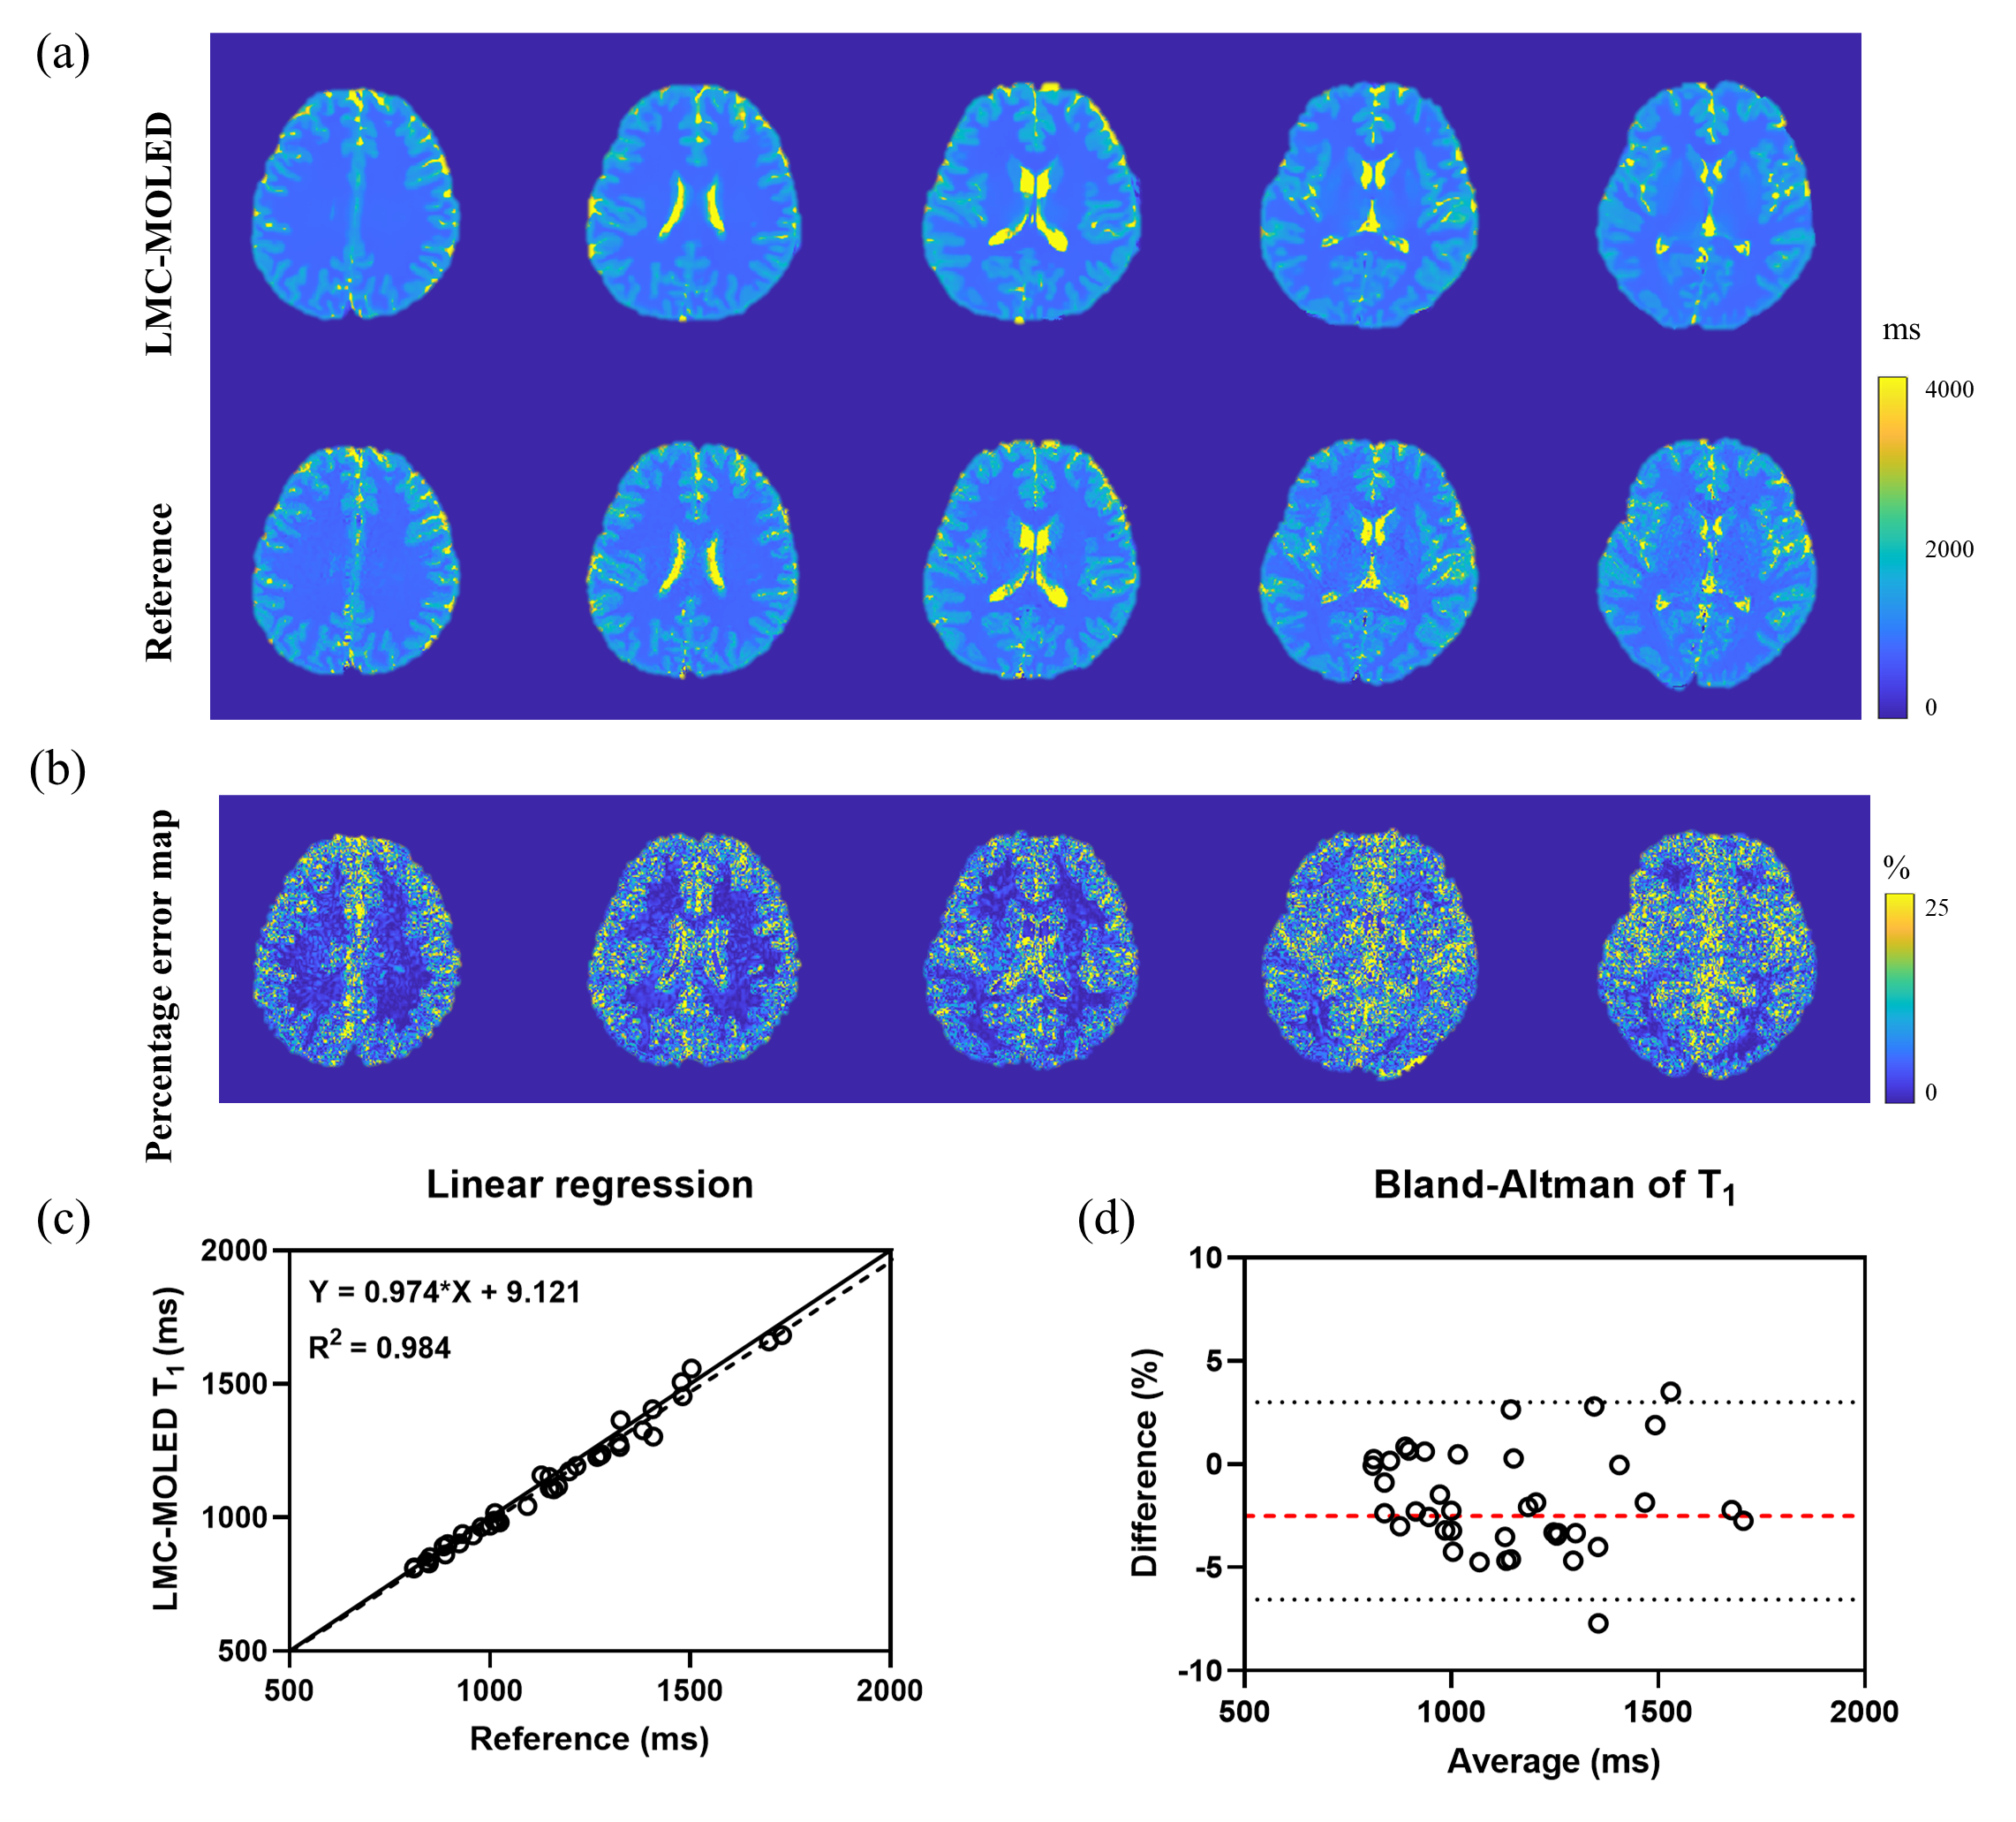
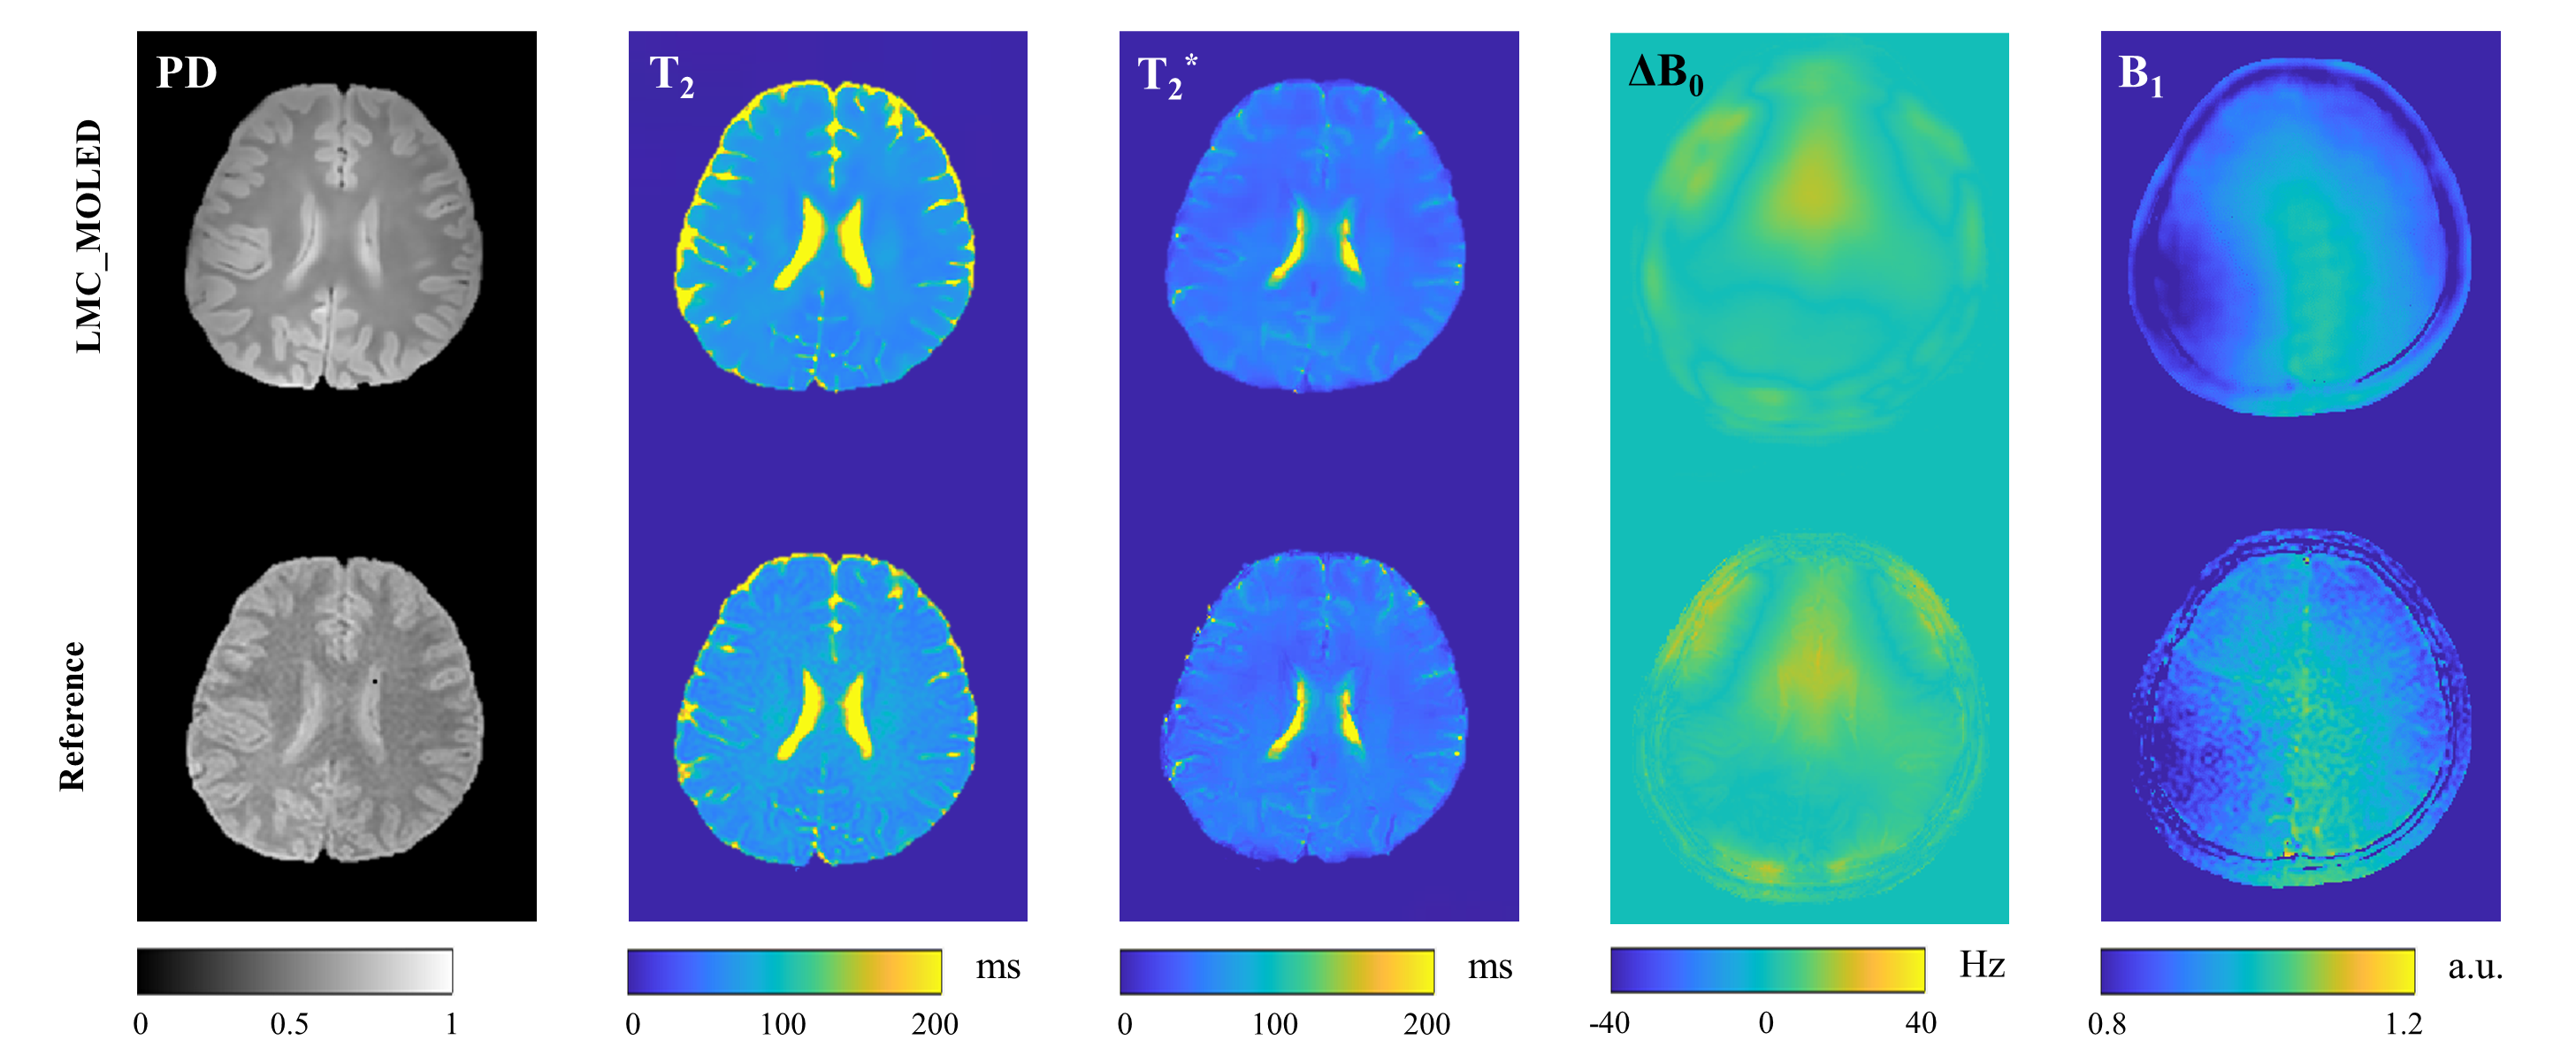
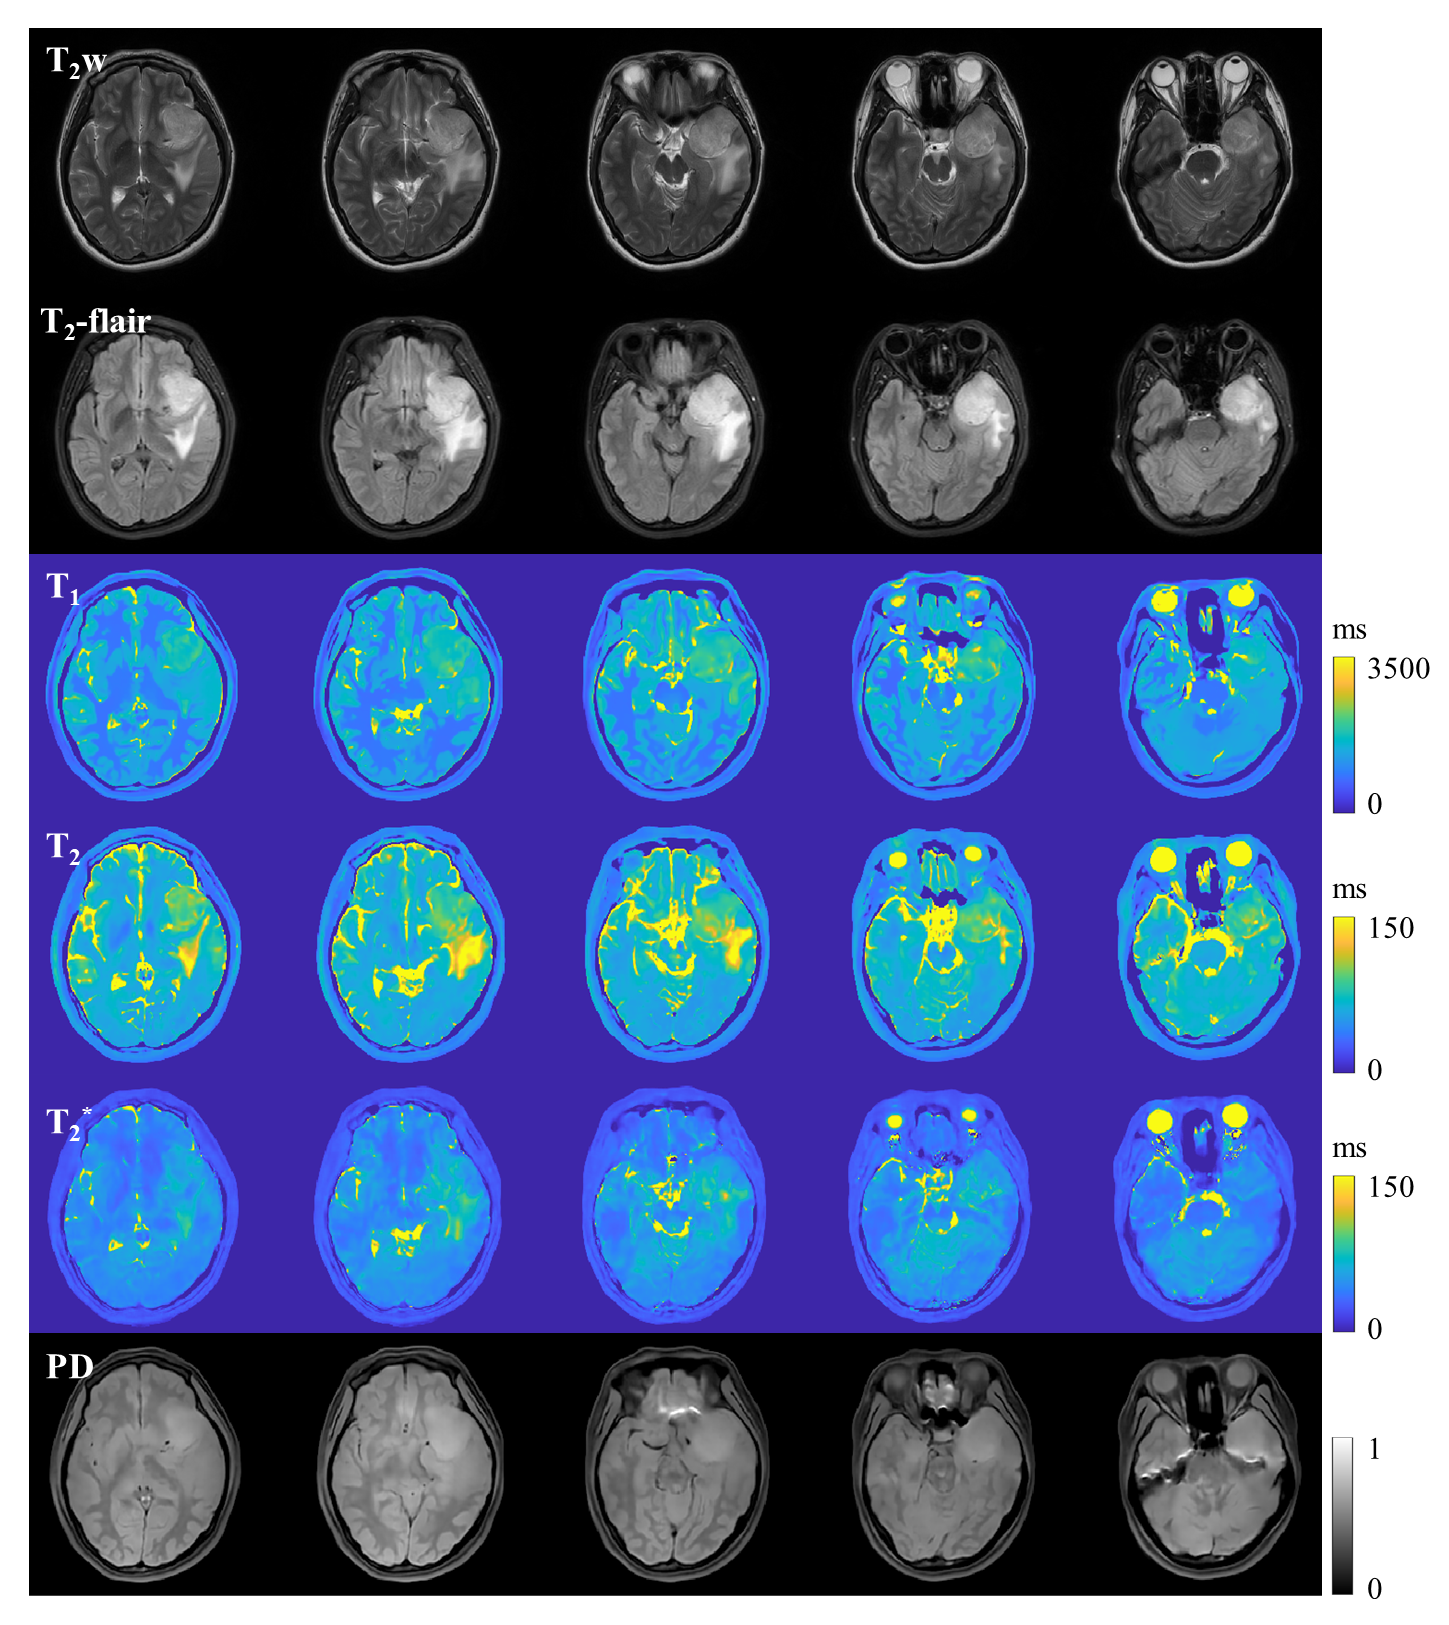
The results of the water phantom experiment are shown in Figure 2. For T1, T2, and T2* maps obtained by LMC-MOLED and reference methods, linear regression analysis was performed in eight ROIs selected from the water phantom test tubes. The results demonstrated high consistency compared to the reference methods.Figure 3 displays T1 results of a healthy volunteer. A direct comparison between the LMC-MOLED and reference maps, along with percentage error maps, indicates strong agreement. Bland-Altman analysis shows an average bias of -1.78% with a standard deviation (SD) of bias at 2.43%. Figure 4 illustrates the comparison between LMC-MOLED and reference methods for a healthy volunteer’s T2, T2*, PD, ΔB0, and B1. Figure 5 presents results for a tumor patient.
In summary, the LMC-MOLED method provides accurate quantification of various MR parameters and effectively corrects distortions introduced by EPI acquisition.
Discussion and conclusion
LMC-MOLED exhibits strong linear correlations with reference methods for T1, T2, and T2* measurements across a wide range (T1: 700-2000 ms, T2: 50-100 ms, and T2*: 30-80 ms). It can simultaneously acquire five layers of multi-parametric maps, including T1, T2, T2*, PD, ΔB0, and B1, within 5.5 seconds. Additionally, it demonstrates significant robustness to MRI system imperfections.Acknowledgements
This work was supported by the National Natural Science Foundation of China under grant numbers 82071913 and 12375291.References
1. Lescher S, Jurcoane A, Veit A, et al. Quantitative T1 and T2 mapping in recurrent glioblastomas under bevacizumab: earlier detection of tumor progression compared to conventional MRI. Neuroradiology. 2015; 57: 11-20.
2. Ma S, Wang N, Fan Z, et al. Three‐dimensional whole-brain simultaneous T1, T2, and T1ρ quantification using MR multitasking: method and initial clinical experience in tissue characterization of multiple sclerosis. Magn reson med. 2021; 85(4): 1938-1952.
3. Zhang J, Wu J, Chen SJ, et al. Robust single-shot T2 mapping via multiple overlapping-echo acquisition and deep neural network. IEEE Trans Med Imaging. 2019; 38: 1801-1811.
4. Ma LC, Wu J, Yang QQ, et al. Single-shot multi-parametric mapping based on multiple overlapping-echo detachment (MOLED) imaging. NeuroImage. 2022; 263: 119645.
5. Weigel M. Extended phase graphs: dephasing, RF pulses, and echoes-pure and simple. Journal of Magnetic Resonance Imaging. 2015; 41(2): 266-295.
6. Liu F, Velikina JV, Block WF, Kijowski R, Samsonov AA. Fast realistic MRI simulations based on generalized multi-pool exchange tissue model. IEEE Trans Med Imaging. 2017; 36(2): 527-537.
Figures
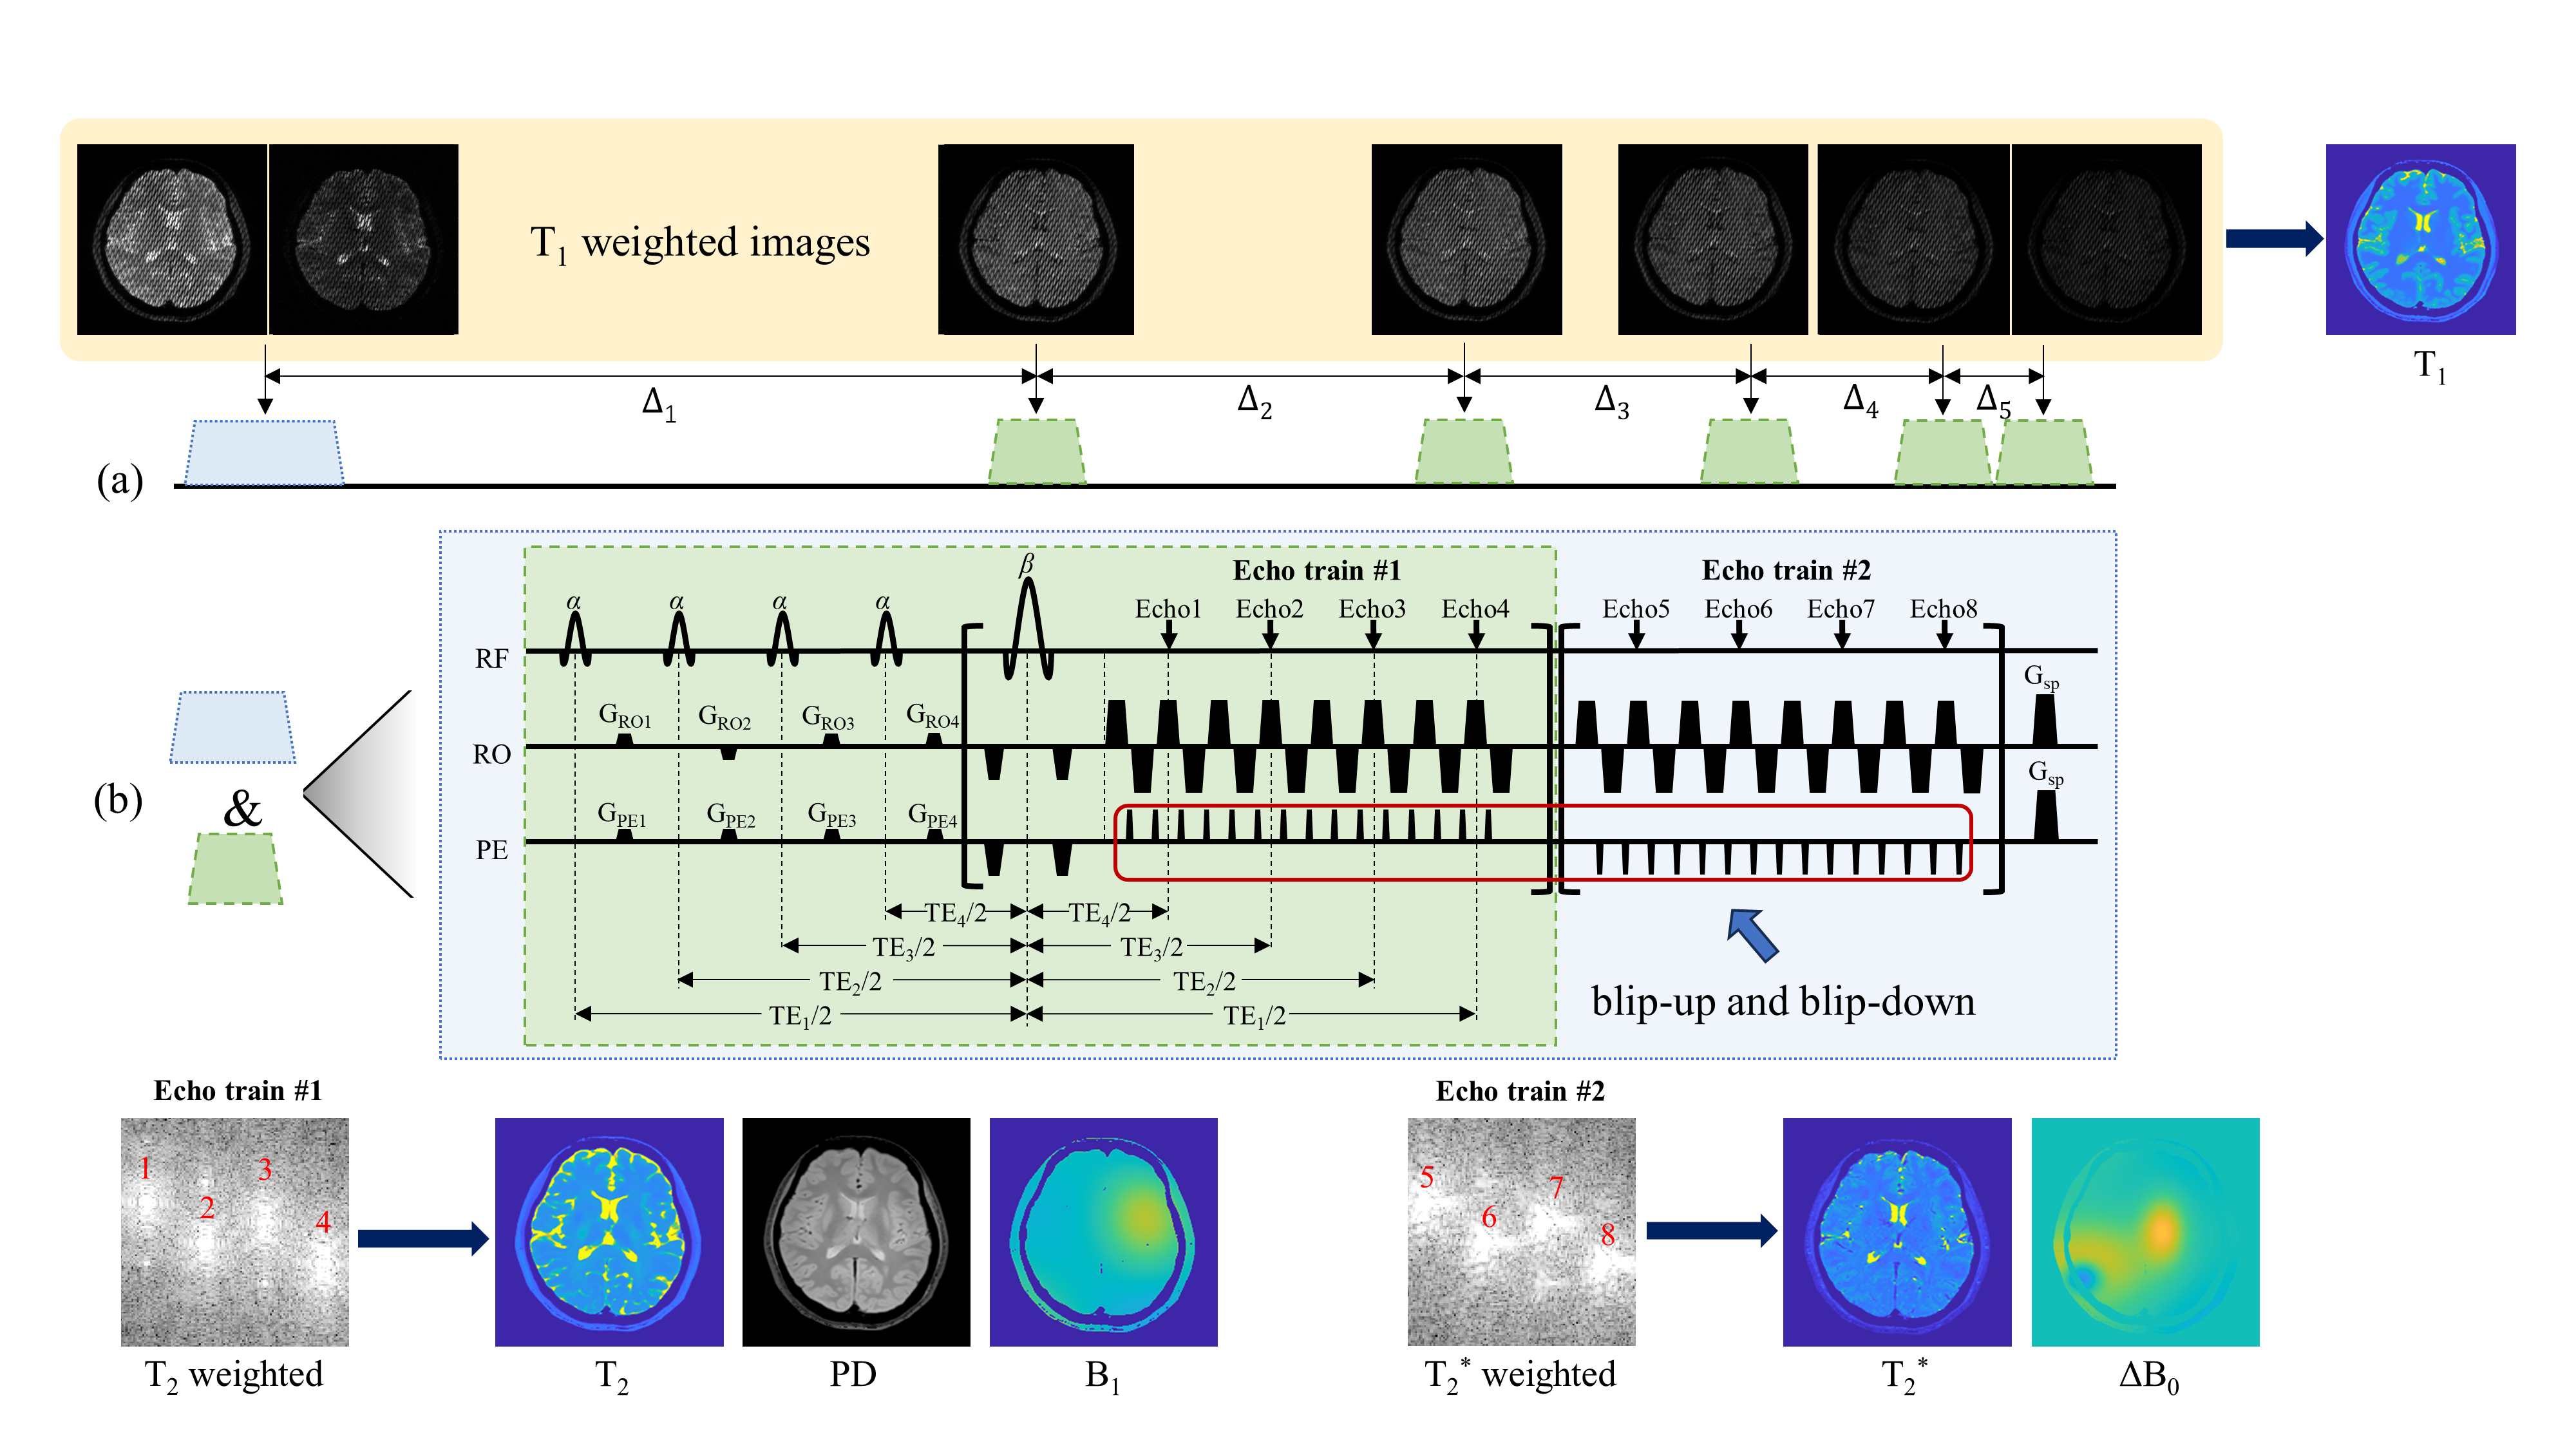
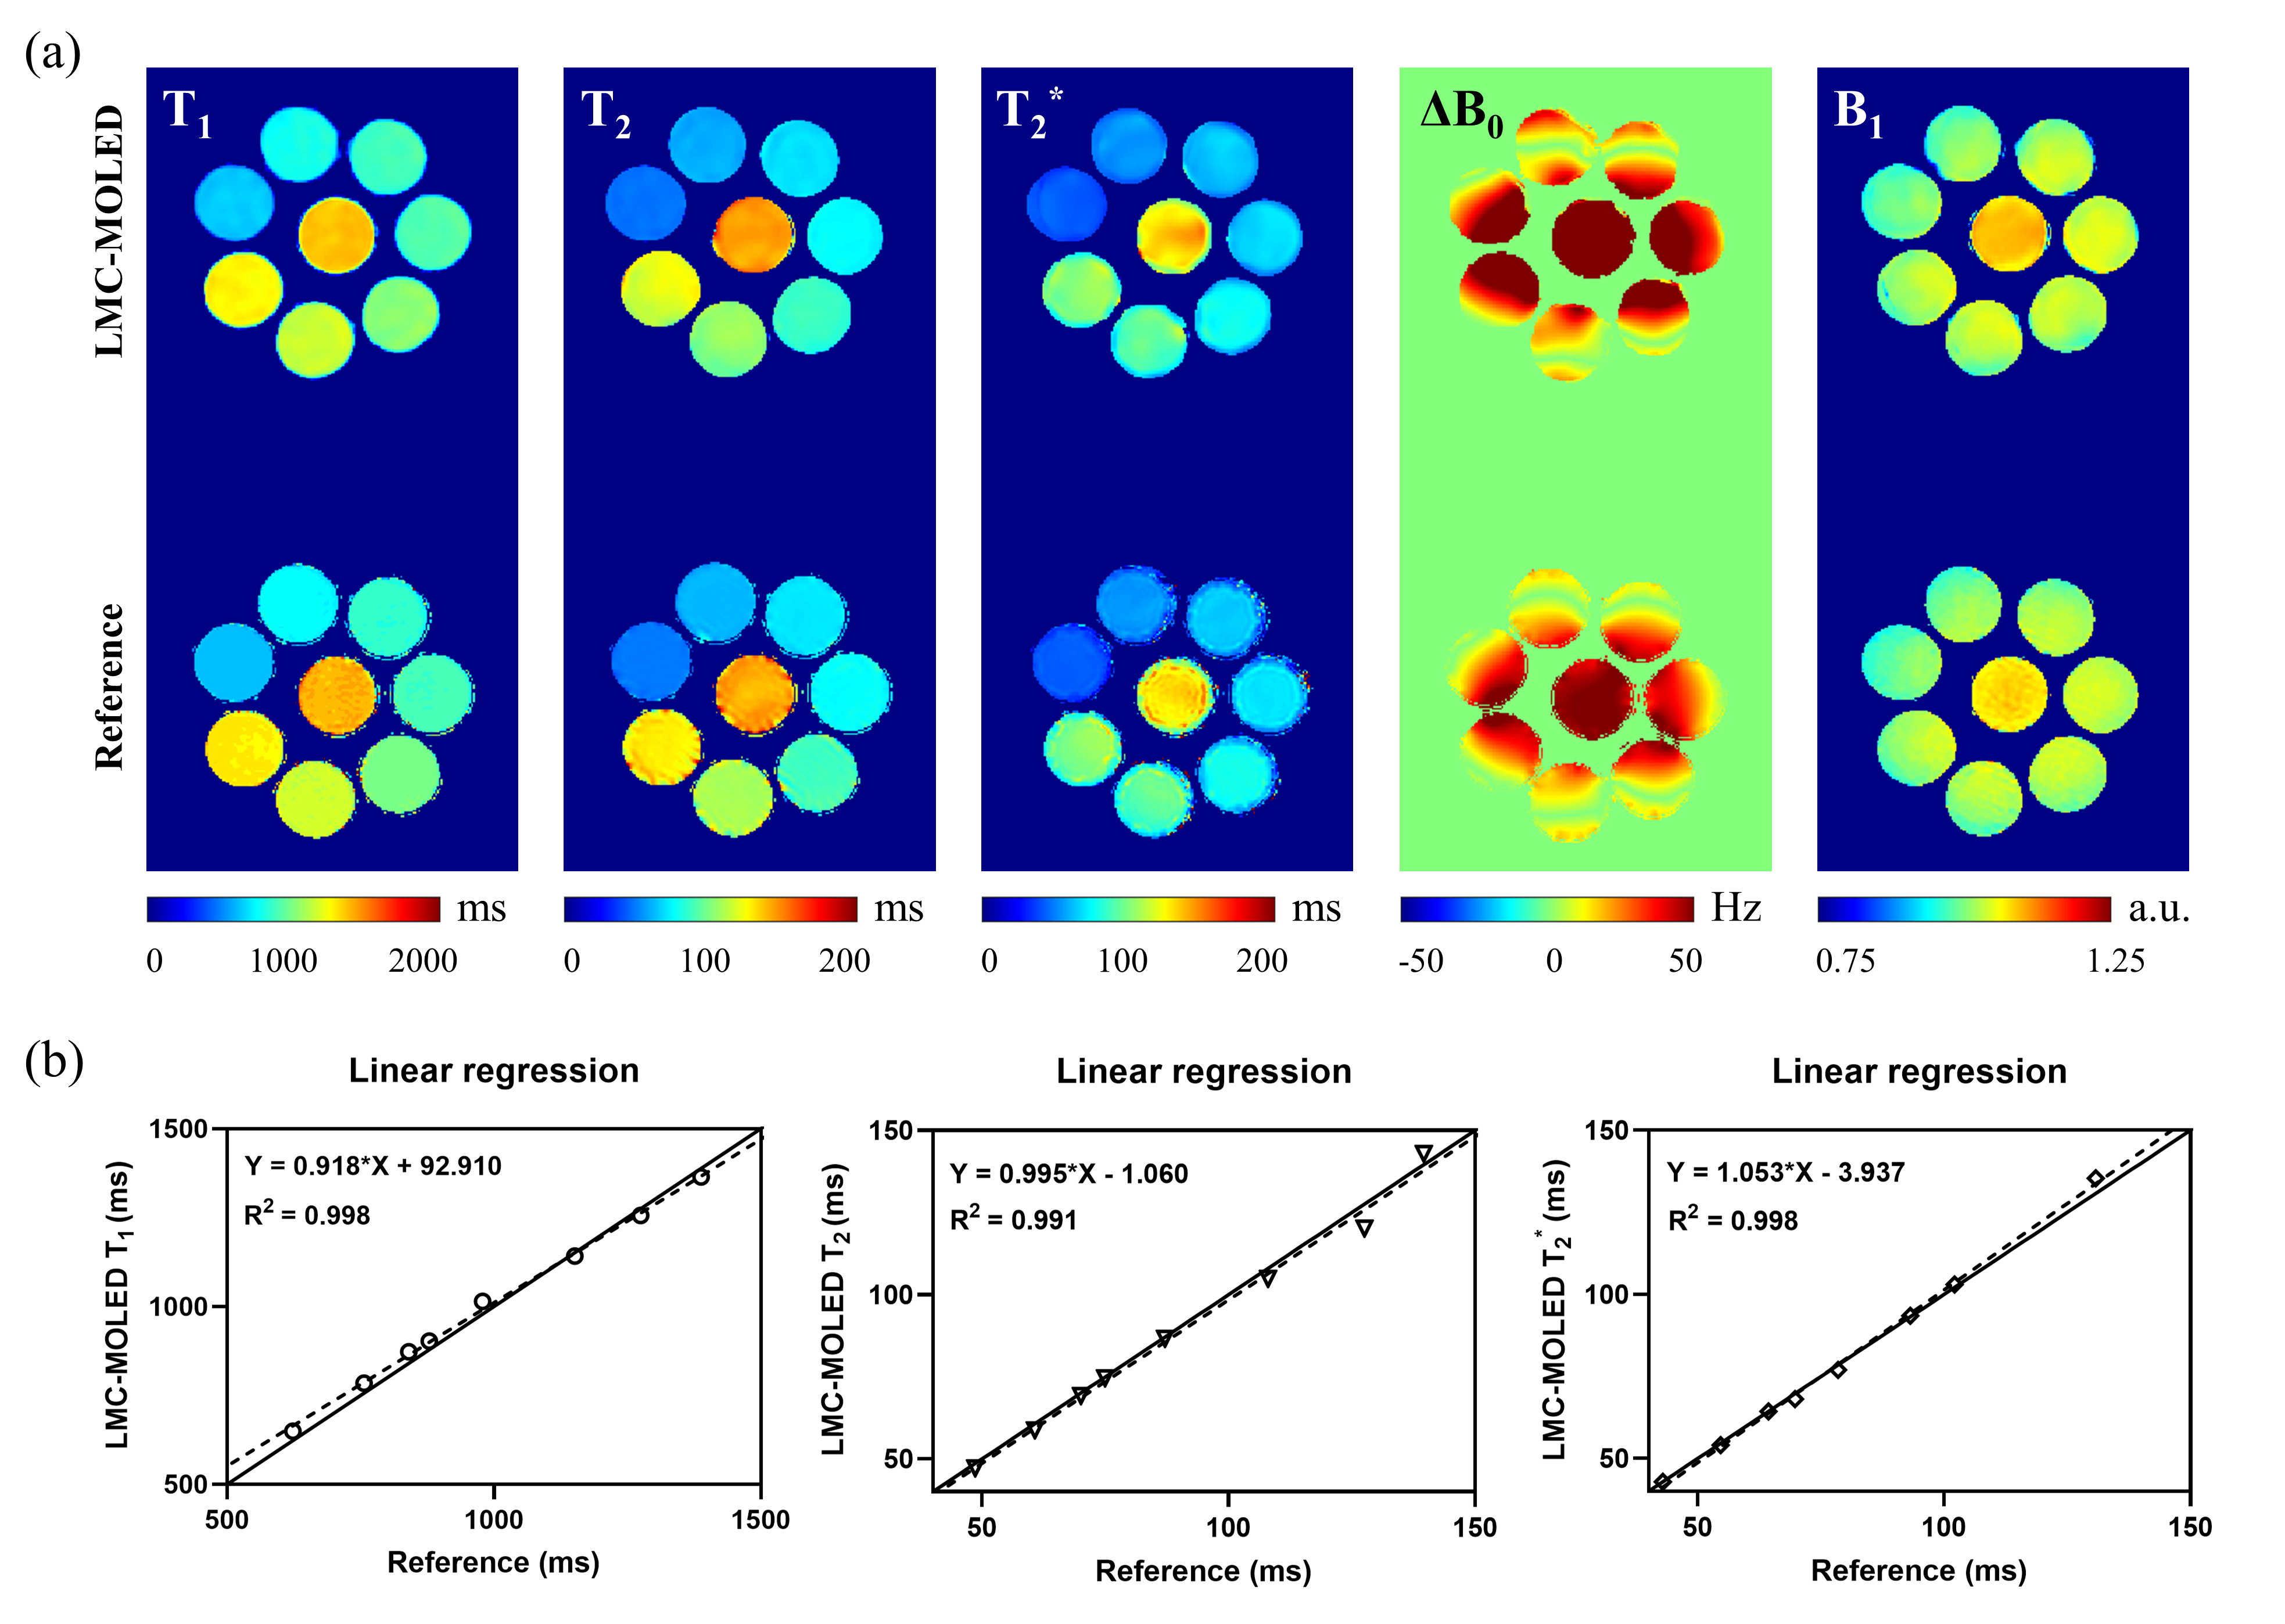
Figure 2 (a) Comparison of T1, T2, T2*, ΔB0, and B1 maps between LMC-MOLED and the reference methods. (b) Scatter plots of the quantified values for 8 water tubes, accompanied by contour lines (solid), linear regression lines (dashed), slopes, intercepts, and R2 values.