3702
Histogram Analysis of Perfusion and Diffusion MR Metrics in Predicting the Consistency of Meningiomas1Fujian Medical University Union Hospital, Fuzhou, China, 2MR Scientific Marketing, Siemens, Healthineers Ltd, Shanghai, China
Synopsis
Keywords: Tumors (Pre-Treatment), Quantitative Imaging
Motivation: The consistency of intracranial meningiomas is essential for determining the necessary surgical instruments and influencing the outcome of surgery. However, no specific feature of conventional MRI is reliable in predicting the meningiomas consistency.
Goal(s): To evaluate and compare the potential of various MRI perfusion and diffusion metrics in predicting the meningiomas consistency.
Approach: Histogram parameters of metrics obtained from DKI, DTI, ASL and DSC were included in logistic regression models to predict meningiomas consistency.
Results: DTI, ASL, and DSC metrics could significantly differentiate between soft and hard meningiomas. The DSC combined model yielded the highest AUC of 0.858.
Impact: The differentiation of soft and hard meningiomas was feasible by combining histogram parameters of DSC and DTI metrics.
Purpose
Meningioma is the most common primary brain tumors.1 Although conventional MRI provides several identifiable features for meningiomas, no specific feature is reliable in predicting the tumor consistency.2 Histogram analysis of perfusion and diffusion metrics have been successfully used in predicting the grade, subtype and proliferative activity of meningiomas.3-4 In this study, we prospectively evaluated and compared the potential of various perfusion and diffusion metrics obtained from the diffusion kurtosis imaging (DKI), diffusion tensor imaging (DTI), arterial spin labelling (ASL) and dynamic susceptibility contrast-enhanced imaging (DSC) in predicting the meningioma consistency.Methods
Seventy-seven consecutive patients with histopathologically confirmed meningiomas were prospectively enrolled in this study. MRI scans were performed on a 3T scanner (MAGNETOM Prisma, Siemens Healthineers, Erlangen, Germany). DKI used a Single-shot Echo-Planar Imaging (SE-EPI) diffusion sequence for image acquisition (TR/TE = 4,540/72.8 ms, Average = 1, matrix = 256 × 256, sections thickness = 4 mm, spacing = 0 mm, FOV = 24 cm, number of b values = 3, b = 0, 1000 and 2000 s/mm2, number of directions = 30 for each, acquisition time = 4 min 51 seconds). ASL imaging was performed by pseudo-continuous ASL pulse sequence using a stack of spirals with a background-suppressed 3D fast spin echo imaging sequences (TR/TE = 4,653/10.5 ms, Average = 3, matrix = 512 × 8, FOV = 24cm, post-labeling delay = 1525 ms, slice thickness = 4 mm, inter-slice gap = 0 mm). DSC used a gradient-recalled echo-planar imaging (GRE-EPI) T2*WI sequence (TR = 1500 ms, minimum TE, Average = 1, matrix = 96 × 128, slice thickness = 6 mm, FOV = 24 cm, flip angle = 60°). Diffusional Kurtosis Estimator (version 2.5.1, Medical University of South Carolina) was implemented to calculate diffusion kurtosis and tensor metrics. The ASL and DSC data were obtained and transferred to a workstation (Advantage Workstation 4.6, GE HealthCare, Waukesha/WI, USA) for processing. Two senior neurosurgeons evaluated the tumor consistency and classified them as soft and hard groups. A Volume of interest (VOI) placed on the preoperative axial contrast-enhanced T1WI to outline the whole tumor area by using ITK-SNAP (Version 3.6.0) were then automatically projected onto functional maps by a co-registration tool based on SPM8 (http://www.fl.ion.ucl.ac.uk/spm/). Eighteen histogram parameters recommended by Pyradiomics 5 (presented in the Fig. S1.) were extracted by Feature Explorer (Version 0.5.3) from 17 functional maps including mean diffusivity (MDDKI, MDDTI), axial diffusivity (ADDKI, ADDTI), radial diffusivity (RDDKI, RDDTI), fractional anisotropy (FADKI, FADTI), mean kurtosis (MK), axial kurtosis (AK), radial kurtosis (RK), cerebral blood flow (CBFASL), relative cerebral blood flow (rCBF), relative cerebral blood volume (rCBV), time to top (Tmax), mean transit time (MTT), and time to peak (TTP), respectively. Histogram parameters found to be related to tumor consistency in the univariate analysis were further included in backward stepwise logistic regression analyses to build combined models for each modality. The diagnostic performance of each model was evaluated by Receiver operating characteristic analysis. DeLong test was used to compare AUCs.Results
Thirty of 77 tumors were included in the hard group by neurosurgeons, and the rest were classified as soft tumors. Histogram parameters of DTI metrics (ADDTI and FADTI), ASL (CBFASL) and DSC (Tmax, rCBV and rCBF) were found to be significantly related to the meningiomas consistency and then be included into the combined models (P<0.05). However, none of DKI metrics can significantly differentiate soft and hard meningiomas. Representative cases are shown in Figs. 1. Fig. 2 shows that the DSC combined model yielded the highest AUC of 0.858. The DTI combined model had a relatively lower AUC value of 0.810, while the AUC of the ASL combined model was only 0.648. Delong test indicated that there was no significant difference between DTI and DSC model diagnostic performance.Discussion and conclusion
In this study, 20 histogram parameters of perfusion and diffusion metrics were found to be independently related to the meningiomas consistency, and the differentiation of soft and hard meningiomas is feasible by DSC and DTI combined models. Generally, we found that the histogram parameters of perfusion metrics were significantly lower in hard tumors than in soft tumors. It suggests the potential correlation between higher tumor micro-perfusion and softer consistency. On the contrary, the histogram parameters of diffusion metrics were significantly higher in hard tumors than in soft tumors. It is probably due to the higher fiber content of hard tumors. In addition, the vastly greater diagnostic performance of combined models than any single histogram parameter indicates that combination of various histogram parameters will help to comprehensively characterize the microstructure of the tumor.Acknowledgements
Not applicable.References
1. Kurokawa R, Kurokawa M, Baba A, et al. Major Changes in 2021 World Health Organization Classification of Central Nervous System Tumors. Radiographics. 2022;42(5):1474-1493.
2. Yao A, Pain M, Balchandani P, Shrivastava RK. Can MRI predict meningioma consistency?: a correlation with tumor pathology and systematic review. Neurosurg Rev. 2018;41(3):745-753.
3. Cao T, Jiang R, Zheng L, et al. T1 and ADC histogram parameters may be an in vivo biomarker for predicting the grade, subtype, and proliferative activity of meningioma. Eur Radiol. 2022;10.1007/s00330-022-09026-5.
4. Toh C H, Wei K C, Chang C N, et al.Assessment of angiographic vascularity of meningiomas with dynamic susceptibility contrast-enhanced perfusion-weighted imaging and diffusion tensor imaging.[J].American Journal of Neuroradiology, 2014, 35(2):263-9.
5. van Griethuysen JJM, Fedorov A, Parmar C, et al. Computational radiomics system to decode the radiographic phenotype. Cancer Res. 2017;77:e104–e107.
Figures
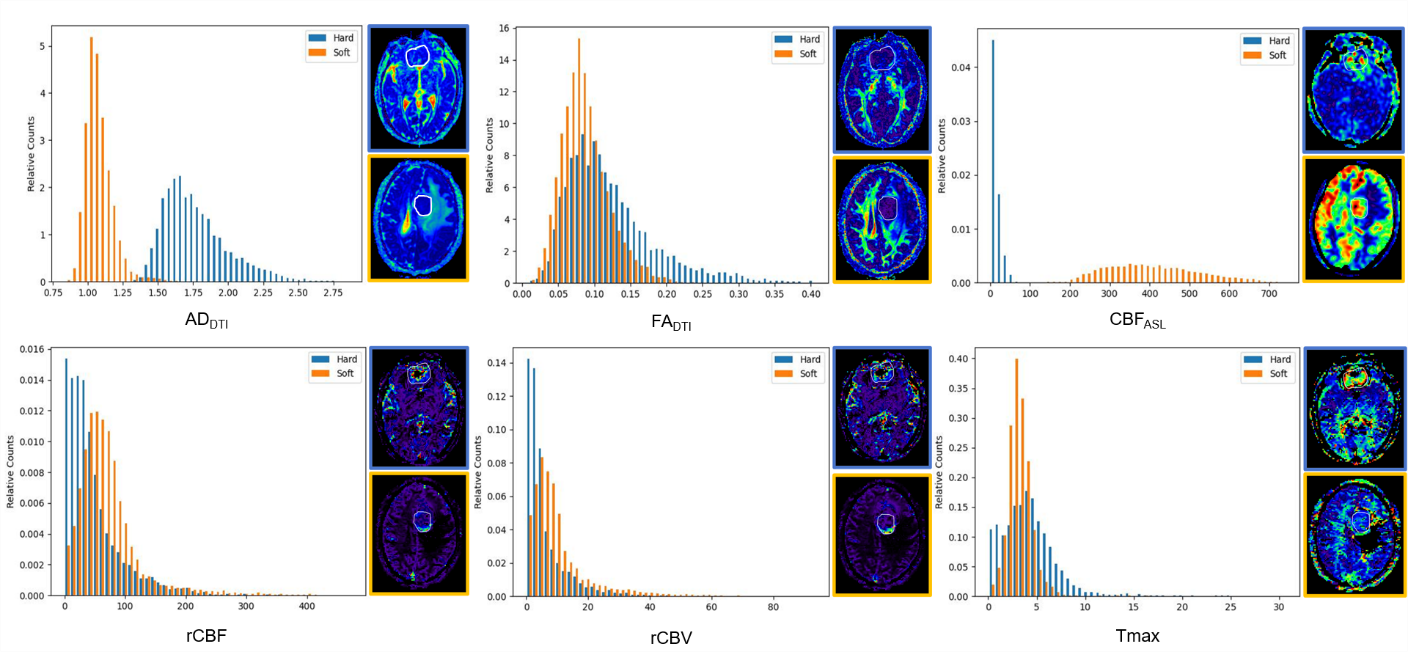
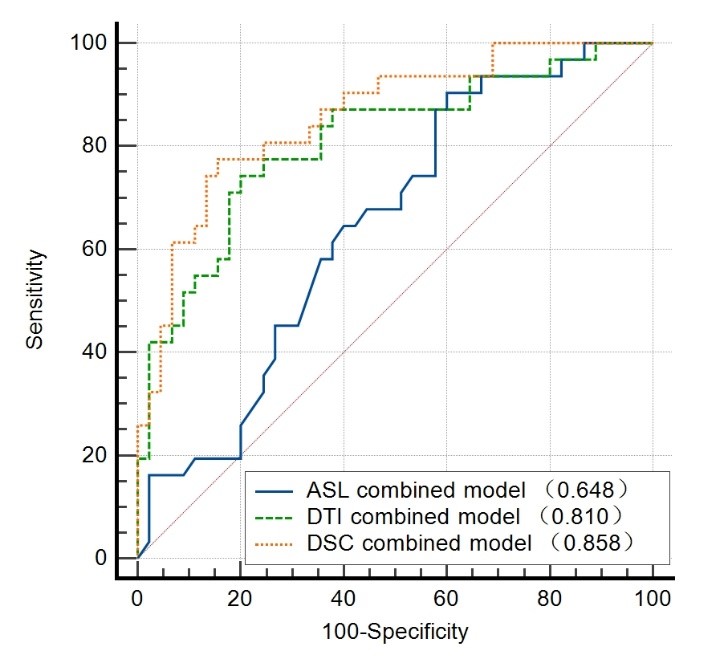
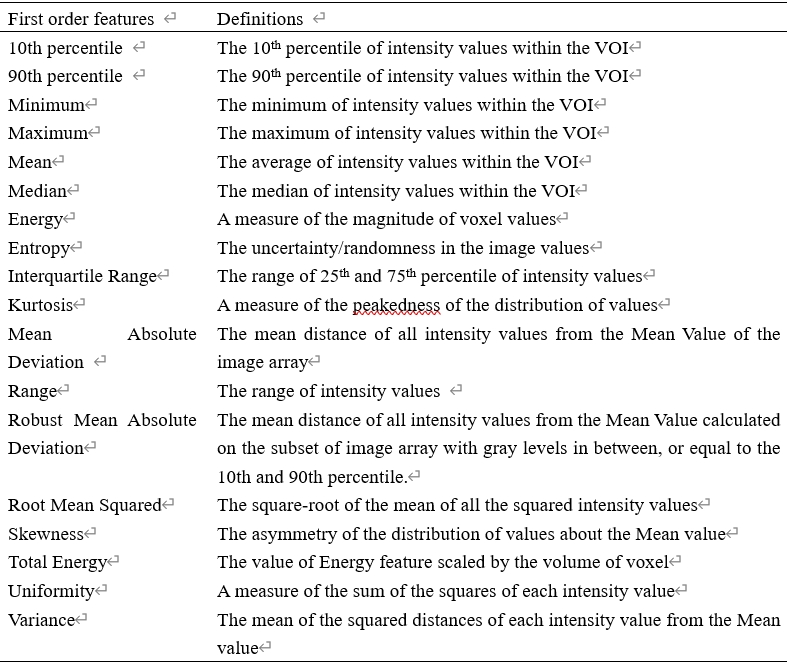
Fig S1: List of histogram parameters in this study.