3700
Determining grade and subtype of meningiomas with inversion recovery multiple overlapping-echo detachment imaging1Department of Electronic Science, Fujian Provincial Key Laboratory of Plasma and Magnetic Resonance, Xiamen University, Xiamen, China, 2Department of Magnetic Resonance Imaging, the First Affiliated Hospital of Zhengzhou University, Zhengzhou, China, 3Clinical & Technical Support, Philips Healthcare, shenzhen, China, 4Department of Imaging Sciences, University of Rochester, New York, NY, United States
Synopsis
Keywords: Tumors (Pre-Treatment), Tumor, T2 mapping with FLAIR
Motivation: T2 mapping with FLAIR eliminates the interference of cerebrospinal fluid, depicting lesion more precise than conventional T2 mapping, but its use for grading and classifying meningiomas is scarce.
Goal(s): To investigate the value of a single-shot T2-FLAIR mapping method, inversion recovery multiple overlapping-echo detachment imaging (IR-MOLED), in distinguishing grades and subtypes of meningiomas.
Approach: IR-MOLED was applied on meningioma patients (N = 45), and histogram analysis of enhanced tumor regions was performed based on the resultant parametric maps.
Results: T2-FLAIR mapping is sensitive in determining the meningiomas grade (AUC = 0.813) and subtype (AUC = 0.971).
Impact: IR-MOLED-based quantitative analysis is promising in differentiating high and low grades and subtypes of meningiomas, especially in patients losing body control.
Introduction
The world health organization (WHO) classification of meningioma is widely recognized for predicting the prognosis of meningiomas, dividing them into three grades and fifteen subtypes. Grades Ⅱ and Ⅲ meningiomas are more dangerous than Grade I,1,2 and therefore tumor classification is crucial. In this study, inversion recovery multiple overlapping-echo detachment imaging (IR-MOLED)3 was applied on meningioma patients to evaluate its value in identifying meningiomas.Methods
Data acquisition: 45 patients were recruited, where 11 high-grade group (WHO II & III) and 34 low-grade group (WHO I, comprising 15 fibrous, 12 meningothelial, and 7 transitional subtypes). Patients were scanned on 3.0 T MRI scanner (MAGNETOM Prisma, Siemens Healthcare, Erlangen, Germany) with IR-MOLED (Figure 1a, TI/TR = 2.5/15 s, TE1-TE4 = 22/52/82/110 ms, α = 30°,matrix size = 128×128,slice thickness = 3.5 mm, FOV = 220×220 mm2, 21 slices) , MOLED (TR = 8.0 s, TE1-TE4 = 22/52/82/110 ms, α = 30°,matrix size = 128×128,slice thickness = 3.5 mm, FOV = 220×220 mm2, 21 slices acquisition time per slice = 118 ms4,5) and T1 contrast-enhanced sequences.Analysis: Two independent neuroradiologists (each with 10 years of experience in neuroimaging) manually delineated ROIs on contrast-enhanced T1-weighted images, defined as the enhanced tumor regions, then the ROIs were linearly transformed onto T2-FLAIR maps using FSL. Based on histogram of T2-FLAIR maps within ROIs, 11 metrics (including mean, standard deviation, and skewness) were calculated. Mann-Whitney U test was used to compare histogram metrics between different groups, and binary and multivariate logistic regression models were applied to assess their performance in distinguishing grades and subtypes of meningiomas.
Results
T2-FLAIR skewness exhibited significant differences in distinguishing high-grade and low-grade meningioma groups (Figure 2, AUC = 0.813). In contrast, conventional T2 maps from MOLED did not show significant differences in grading meningiomas. For low-grade meningiomas, fibrous and transitional subtypes showed significant differences in mean, 10 percentiles (P10), 25 percentiles (P25), kurtosis obtained from T2-FLAIR maps (Figure 3). Moreover, a joint logistic regression model using the above four metrics performed well in distinguishing between fibrous and transitional subtypes of meningiomas (AUC = 0.971, Figure 4). A multivariate logistic regression model constructed using mean, median, root mean square (RMS), P10, P25, kurtosis, achieved a considerable classification rate of 67.6% for the three WHO I meningioma subtypes with the classifications rate of 80%/71.4% for fibrous/transitional subtypes, and 50% for meningothelial subtype (Table 1).Discussion and conclusion
Due to the suppression of CSF signals6 and the ultrafast acquisition speed of IR-MOLED, motion-related artifacts are eliminated efficiently, yielding robust T2-FLAIR maps. The results indicate that IR-MOLED-based quantitative analysis of meningiomas is promising in differentiating high and low grades and subtypes, especially in patients losing body control.Acknowledgements
This work was supported in part by the National Natural Science Foundation of China under grant numbers 1237529, 82071913 and 22161142024, and in part by the national key R&D program of China under grant 2022YFC2402102.
References
1. Niu L, Zhou X, Duan C, et al. Differentiation researches on the meningioma subtypes by radiomics from contrast-enhanced magnetic resonance imaging: a preliminary study. World Neurosurgery, 2019, 126: e646-e652.
2. Wang S, Kim S, Zhang Y, et al. Determination of grade and subtype of meningiomas by using histogram analysis of diffusion-tensor imaging metrics. Radiology. 2012; 262(2): 584-592.
3. Lin YH, Yang QQ, Geng WH, et al. Single-shot T2-FLAIR mapping via inversion recovery multiple overlapping-echo acquisition and deep neural network reconstruction. In Proc. 32nd Ann. Meeting ISMRM, Toronto, Canada, 2023.
4. Zhang J, Wu J, Chen SJ, et al. Robust single-shot T2 mapping via multiple overlapping-echo acquisition and deep neural network. IEEE transactions on medical imaging, 2019, 38(8): 1801-1811.
5. Ouyang BY, Yang QZ, Wang XY, et al. Single‐shot T2 mapping via multi‐echo‐train multiple overlapping‐echo detachment planar imaging and multitask deep learning. Medical Physics, 2022, 49(11): 7095-7107.
6. Simonson TM, Magnotta VA, Ehrhardt JC, et al. Echo-planar FLAIR imaging in evaluation of intracranial lesions. Radiographics, 1996, 16(3): 575-584.
Figures
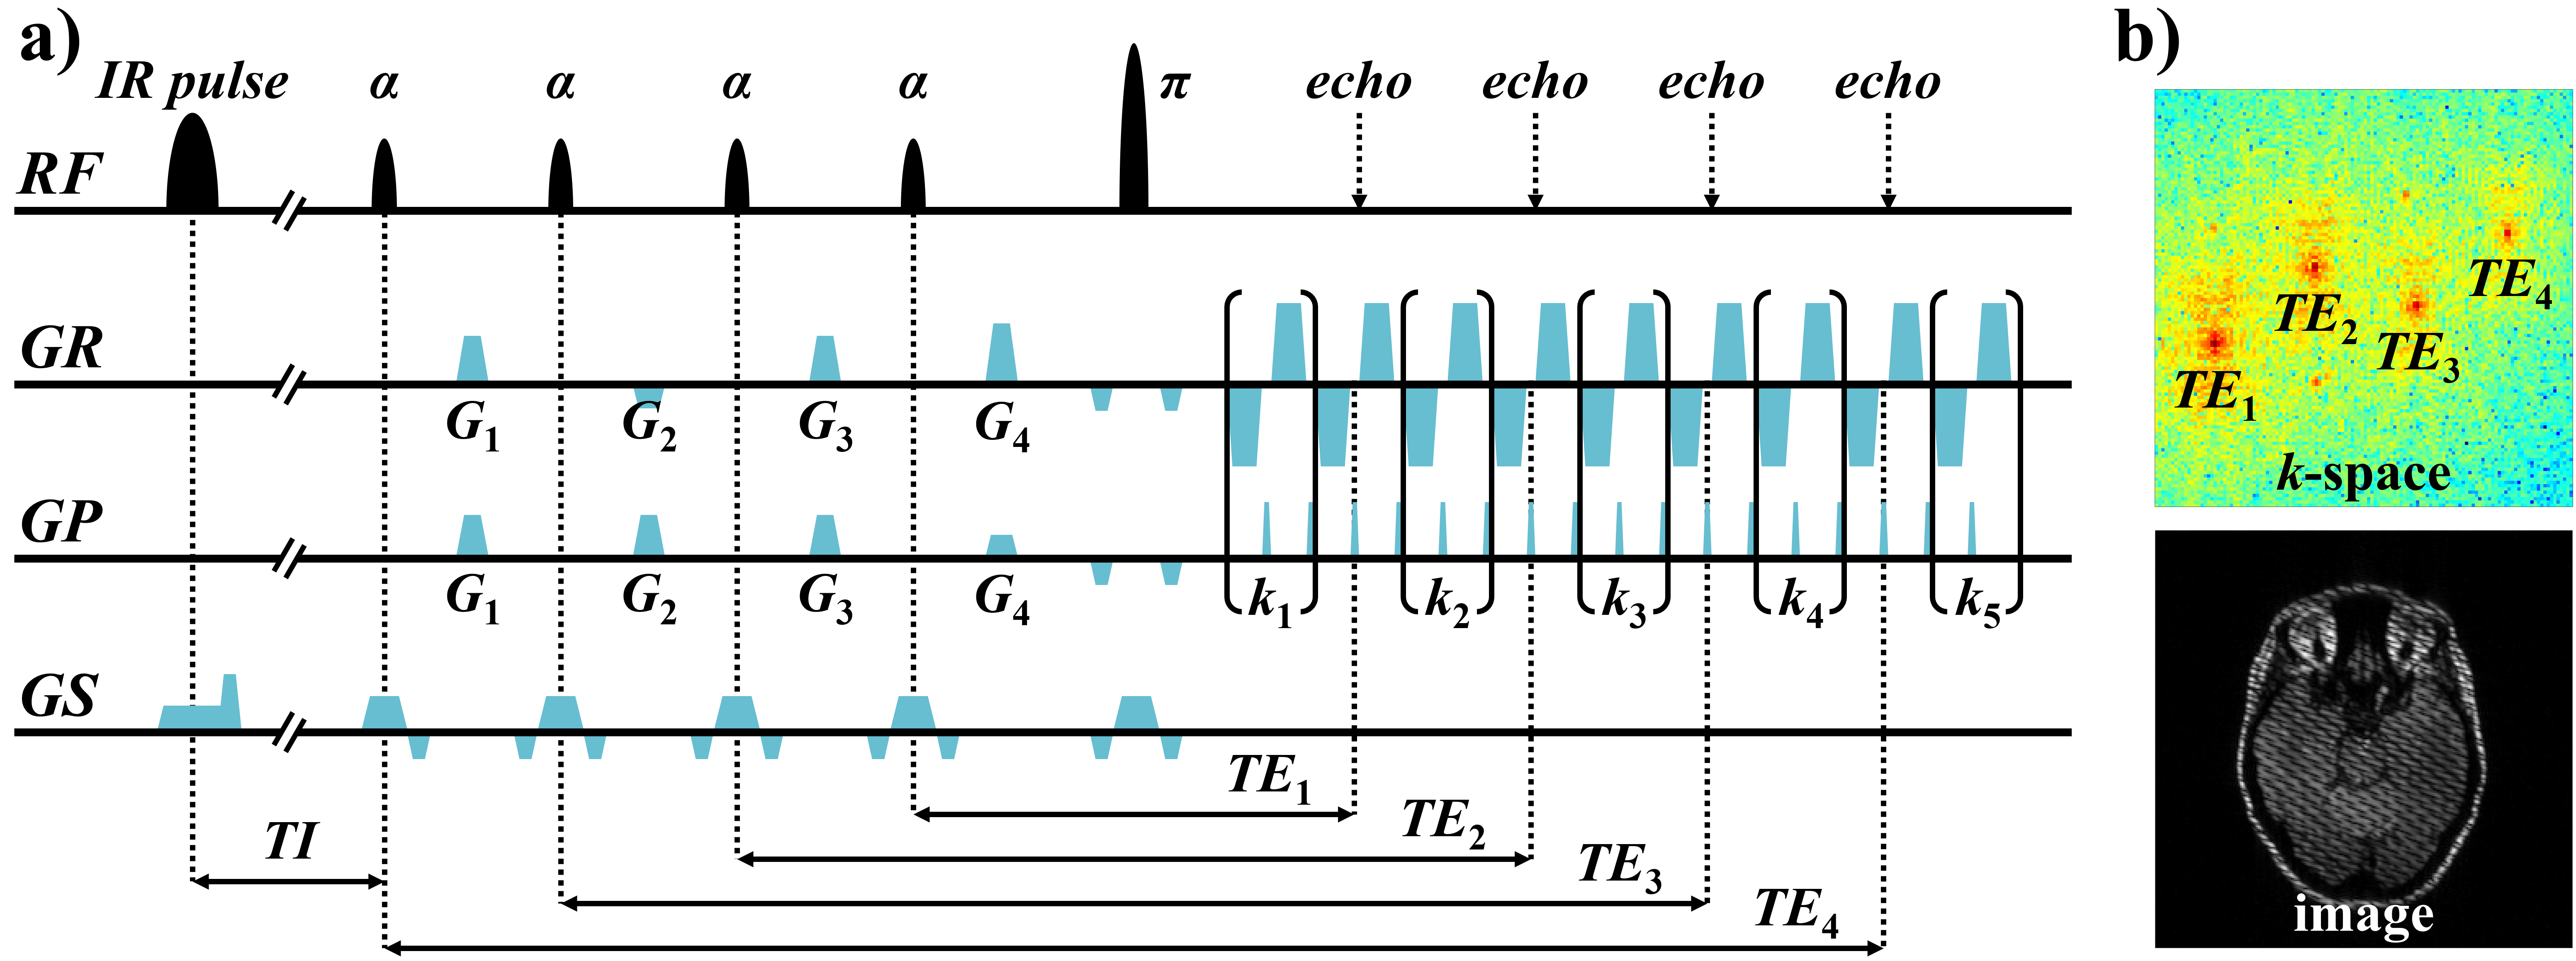
Figure 1. (a) IR-MOLED pulse sequence (Σki equals to phase-encoding steps, and α = 30°), where G1 to G4 are the MOLED-encoding gradients. (b) IR-MOLED signal (shown in amplitude).
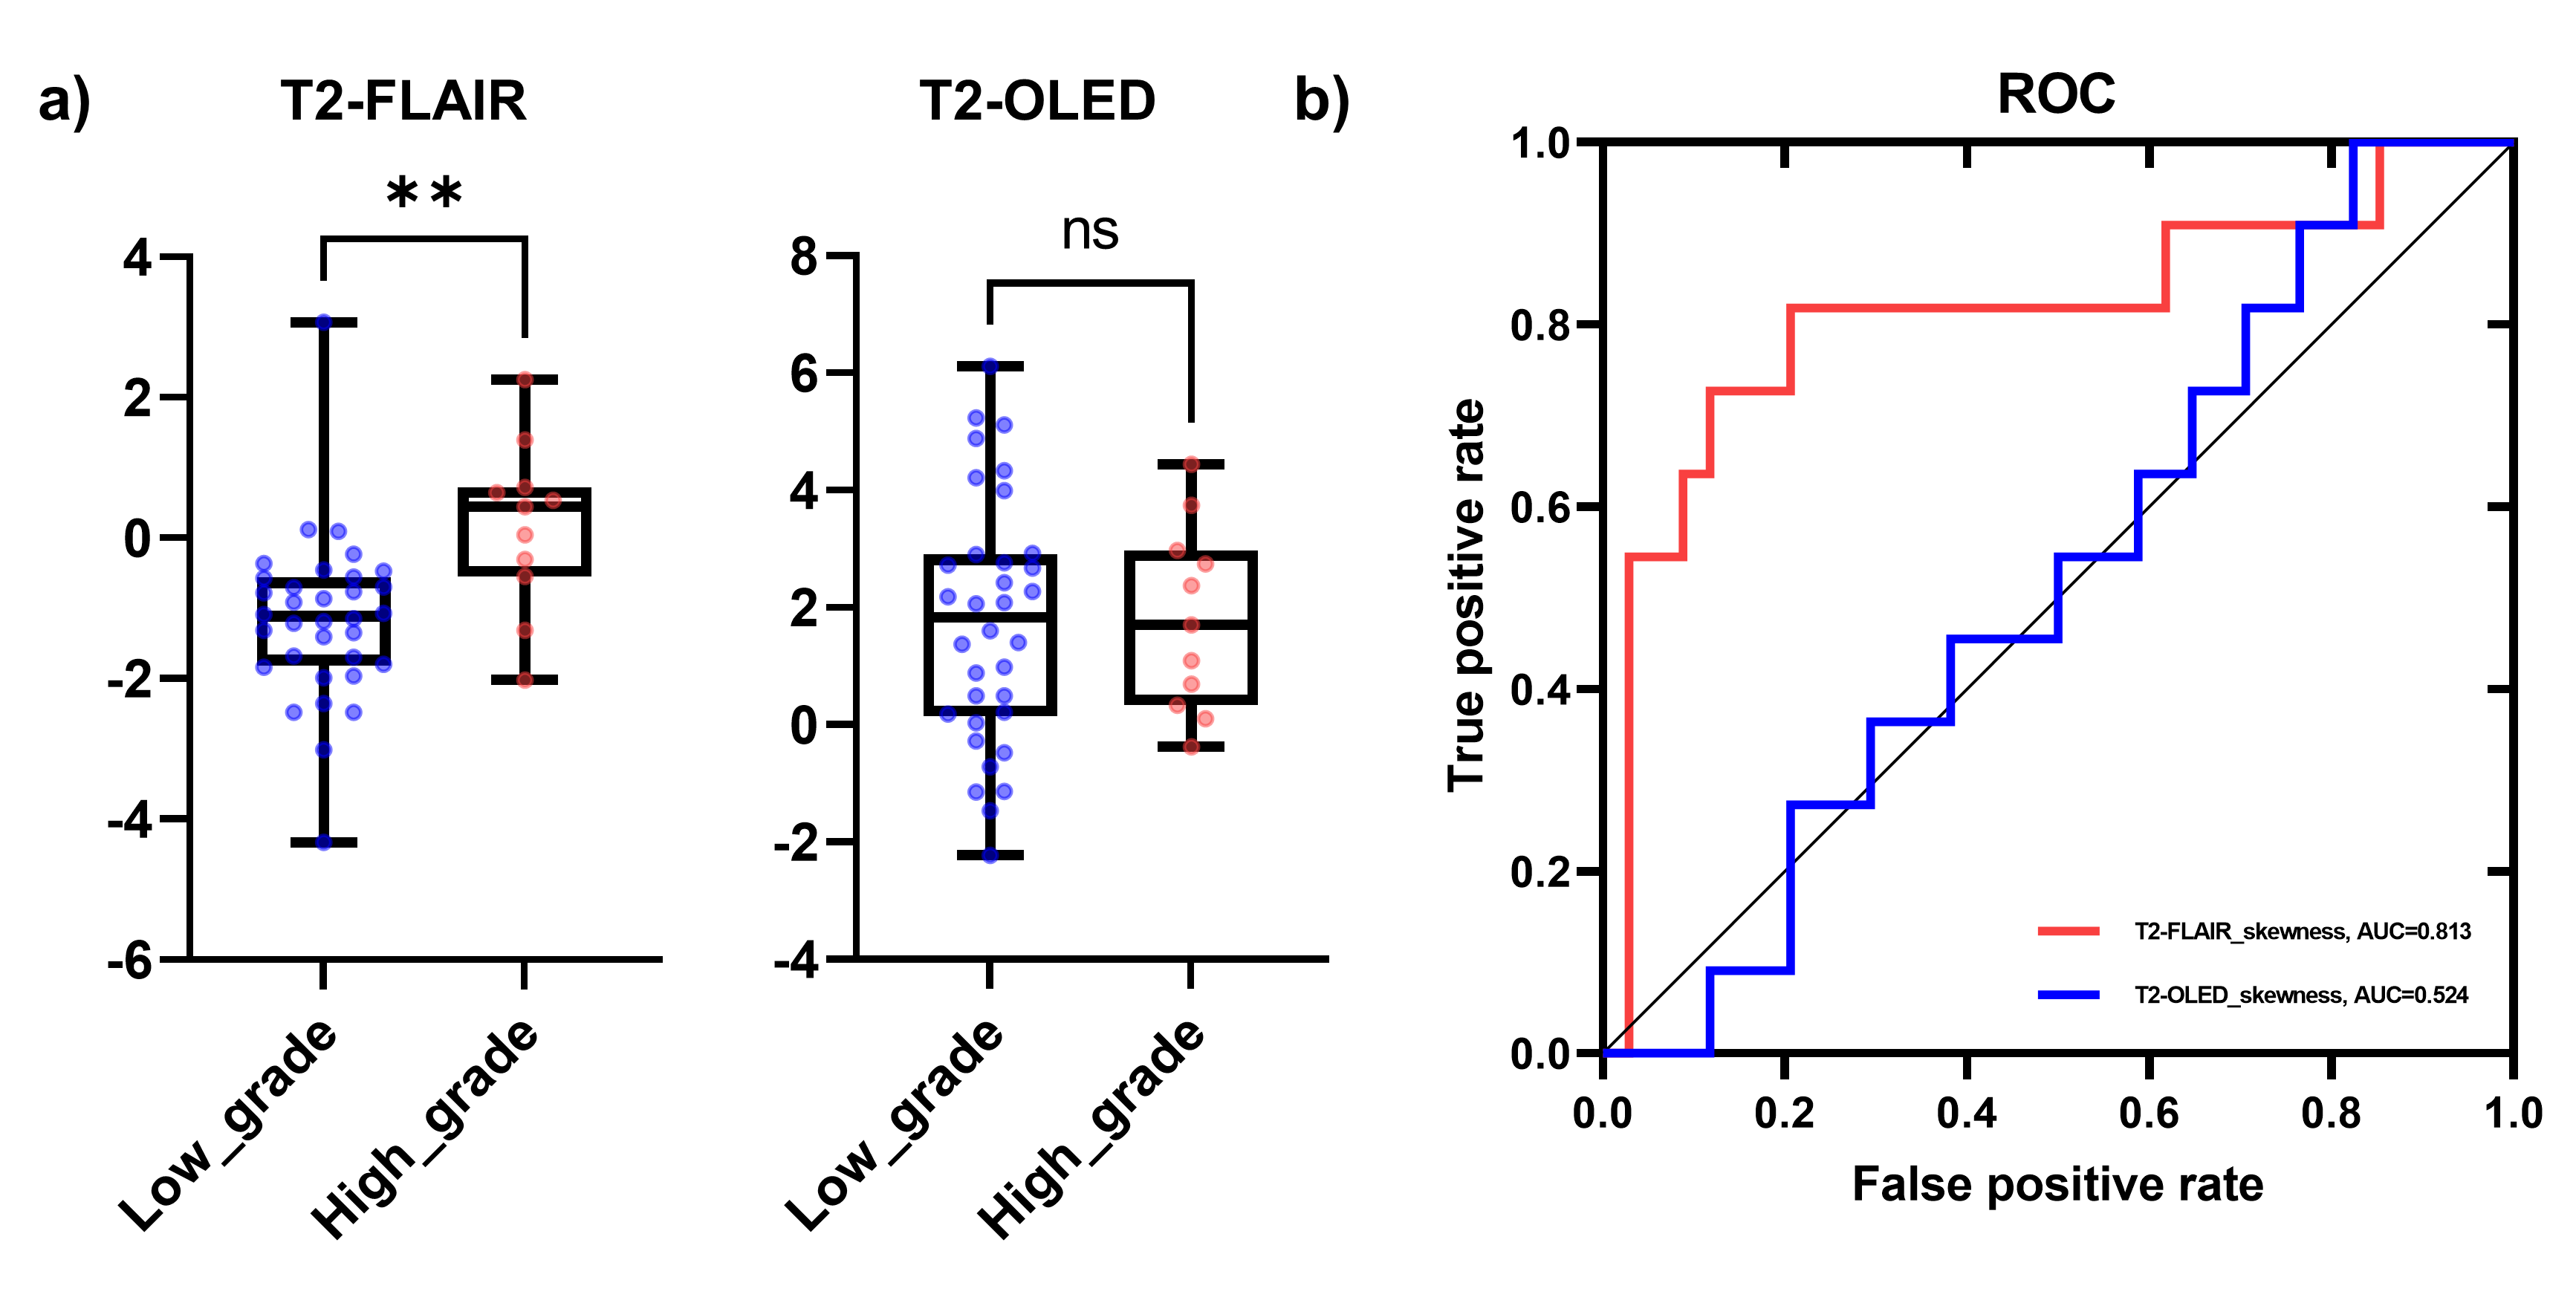
Figure 2. (a) Comparison of skewness between low-grade and high-grade meningioma groups. (b) Receiver operating characteristic curve (ROC) of logistic regression for separation between low-grade and high-grade meningioma patients. ns, p > 0.05; *, p < 0.05; **, p < 0.01.
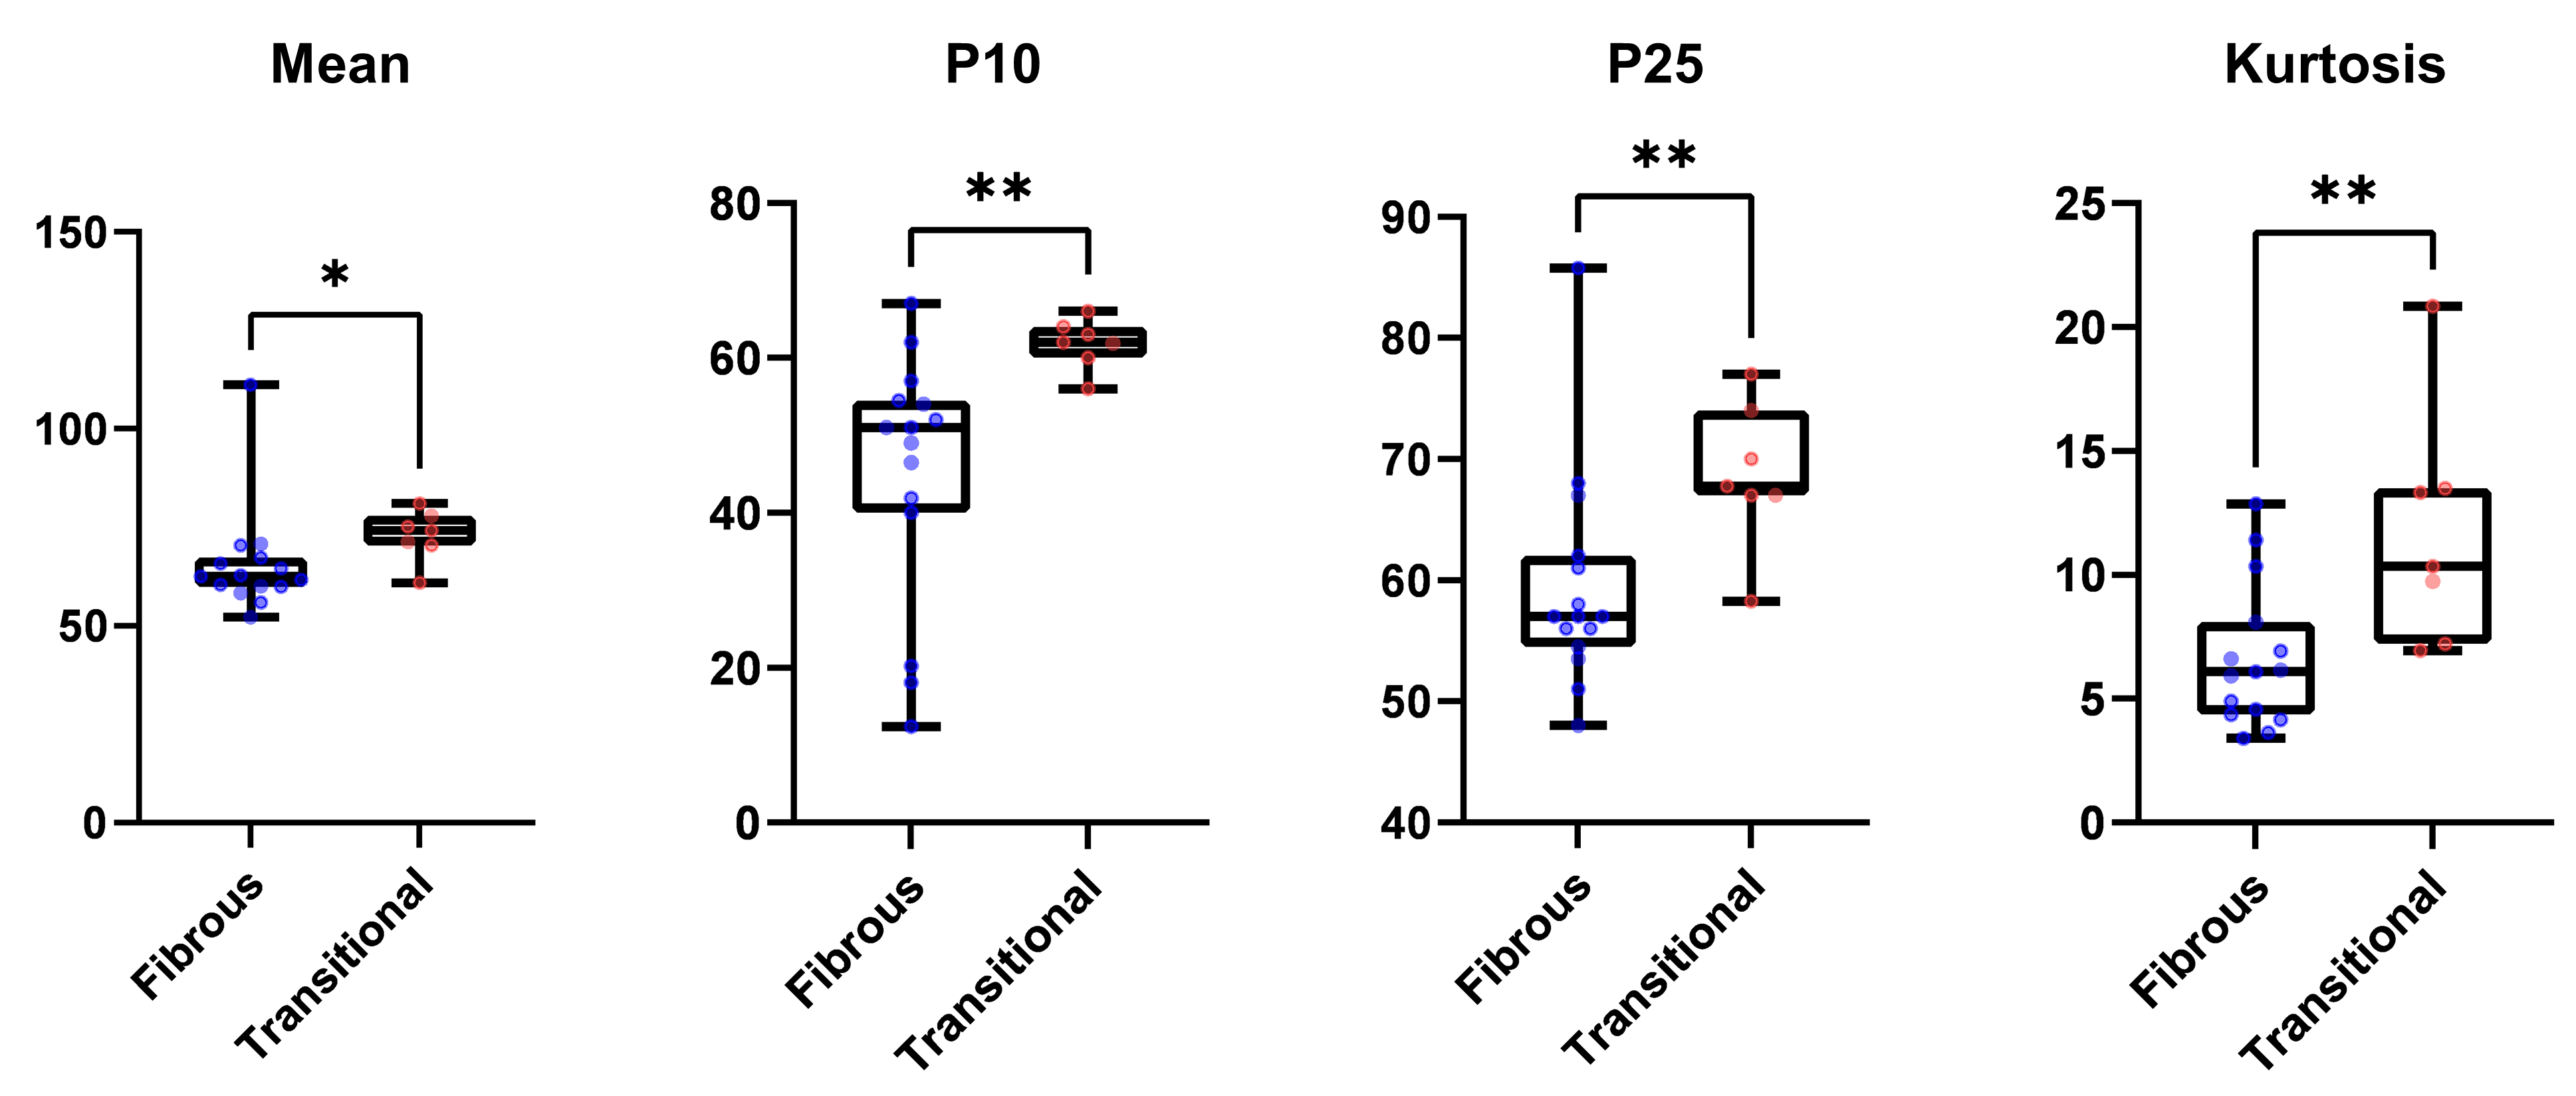
Figure 3. Comparison of the histogram metrics of T2-FLAIR maps between fibrous and transitional subtypes. *, p < 0.05; **, p < 0.01.
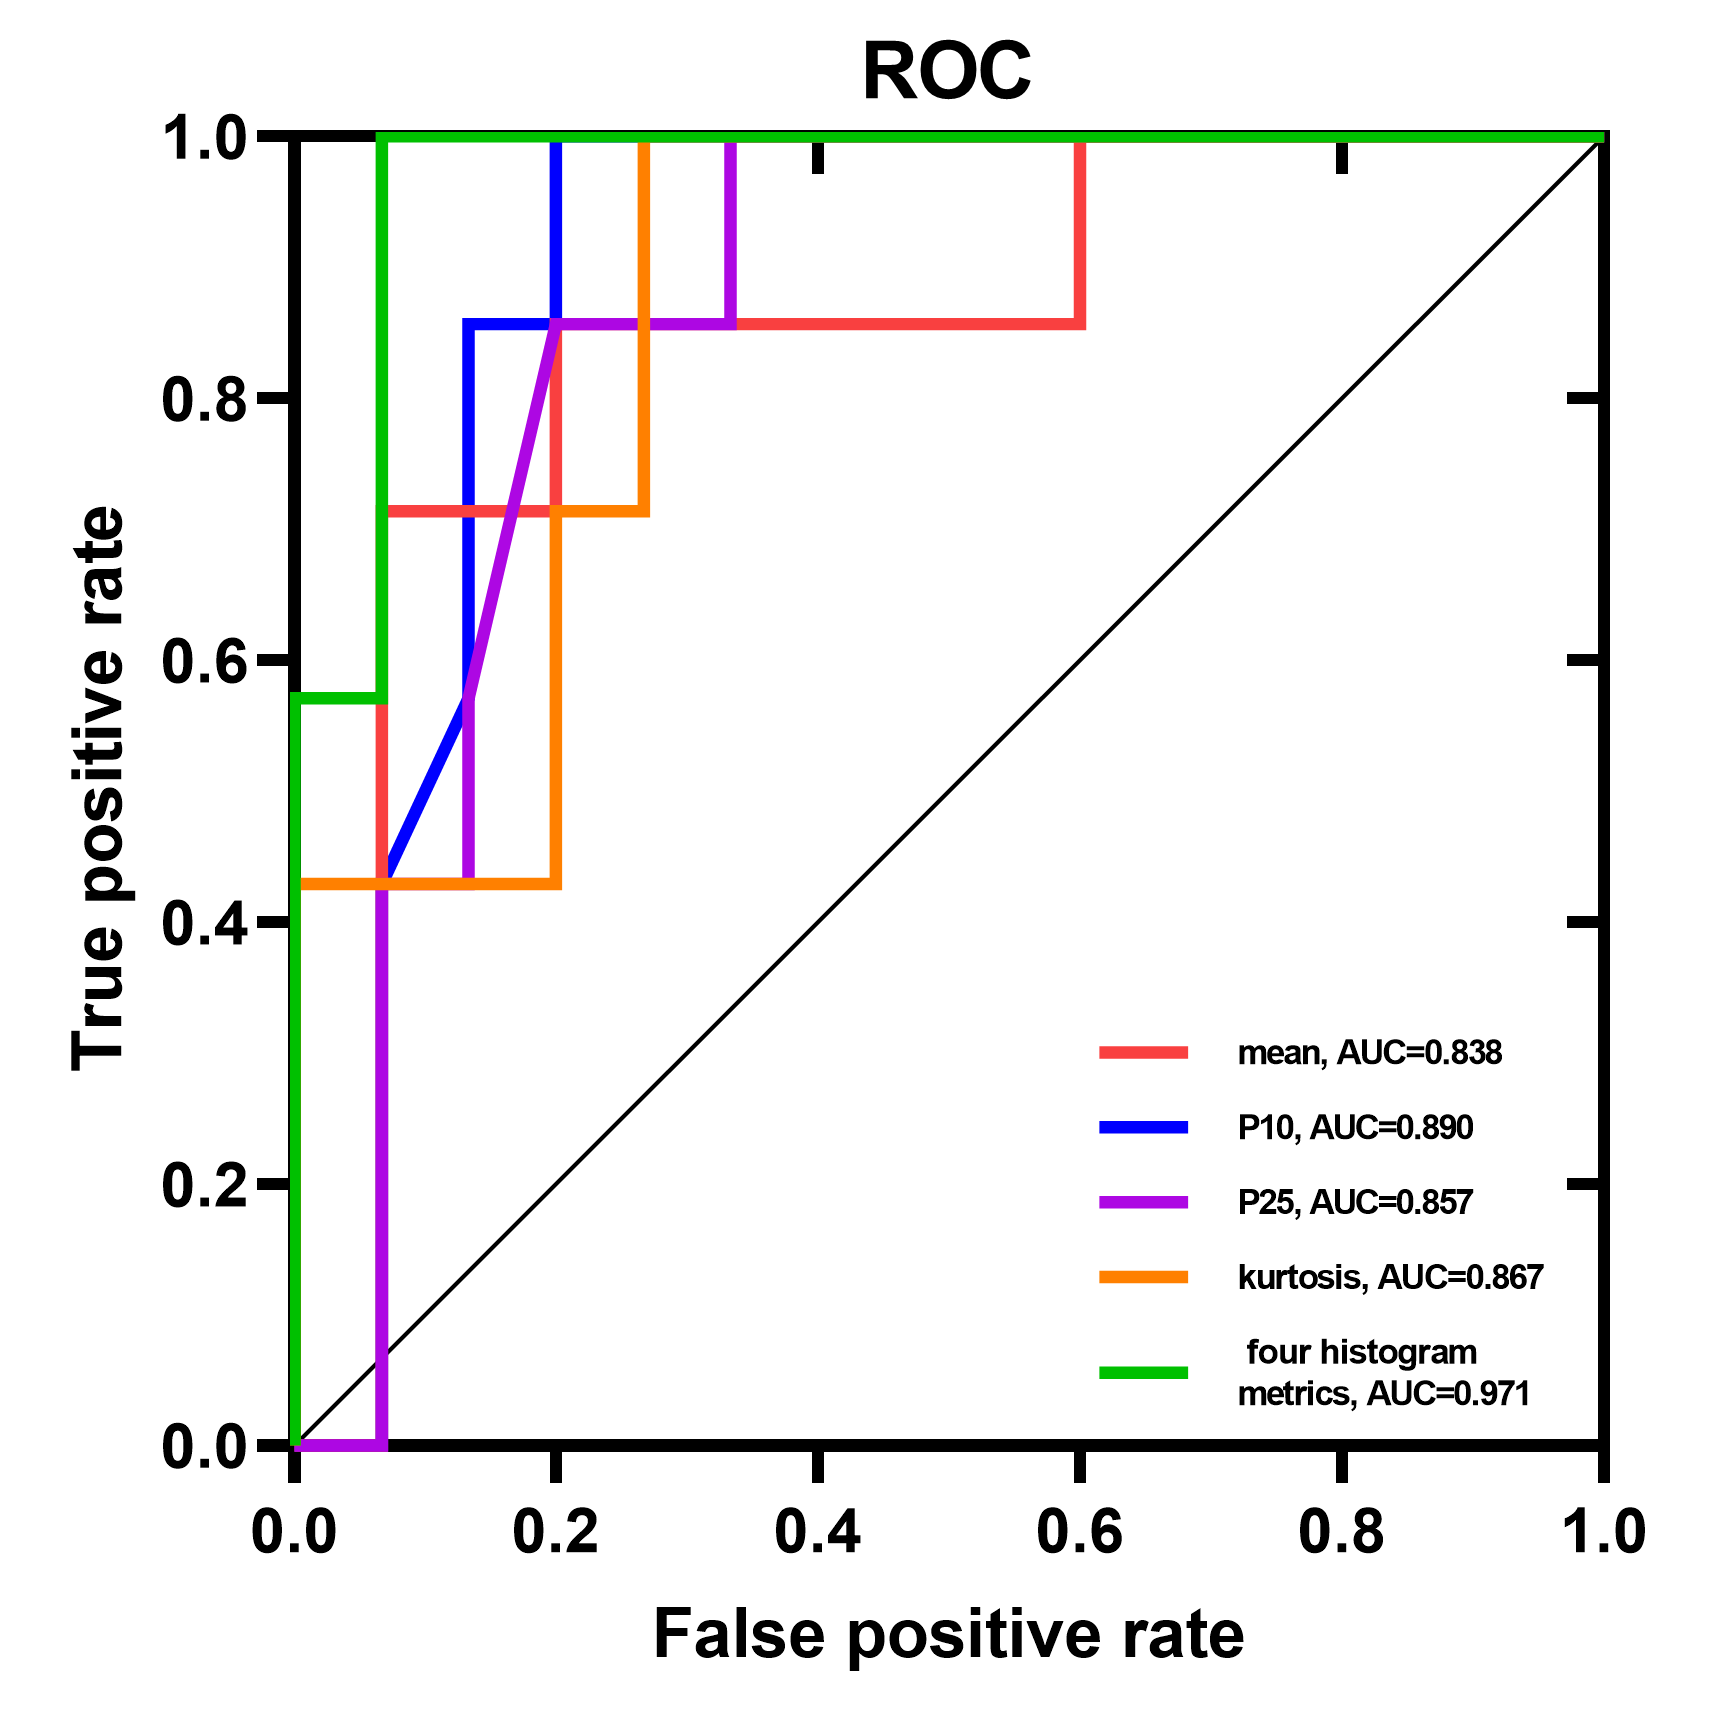
Figure 4. ROCs of logistic regression for separation between fibrous and transitional subtypes.
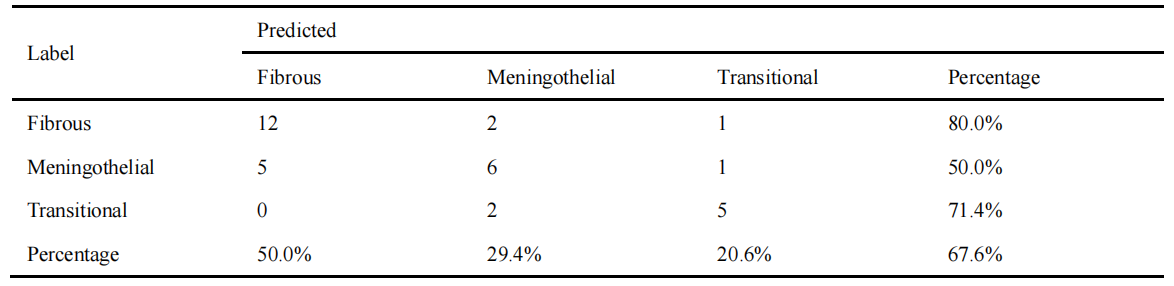
Table 1. Meningioma subtype classification