3693
7T MRSI-based k-means clustering of glioma1medical university of vienna, vienna, Austria
Synopsis
Keywords: Tumors (Pre-Treatment), Brain
Motivation: Preoperative glioma classification and management is still a challenge to be solved.
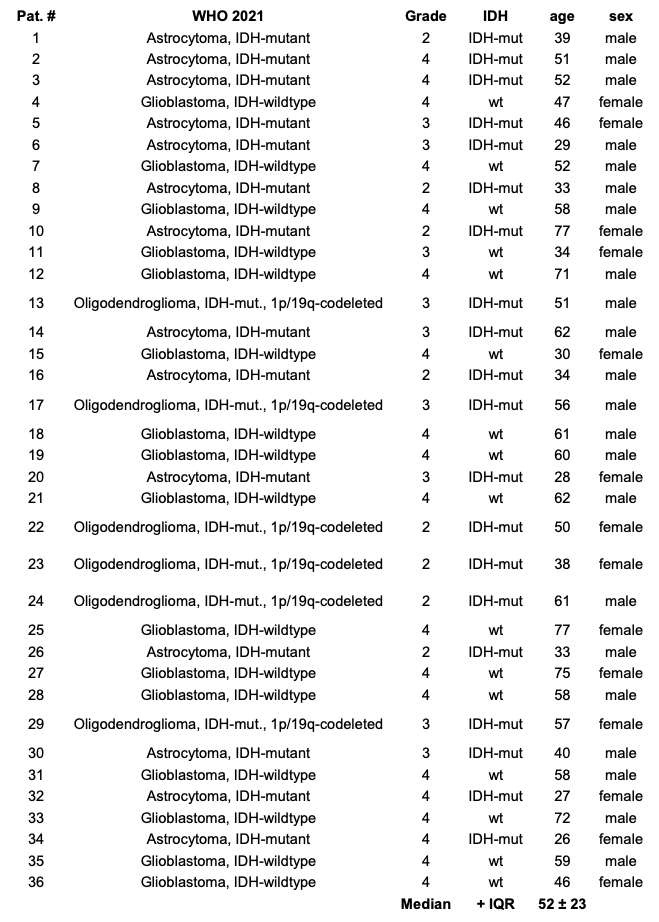
Goal(s): To enhance the understanding of glioma characteristics and potentially improve patient outcomes, we analyzed 7T Magnetic Resonance Spectroscopic Imaging (MRSI) data in 36 glioma patients.
Approach: Our approach focused on k-Means clustering of 60 metabolic ratios in the tumor to identify an overlap with the WHO 2021 diagnosis. Important metabolic ratios identified include Glu+Gln/tCho and Ins/tCr ratios, highlighting their biomarker significance.
Results: Our 7T MRSI can add metabolic profiles across the entire glioma and brain, possibly contributing to future glioma research.
Impact: We performed k-Means clustering of preoperative 7T MRSI metabolic ratios in 36 glioma patients. Correlation with histological WHO 2021 diagnosis was identified. With this approach, we could potentially enhance surgery planning and optimize glioma treatment and targeted drug monitoring.
Introduction
Gliomas represent a complex and heterogeneous group of brain tumors, necessitating advanced diagnostic techniques for accurate classification and treatment planning. The World Health Organization’s (WHO) 2021 update on the classification of tumors of the central nervous system introduced integrative diagnoses incorporating molecular parameters alongside histology, as a new standard for glioma characterization1. These can currently only be determined from tissue samples acquired during biopsy or resection. This study seeks to employ high-resolution 7T Magnetic Resonance Spectroscopic Imaging (MRSI) to evaluate non-invasive determination of glioma properties. Our purpose is to identify metabolic signatures that correlate with established clinical diagnostic groups that could lead to novel biomarkers for enhancing the precision of pre-operative tumor classification.Methods
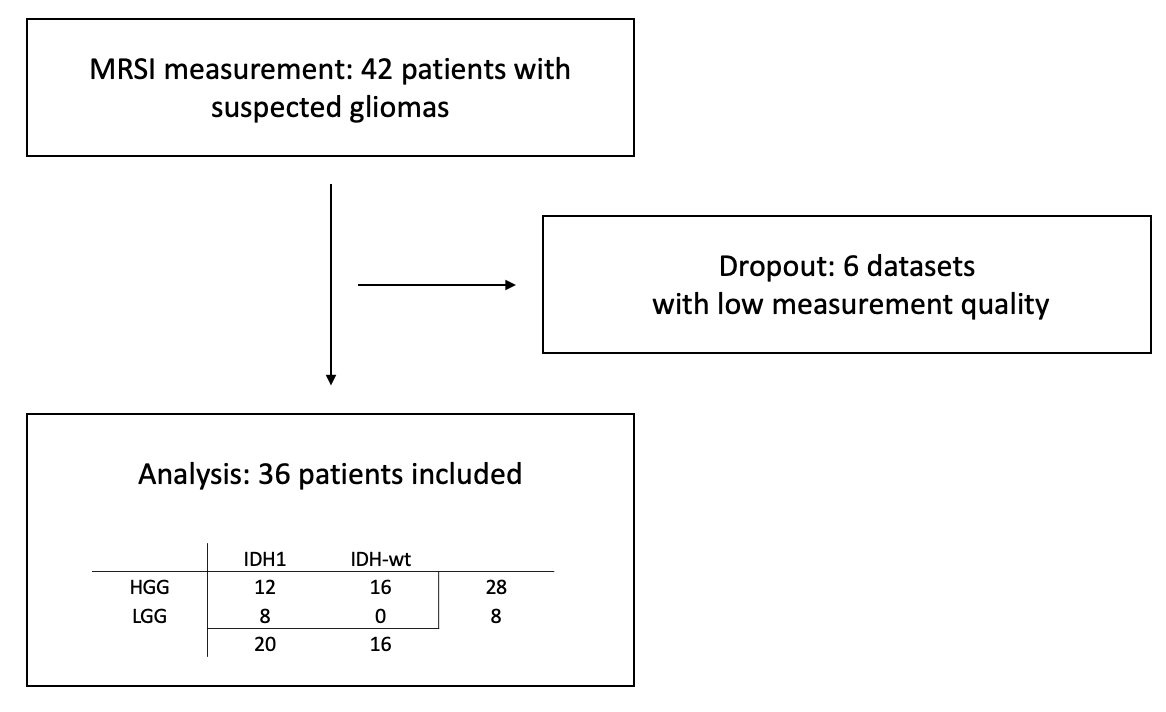
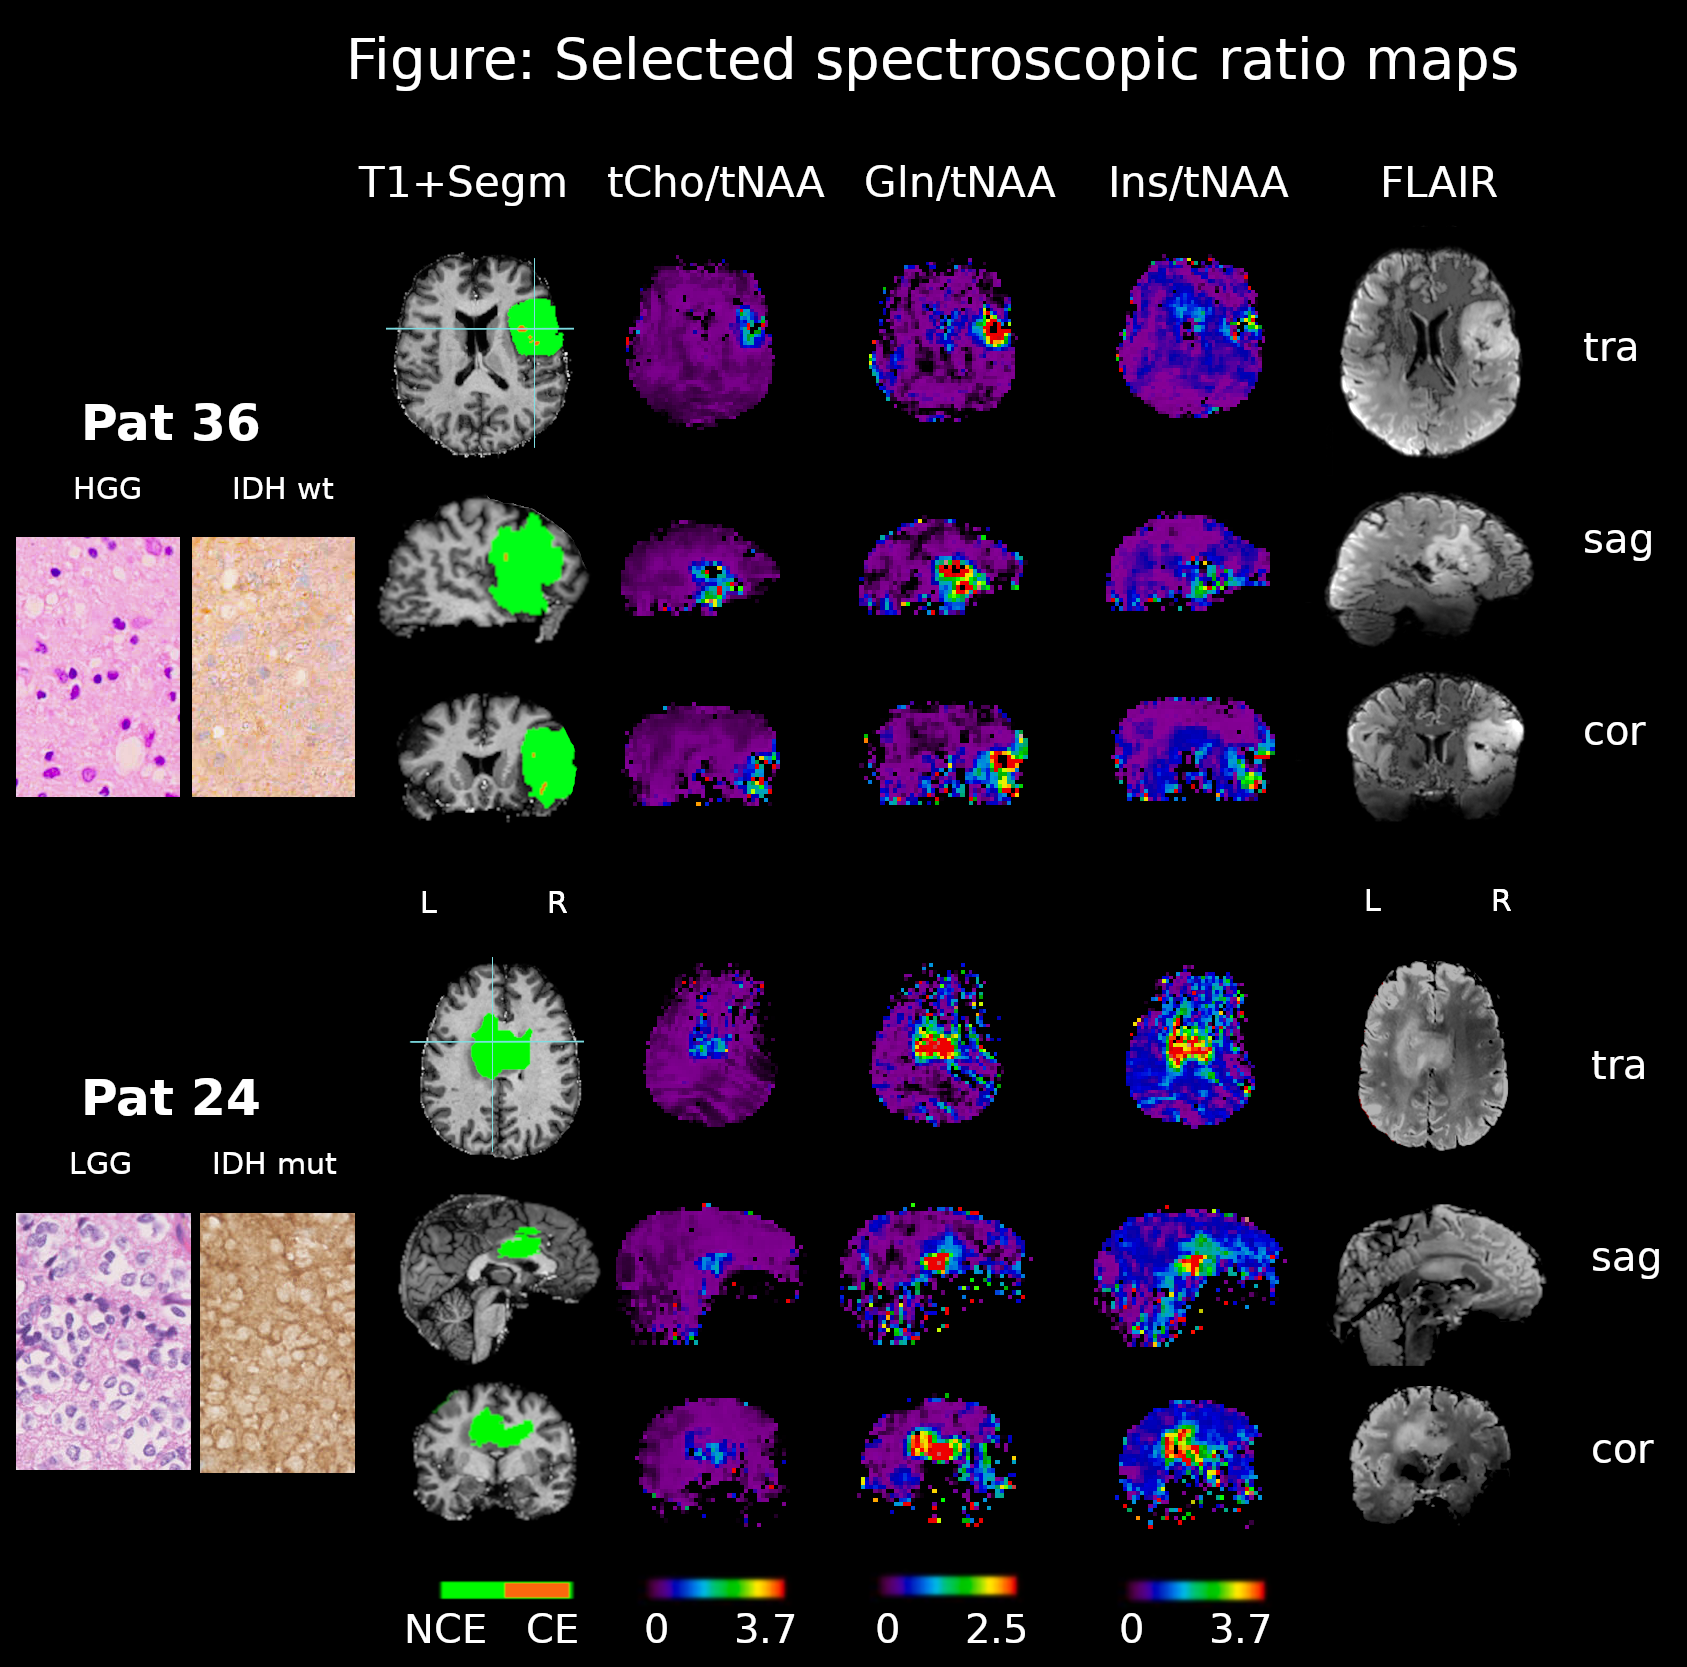
We recruited 42 patients with suspected glioma preoperatively for 64×64×39 resolution 7T MRSI scan3, 4. From the 7T MRSI spectra, median values in the tumor segmentation were calculated for 60 metabolic ratios, including Glu+Gln/tCho, Ins/tCr, Ser/tCho and Glu/tCho. We subjected these values to Principal Component Analysis (PCA) for dimensionality reduction. The k-means clustering algorithm was subsequently applied to the PCA-reduced data to define distinct metabolic clusters. The associations between these clusters and the WHO 2021 diagnostic groups were quantitatively evaluated using clustering evaluation metrics (including the Adjusted Rand Index, Normalized Mutual Information, and Fowlkes-Mallows Index) for assessment of the correlation between metabolic profiles and clinical diagnoses.Results
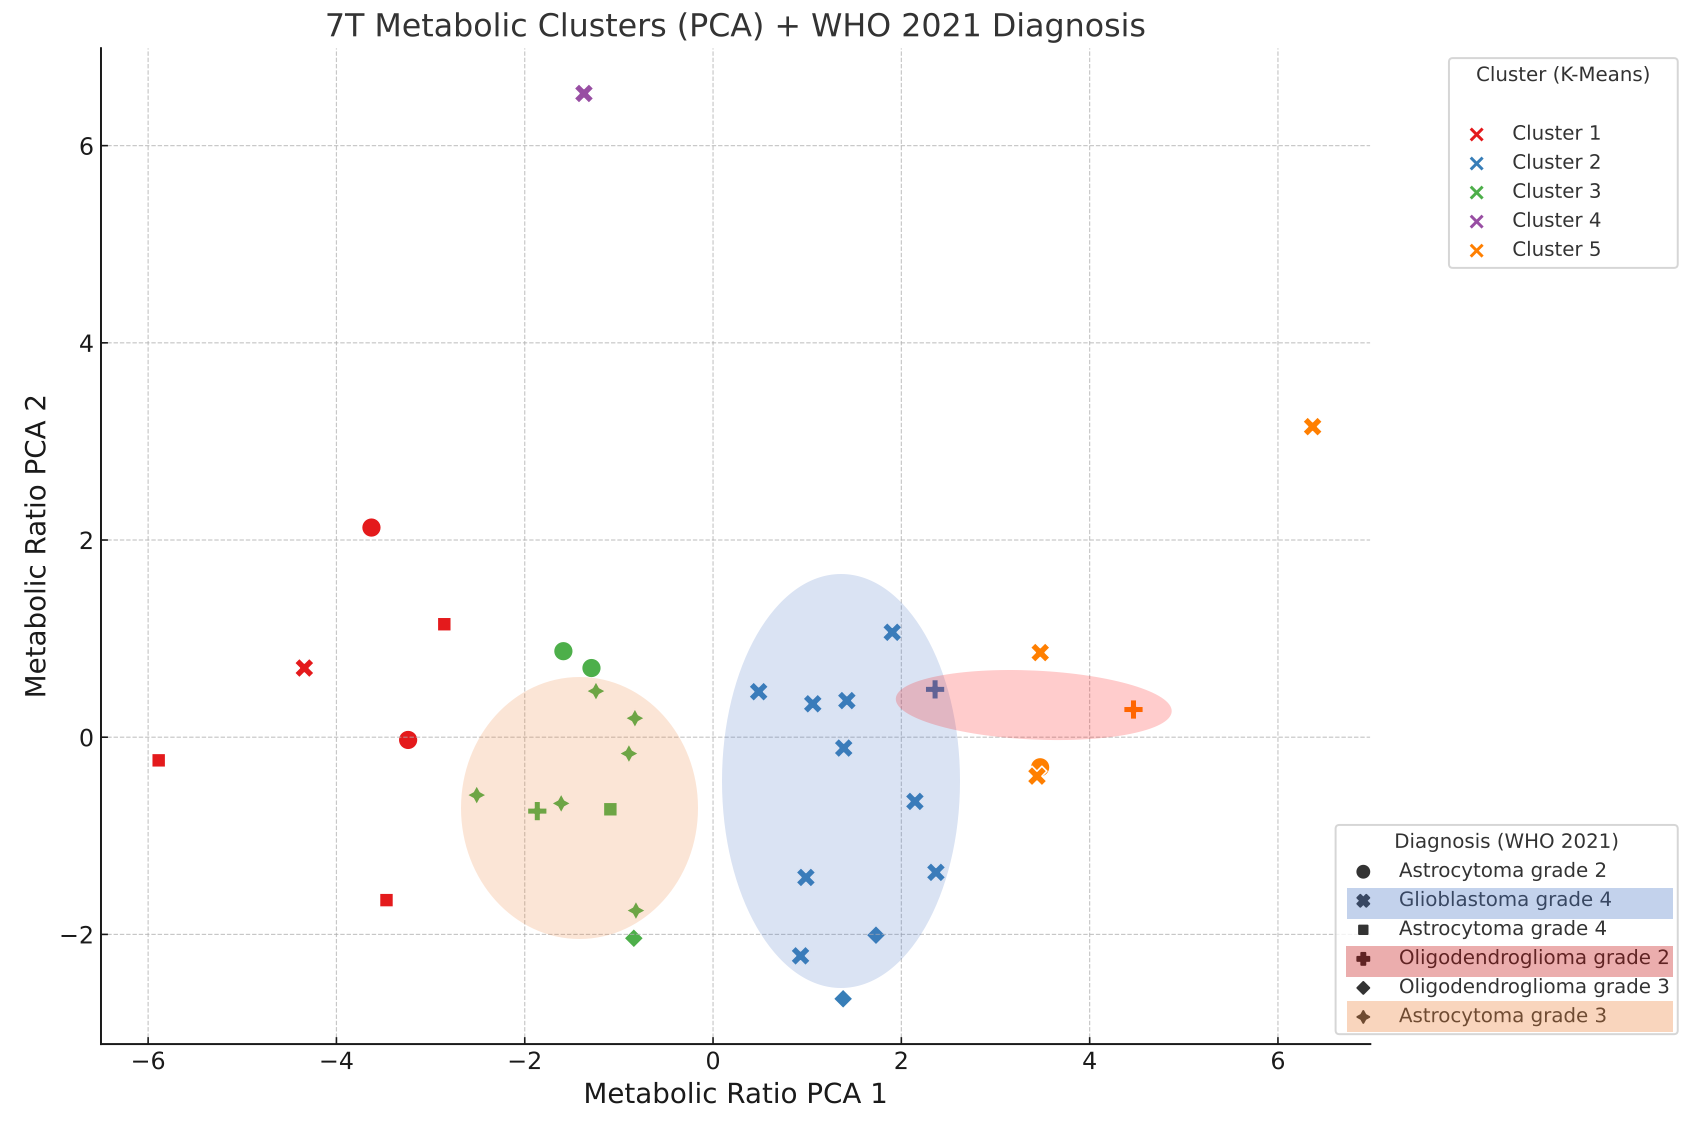
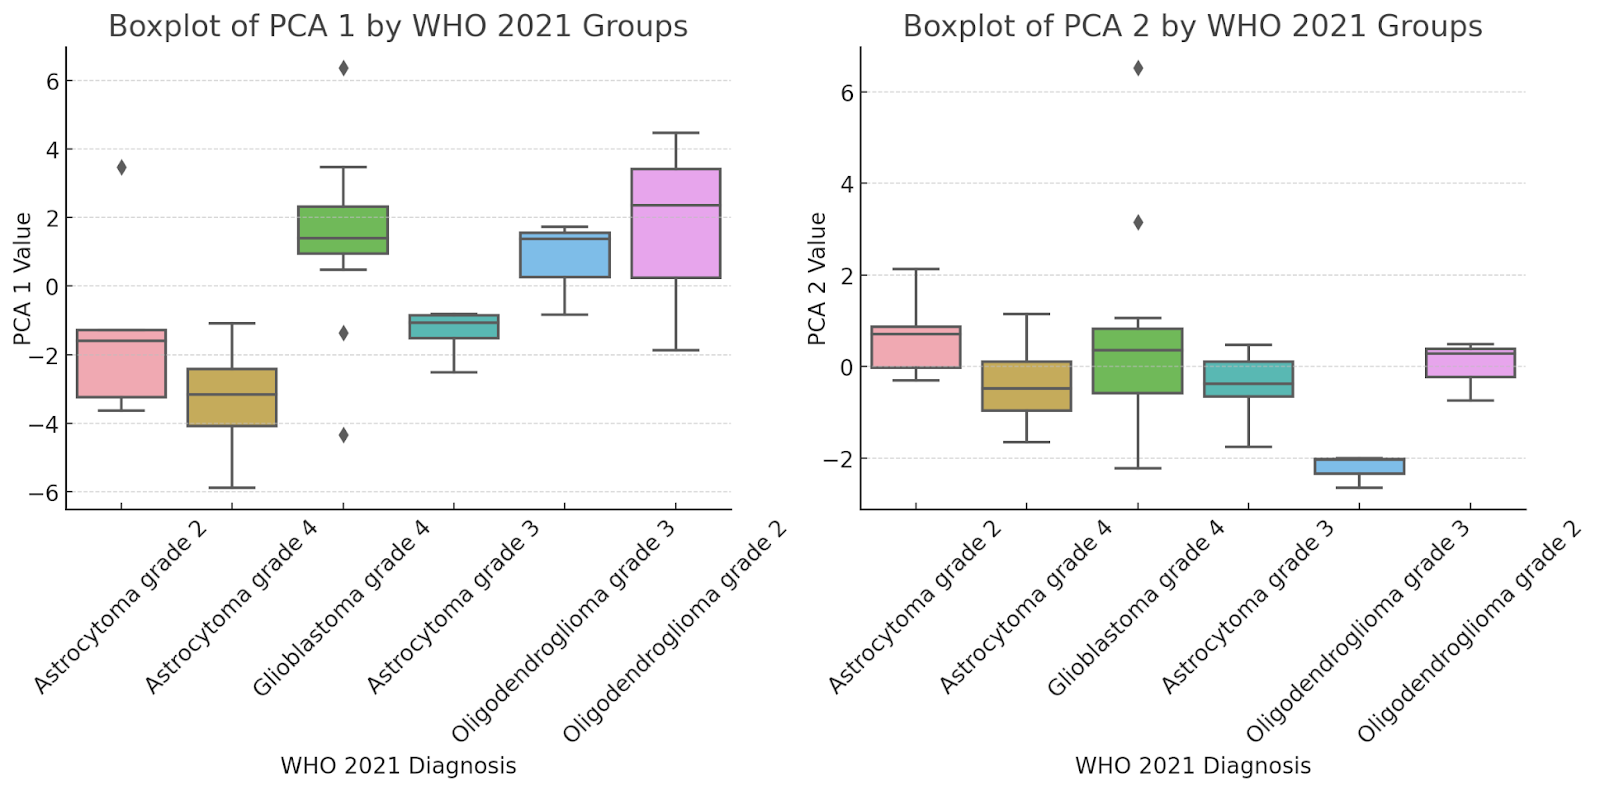
We had to exclude 6 of the 42 7T MRSI datasets, mostly due to poor spectral coverage in caudally located tumors. Crucial MRSI ratios included Glu+Gln/tCho, Ins/tCr, Ser / tCho, Glu/tCho, Glu+Gln/tCr. The K-Means clusters are plotted in Figure 3. Histologic verification of the clusters identified grade 4 glioblastomas mostly represented by metabolic cluster 2, whereas Astrocytoma grade 3 are all in cluster 3. PCA representation by the diagnostic groups is visualized in Figure 4, e.g. Astrocytoma grade 3 are clearly distinguished by PCA2 dominant cluster 3. Our analysis culminated in the identification of distinct metabolic clusters, demonstrating a moderate level of correlation with the WHO 2021 diagnostic groups. Evaluation metrics calculations yielded 0.27 for the adjusted Rand Index, 0.43 for Normalized Mutual Information, and Fowlkes-Mallows Index was 0.44.Discussion
Our clusters 2 and 3 clearly show an overlap with the histological glioma diagnosis. Ratios involving Glu, Gln, and other metabolites emerged as important biomarkers, echoing findings from comparable Single Voxel Spectroscopy (SVS) studies5,6. However, our approach ensures a more comprehensive metabolic and spatial characterization of gliomas. The alignment with existing literature, reinforces the validity of our approach and the relevance of these biomarkers in glioma research2,7,8. The variability within the metabolic signatures is reflected by the evaluation metrics, thus underscoring the complex nature of glioma. The integration of MRSI-based molecular parameters as clinical standard procedure could potentially enable advanced glioma classification, real-time treatment monitoring, identification of unique metabolic biomarkers, fostering personalized treatment strategies and improved surgical precision. Additionally, it could aid in predicting treatment outcomes, guiding the development of novel therapies, and assisting in minimizing treatment-related toxicity, collectively enhancing the efficacy and safety of glioma treatment. However, we emphasize the need for further research to refine metabolic profiling techniques and enhance their predictive accuracy.Conclusion
This study contributes to the ongoing efforts to improve glioma classification and patient outcomes through the integration of advanced imaging techniques and comprehensive metabolic profiling. However, the predictive model's potential is constrained by the limited cohort size, the use of pooled ROI values that may mask critical voxel-level variations, and the reliance on ratio values instead of absolute metabolite concentrations, all of which could lead to a loss of critical information and decreased generalizability of the findings. With access to a larger and more diverse dataset, as well as incorporating absolute metabolite concentrations and finer voxel-level information, we anticipate that the predictive model could achieve heightened accuracy and robustness, enabling more precise and personalized insights for clinical decision-making. By optimizing our models and thus harnessing the full potential of 7T MRSI in the future, we move closer to the realization of personalized medicine in neuro-oncology, ultimately aiming to improve patient prognosis and quality of life.Acknowledgements
This study was supported by the Austrian Science Fund (FWF) project KLI 1089. The financial support by the Austrian Federal Ministry for Digital and Economic Affairs, the National Foundation for Research, Technology and Development and the Christian Doppler Research Association is gratefully acknowledged.References
[1] Louis, D. N. et al. The 2021 WHO Classification of Tumors of the Central Nervous System: a summary. Neuro-Oncol. 23, 1231–1251 (2021)
[2] Han, S. et al. IDH mutation in glioma: molecular mechanisms and potential therapeutic targets. Br. J. Cancer 122, 1580–1589 (2020)
[3] Hangel, G. et al. High-resolution metabolic imaging of high-grade gliomas using 7T-CRT-FID-MRSI. NeuroImage Clin. 28, 102433 (2020)
[4] Hingerl, L. et al. Clinical High-Resolution 3D-MR Spectroscopic Imaging of the Human Brain at 7 T: Invest. Radiol. 55, 239–248 (2020)
[5] Považan, M. et al. Mapping of brain macromolecules and their use for spectral processing of 1 H-MRSI data with an ultra-short acquisition delay at 7 T. NeuroImage 121, 126–135 (2015)
[6] Provencher, S. W. Automatic quantitation of localized in vivo 1H spectra with LCModel. NMR Biomed. 14, 260–264 (2001)
[7] Ozturk‐Isik, E. et al. Identification of IDH and TERTp mutation status using 1 H‐MRS in 112 hemispheric diffuse gliomas. J. Magn. Reson. Imaging 51, 1799–1809 (2020)
[8] Zhu, W., et al. Cuprotosis clusters predict prognosis and immunotherapy response in low-grade glioma. Apoptosis : an international journal on programmed cell death, 10.1007/s10495-023-01880-y (2023)
Figures