3691
Detection of Pathological Functional Connectome in Brains with Low-grade Gliomas Using Graph Convolutional Network1Shenzhen Institute of Advanced Technology, Chinese Academy of Sciences, Shenzhen, China, 2University of Chinese Academy of Science, Beijing, China, 3Huashan Hospital of Fudan University, Shanghai, China, 4Shenzhen Second People’s Hospital, Shenzhen, China
Synopsis
Keywords: Tumors (Pre-Treatment), Brain Connectivity
Motivation: Alterations in the functional connectome may serve as new biomarkers to infer the disease profile of glioma.
Goal(s): To detect the pathological functional connectome (Patho-FCN) that characterizes the functional plasticity due to low grade glioma.
Approach: Dynamic functional connectivity-based graph convolutional network (dFC-GCN) models were constructed to distinguish patients from healthy controls. Class activation mapping was utilized to identify the top 5% salient nodes constituting the Patho-FCN, where the information flow was assessed using the time-delay and probabilistic flow estimation.
Results: The dFC-GCN model identified a contralesional Patho-FCN with altered information propagation patterns, and achieved an averaged classification accuracy of 96.1%.
Impact: The pathological functional connectome detected with the proposed methodology in this study provides a novel biomarker to characterize cerebral glioma. Theranostic scheme targeting pathological connectome may innovate the management of glioma.
Introduction
Cerebral glioma leads to alterations in the widespread functional networks rather than isolated connections. The introduction of artificial intelligence models facilitate detecting network biomarkers for individualized prediction of tumor progression or disease phenotype. However, it fails to characterize the inherent non-Euclidean graph structure of the networks. Graph convolutional network (GCN) provides an alternative solution for this task 1. In this study, we aim to detect the pathological functional connectome (Patho-FCN) in brains with low-grade gliomas (LGG) using a dynamic functional connectivity-based GCN (dFC-GCN) model, and estimate the probabilistic information flow using the time-delay (TD) and probabilistic flow (PF) estimation 2.Participants and Methods
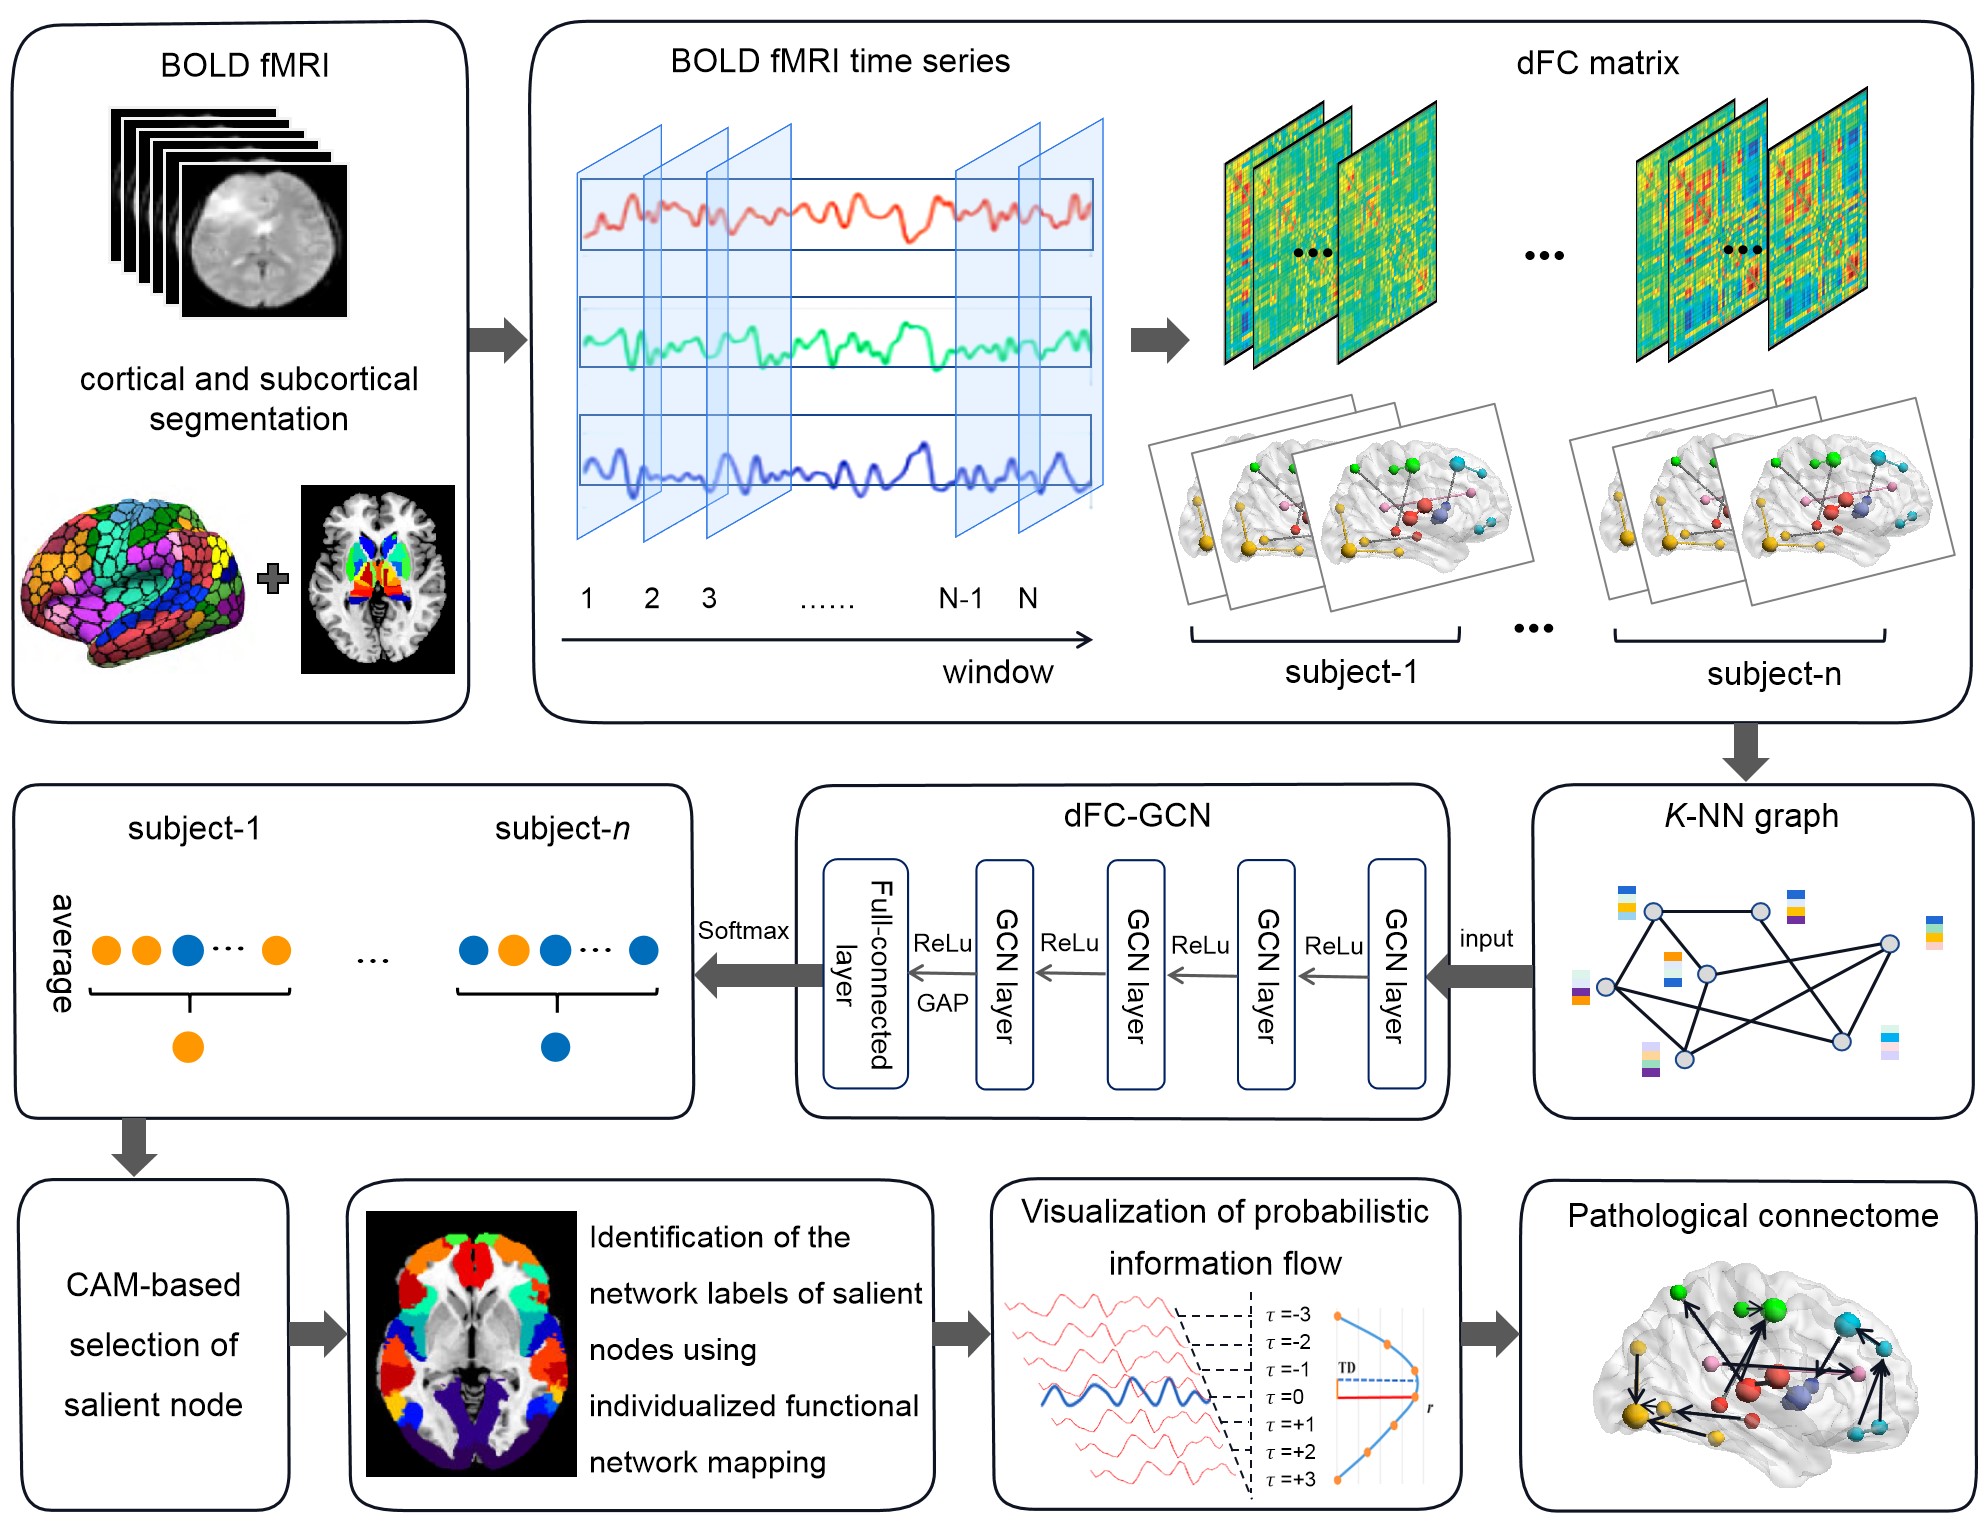
This study was approved by the local institutional review board. Informed consent was collected from each patient prior to the MRI examination. A total of 51 subjects with histologically confirmed left frontal LGG were consecutively recruited (26 females, aged 36 ± 11 years). rs-fMRI data was acquired using gradient echo-planar imaging sequence with a 12-channel phased array head coil (3.0T, Siemens Verio, Germany) and the following parameters: TR/TE 2000/30 ms, FOV 210 mm × 210 mm, acquisition matrix 64 × 64, 33 slices with a thickness of 4.0 mm, 240 volumes. rs-fMRI data of 50 healthy subjects (26 females, aged 40 ± 13 years) were obtained as controls (HC) from the 1000 Functional Connectomes Project. The rs-fMRI data were preprocessed according to the established pipeline 3.The spatially normalized brains were segmented into 1000 cortical parcels and 36 subcortical nuclei. Sliding-window approach (window size of 50 TRs and sliding step of 1 TR) in conjunction with Pearson’s correlation analysis was utilized to construct the dFC matrices that were converted into K-NN graphs and then input to the GCN classification model. The stratified 5-fold cross-validation was applied to split the participants into training and test sets without shuffling the FC matrices of the same participant. Different K values and numbers of input graphs per participant were set to assess their potential effects on the model performance. The predictive labels of participants were ultimately determined based on the average of their corresponding graphs’ labels. Class activation mapping (CAM) was utilized to identify the top 5% salient nodes constituting the Patho-FCN. The salient nodes in cerebral cortex were categorized into 17 functional networks or a tumor network at the individual level using a personalized functional network mapping strategy 4. The BOLD time series of nodes belonging to a same network were averaged. Then, TD and PF estimation were performed based on time-lagged FCs at the network level to visualize the propagation pattern of the intrinsic brain activity (iBA) within the Patho-FCN. The overview of the detection of pathological connectome using the dFC-GCN model is shown in Figure 1.
Results
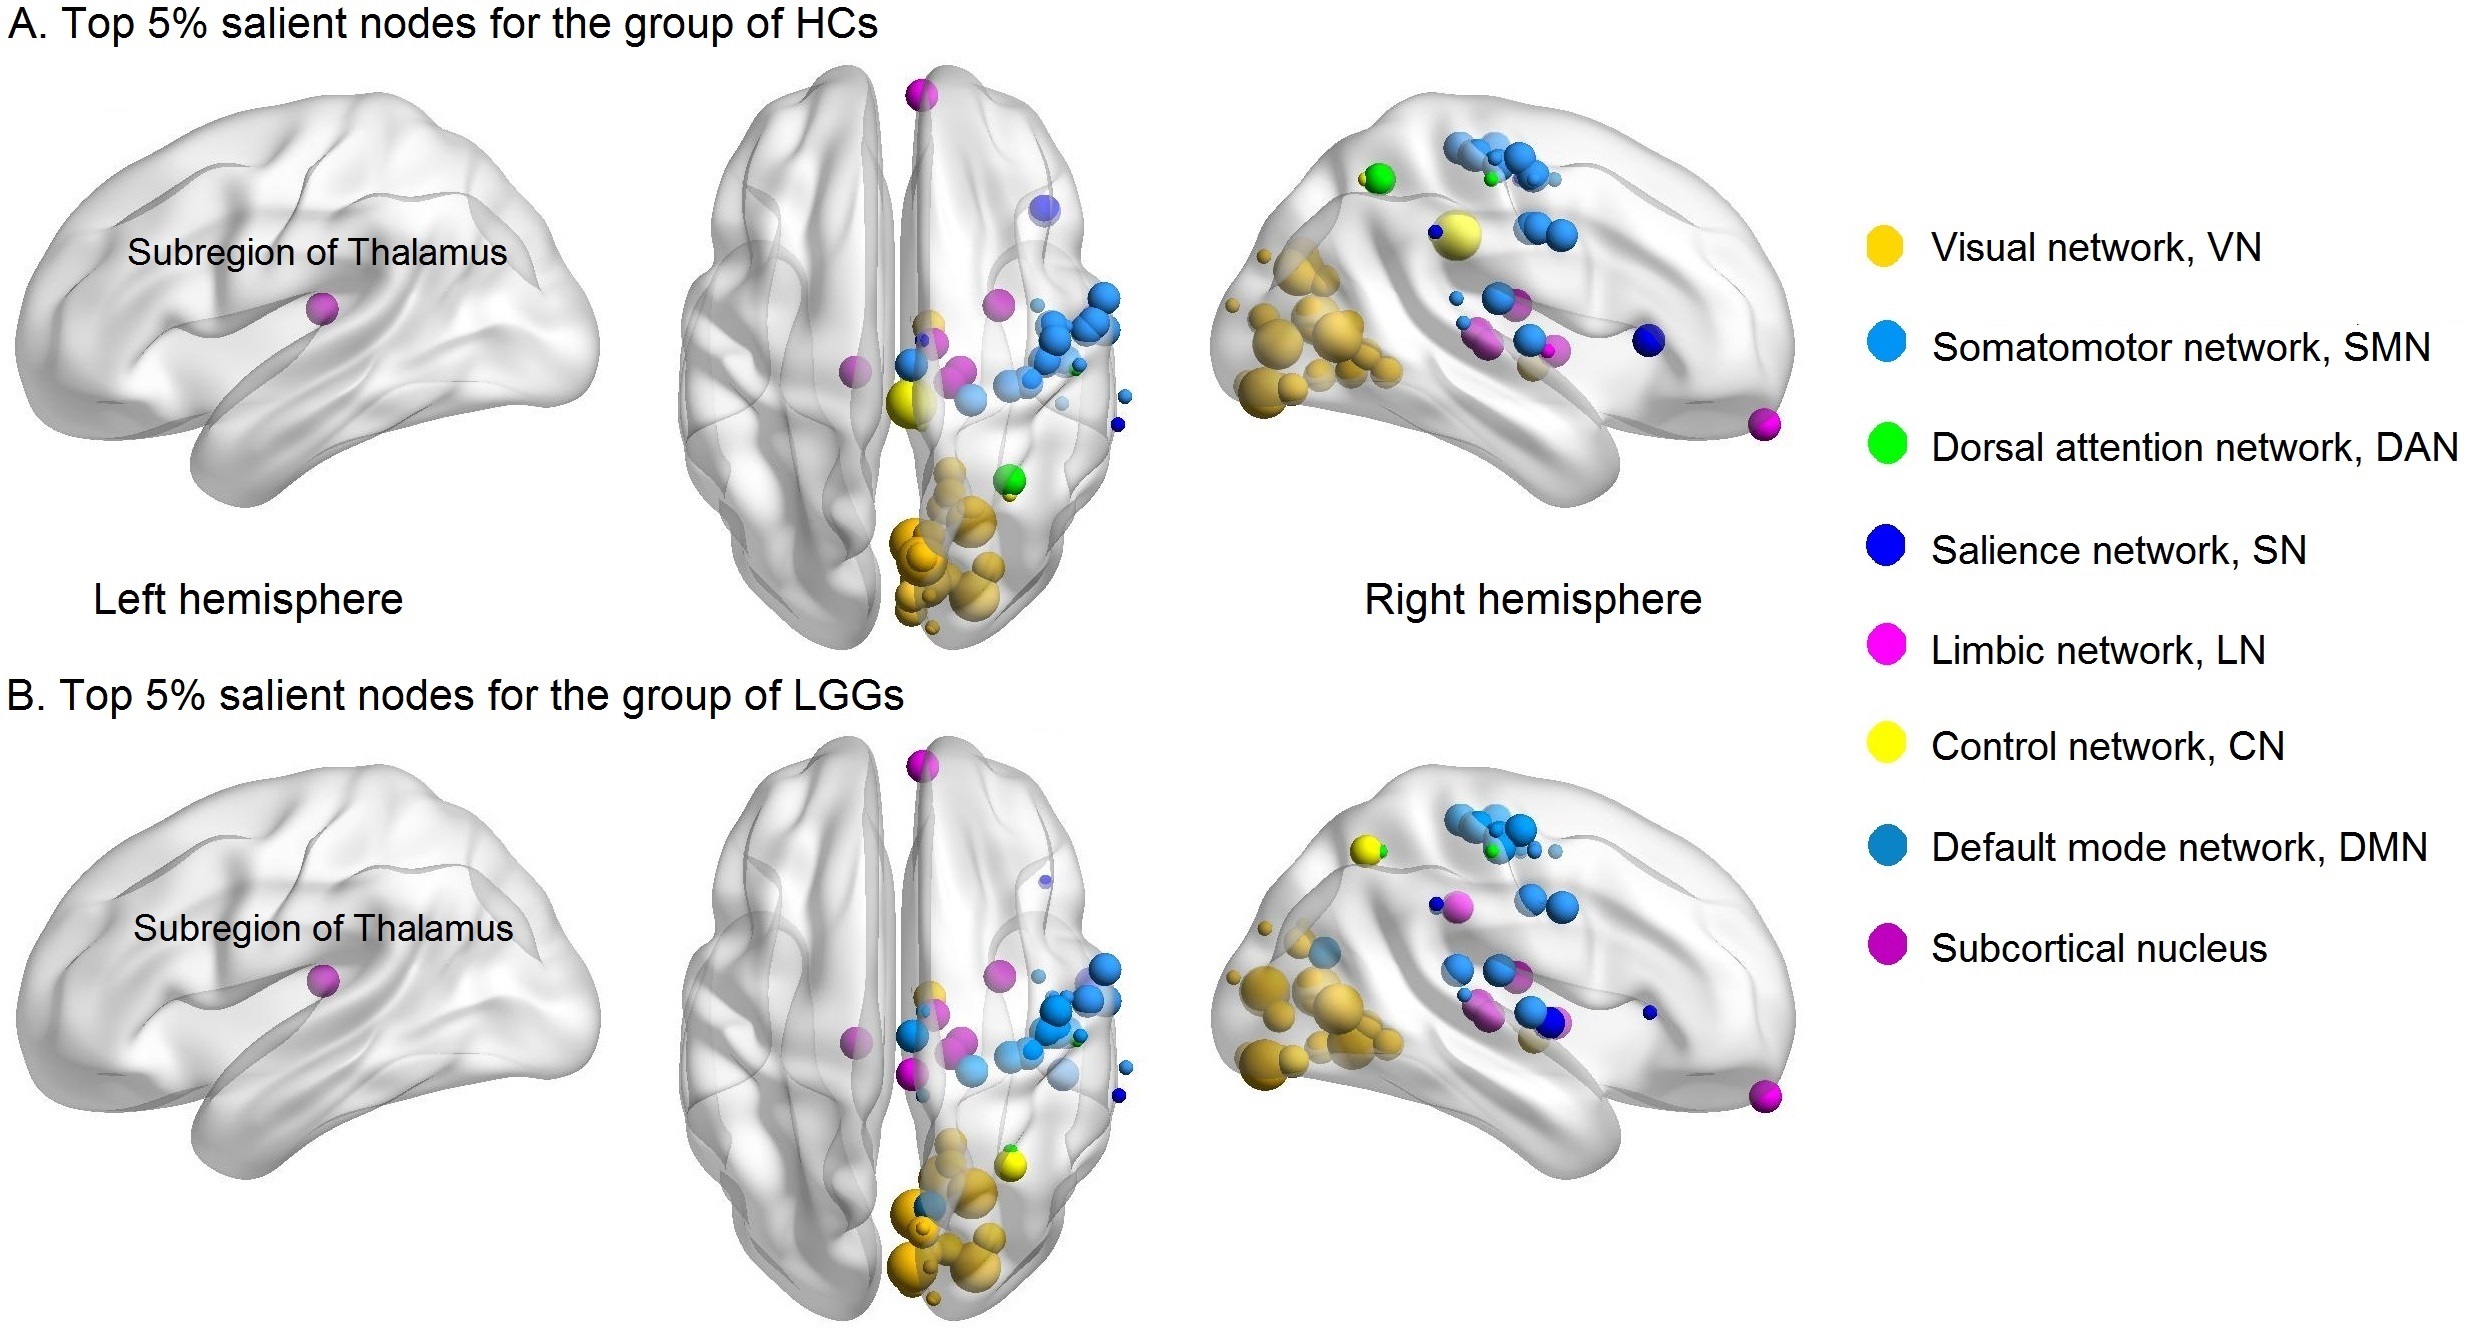
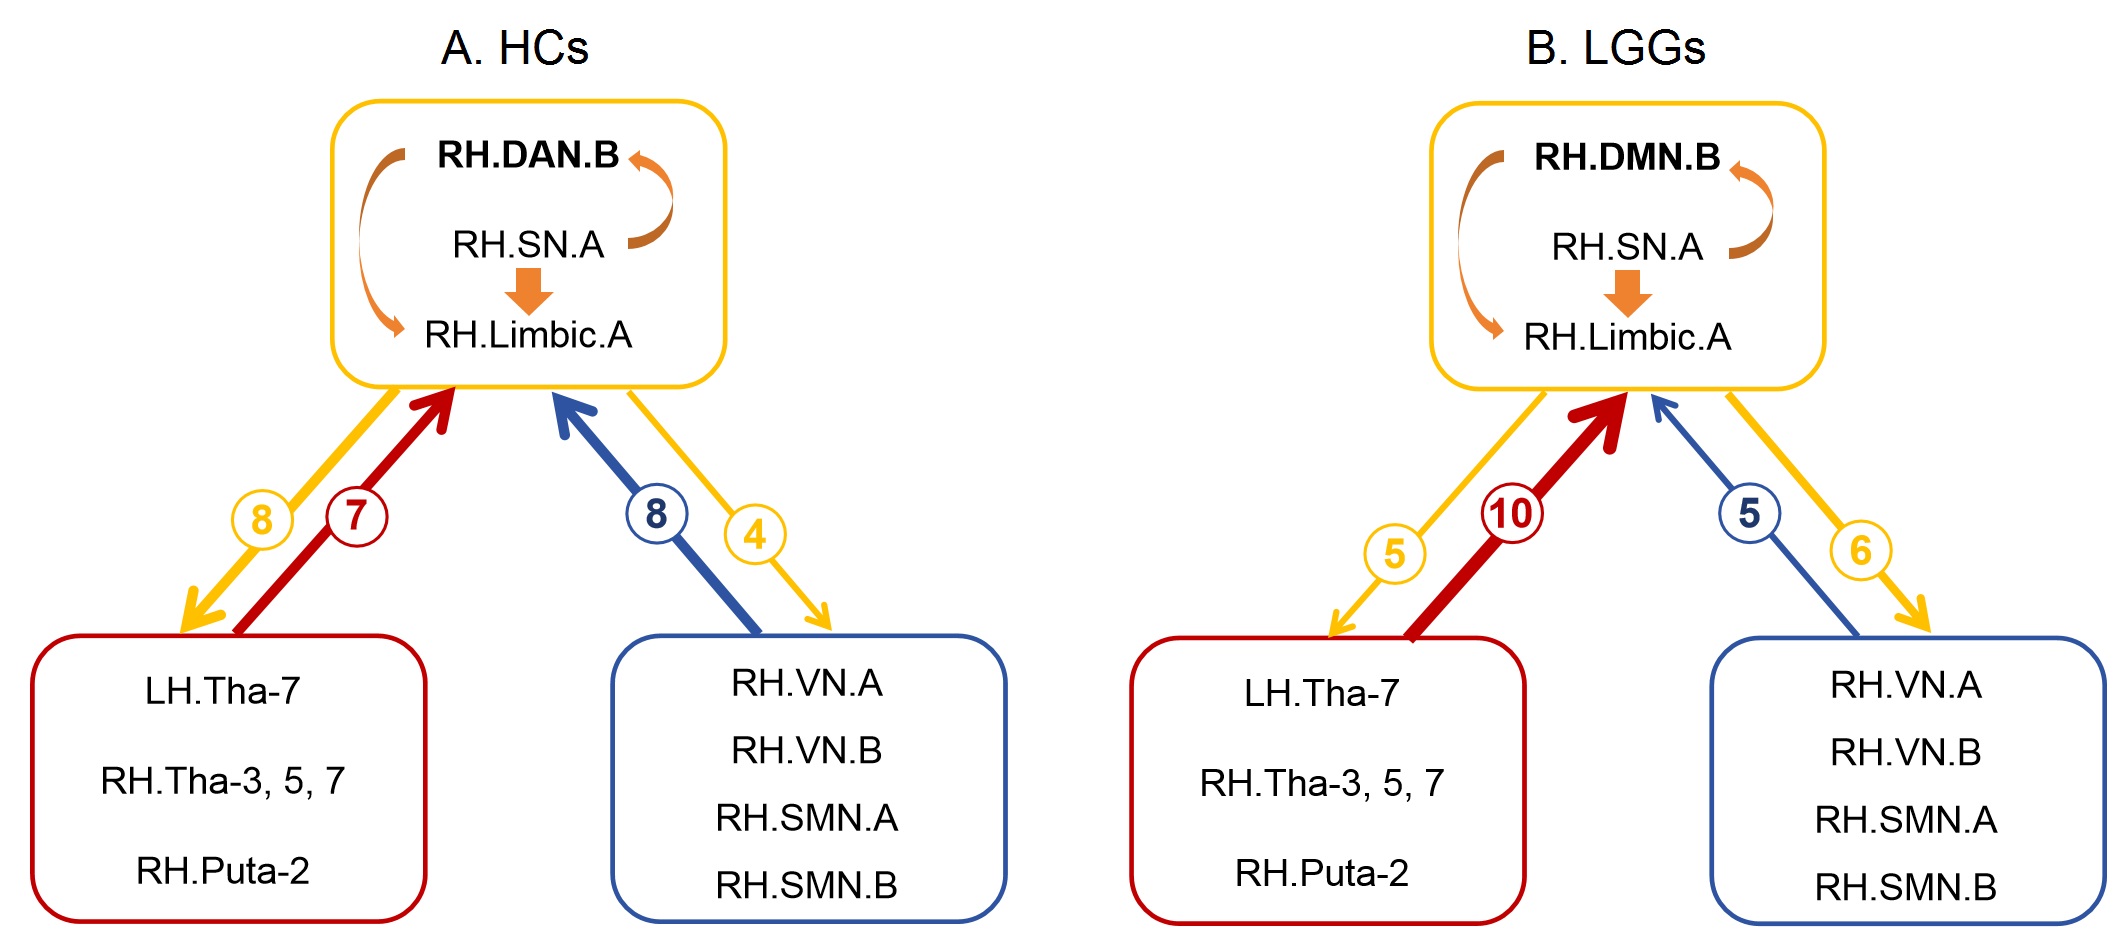
The dFC-GCN models achieved the best classification performance with the K value of 12 and 70 K-NN graphs of each participant as input (accuracy 96.1 ± 3.7%, sensitivity 94.2 ± 4.8%, specificity 98.0 ± 4.0%). The top 5% salient regions contributing to the HC-LGG classification were mainly located in the contralesional hemisphere and categorized into three functional modules (Fig. 2): primary cortices involving the visual (VN) and SomatoMotor networks (SMN), high-order cognitive cortices involving limbic (LN),default mode (DMN), and dorsal/ventral attention networks (DAN and VAN), and the subcortical module involving the subregions of putamen and thalamus. The LGG brains featured an amplified intra-module heterogeneity of the PF patterns, predominant iBA propagation from subcortical module to the high-order cognitive module, and a weakened transmission from the primary cortex to high-order cognitive cortex (Fig. 3).Discussion
The Patho-FCN characterizing LGG mainly involved the contralesional cortical and subcortical regions, emphasizing the importance of non-tumoral hemisphere in the functional plasticity. This is in consistence with previous studies 5. LGGs lead to adjustments in the iBA propagation across different functional modules, suggesting a generalized importance of iBA in signifying functional remodeling of the brain and disease dynamic of glioma. Since iBA propagation is sensitive to physiological and pathological events 6, theronostic framework accounting for iBA may provide additional references for the assessment of therapeutic response of glioma.Conclusions
The GCN model in combination with dFC features identified a Patho-FCN with altered iBA propagation patterns in brains with left frontal LGG. The detection strategy of Patho-FCN proposed in this study lays the theoretical foundation for the development of a novel theranostic scheme targeting brain networks.Acknowledgements
This work was partially supported by the NSFC (92159101); National Key Research and Development Program of China (2022YFC2406903), and the Key Laboratory for Magnetic Resonance and Multimodality Imaging of Guangdong Province (2023B1212060052).References
1. Lei D, Qin K, Pinaya WHL, et al. Graph Convolutional Networks Reveal Network-Level Functional Dysconnectivity in Schizophrenia. Schizophrenia Bulletin. 2022, 48(4): 881-892.
2. Cao B, Guo Y, Guo Y, et al. Time-delay structure predicts clinical scores for patients with disorders of consciousness using resting-state fMRI. Neuroimage Clin. 2021;32:102797.
3. Cai S, Shi Z, Jiang C, et al. Hemisphere-Specific Functional Remodeling and Its Relevance to Tumor Malignancy of Cerebral Glioma Based on Resting-State Functional Network Analysis. Front. Neurosci. 2021;14:611075.
4. Cui W, Wang Y, Ren J, et al. Personalized fMRI Delineates Functional Regions Preserved within Brain Tumors. Annals of Neurology. 2022; 91(3):353-366.
5. De Baene W, Rutten GM, Sitskoorn MM. Cognitive functioning in glioma patients is related to functional connectivity measures of the non-tumoural hemisphere. Eur J Neurosci. 2019; 50(12): 3921-3933.
6. Mitra A, Raichle ME, Geoly AD, et al. Targeted neurostimulation reverses a spatiotemporal biomarker of treatment-resistant depression. PNAS. 2023; 120(21): e2218958120.
Figures