3690
Identifying IDH Mutation Status in Gliomas Using Susceptibility Weighted Imaging and Explainable AI1Institute of Biomedical Engineering, Bogazici University, Istanbul, Turkey, 2Department of Radiology, Basaksehir Cam and Sakura City Hospital, Istanbul, Turkey, 3Department of Medical Pathology, Acibadem University, Istanbul, Turkey, 4Center for Neuroradiological Applications and Reseach, Acibadem University, Istanbul, Turkey, 5Electric and Electronic Engineering Department, Bogazici University, Istanbul, Turkey, 6Department of Neurosurgery, Acibadem University, Istanbul, Turkey, 7Department of Radiology, Acibadem University, Istanbul, Turkey
Synopsis
Keywords: Tumors (Pre-Treatment), Machine Learning/Artificial Intelligence
Motivation: There is a need for preoperative identification of isocitrate dehydrogenase (IDH) mutation in gliomas, currently reliant on invasive procedures.
Goal(s): Identify IDH mutation status using susceptibility weighted MRI (SWI) and explainable artificial intelligence.
Approach: The SWI signal drop areas within the tumor region were compared between 98 IDH-mutant (IDH-mut) and 91 IDH wild-type (IDH-wt) gliomas using a convolutional neural network (CNN) and gradient-weighted class activation map (Grad-CAM).
Results: IDH-wt gliomas had larger SWI signal drop areas than IDH-mut. CNN resulted in an area under curve (AUC) of 0.84±0.05 for classification, and Grad-CAM highlighted the signal dropout areas.
Impact: IDH-wt gliomas had higher neovascularization on SWI than IDH-mut gliomas, potentially linked to their more aggressive nature. Grad-CAM highlighted dark areas on SWI, and a CNN architecture classified the IDH mutational subgroups with an AUC of 0.84.
Introduction
Gliomas, the most common primary malignant brain tumors, are classified based on both their microscopic appearance and molecular characteristics, with molecular traits becoming increasingly important in predicting patient outcomes1. Mutations in the isocitrate dehydrogenase (IDH) gene stand out among molecular features and are often associated with better prognoses2-5. Detecting IDH mutations typically involves invasive procedures, which carry risks and may provide inaccurate results, and there is a need for non-invasive methods to predict IDH mutation status before surgery. Susceptibility weighted MRI (SWI), shows promise as a non-invasive approach to identify IDH status6. SWI highlights substances like blood products, iron deposits, and calcifications as dark areas7. SWI has demonstrated potential in differentiating between high-grade and low-grade gliomas8. This study aims to predict IDH mutation status in gliomas by analyzing SWI using a convolutional neural network (CNN) architecture.Material-Methods
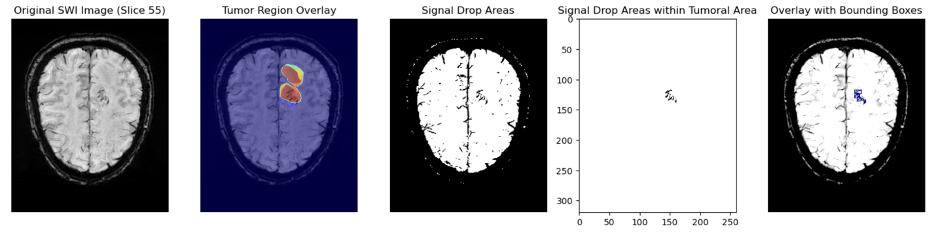
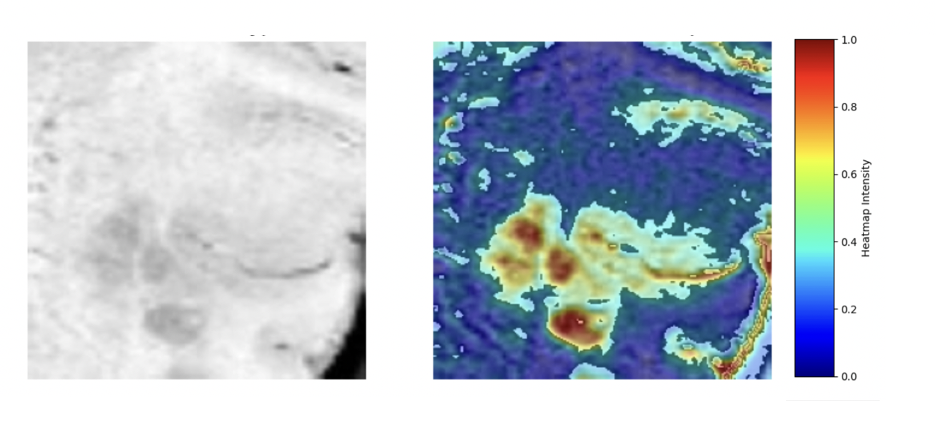
The patient cohort included 189 adult gliomas (111M/78F, 91 IDH-wt and 98 IDH-mut), who had undergone preoperative MRI scans. After surgery, tumor samples were processed for DNA extraction and sequencing to determine the IDH mutation status. The MRI protocol included T2-weighted MRI (T2WI) (TR/TE=6.5/3.4 ms, FOV = 256 mm, slice thickness = 2.5 mm) and SWI (TR/TE=28/20 ms, FOV=220 mm, slice thickness=1.6 mm) scans conducted on a 3T clinical MR scanner (Siemens, Germany). Tumor volumes were segmented on T2WI using Slicer v4.8.1 (http://slicer.org/). Before further analysis, bias correction was applied to eliminate non-uniformities in the SWI9. T2WI were then registered onto high-resolution SWI. The transformation matrix from this registration process was applied to align the segmentation masks with the SWI images using Advanced Normalization Tools (http://stnava.github.io/ANTs/). Then, z-score normalization was applied on SWI images. Afterwards, the areas with a significant signal drop-out within the tumor regions were determined by thresholding the SWI volumes. The total signal drop area within the tumor region was calculated and normalized by the total number of pixels within the tumor region (Figure 1). A Mann-Whitney U test was performed to compare the normalized signal drop areas between the IDH mutant (IDH-mut) and wild-type (IDH-wt) groups. Subsequently, the slice containing the largest signal drop area was resized to 224x224 to create input images for a custom CNN architecture. Data augmentation techniques were applied to increase the size of the training dataset. Additionally, the hyperparameters of the CNN architecture including the number of layers, units, dropout rates, and learning rate were optimized10. Receiver operating characteristic (ROC) curves were generated to assess the binary classification performance. Furthermore, gradient-weighted class activation map (Grad-CAM) was employed to generate heat maps providing insights into the regions of interest for the decision making of CNN.Results
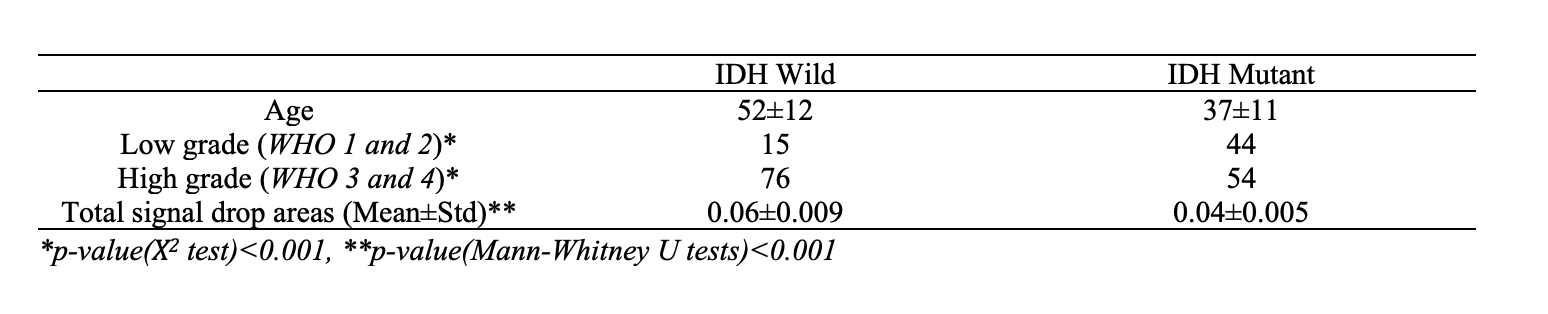
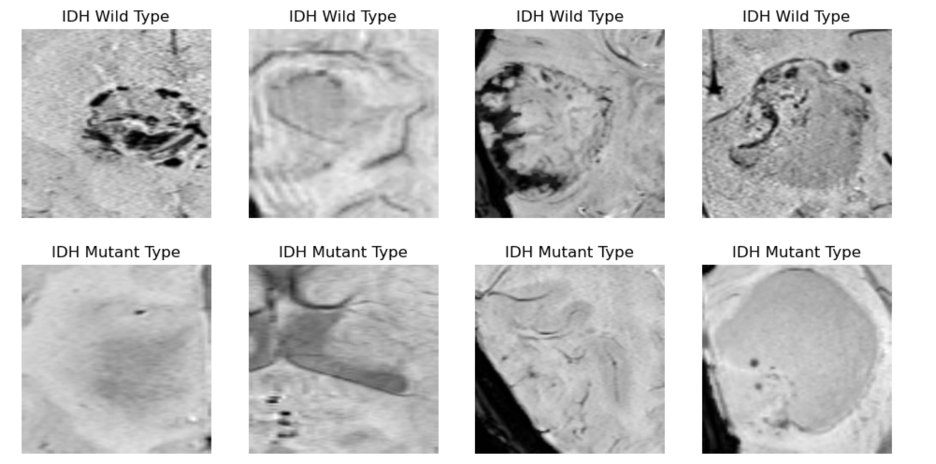
The mean ages were 37±11 years for IDH-mut and 52±12 years for IDH-wt gliomas (Table 1). IDH-wt group had a higher proportion of high-grade (Grades 3 and 4) tumors than the IDH-mut group (p<0.001). Figure 2 shows example SWI images of DH-wt and IDH-mut gliomas. The total signal drop area was larger in the IDH-wt group (0.06±0.009) than the IDH-mut group (0.04±0.005) (p<0.001). The CNN architecture was able to differentiate IDH-mut and IDH-wt groups based on SWI with an area under curve of 0.84±0.05 (accuracy=0.75, sensitivity=0.82, specificity=0.71). The Grad-CAM highlighted the dark areas on SWI (Figure 3).Discussion-Conclusion
Our study demonstrated that SWI signal drop area was larger in the IDH-wt gliomas than the IDH-mut gliomas. SWI is extremely sensitive to detecting neovascularization and calcification6. The observed differences in signal drop areas in this study may be attributed to the aggressive nature of IDH-wt gliomas11. Our findings align with previous research showing variations in small blood vessels and hemorrhage among gliomas, with higher-grade tumors demonstrating a greater abundance of small blood vessels and hemorrhage12.Acknowledgements
This study was supported by TUBITAK 1003 grant 216S432.References
1 Louis, D. N. et al. The 2021 WHO Classification of Tumors of the Central Nervous System: a summary. Neuro Oncol 23, 1231-1251, doi:10.1093/neuonc/noab106 (2021).
2 Yan, H. et al. IDH1 and IDH2 mutations in gliomas. N Engl J Med 360, 765-773, doi:10.1056/NEJMoa0808710 (2009).
3 Jiao, Y. et al. Frequent ATRX, CIC, FUBP1 and IDH1 mutations refine the classification of malignant gliomas. Oncotarget 3, 709-722, doi:10.18632/oncotarget.588 (2012).
4 Ostrom, Q. T. et al. CBTRUS Statistical Report: Primary Brain and Central Nervous System Tumors Diagnosed in the United States in 2008-2012. Neuro-Oncology 17, iv1-iv62, doi:10.1093/neuonc/nov189 (2015).
5 Nobusawa, S., Watanabe, T., Kleihues, P. & Ohgaki, H. IDH1 mutations as molecular signature and predictive factor of secondary glioblastomas. Clin Cancer Res 15, 6002-6007, doi:10.1158/1078-0432.Ccr-09-0715 (2009).
6 Kong, L. W. et al. Intratumoral Susceptibility Signals Reflect Biomarker Status in Gliomas. Sci Rep 9, 17080, doi:10.1038/s41598-019-53629-w (2019).
7 Haller, S., Haacke, E. M., Thurnher, M. M. & Barkhof, F. Susceptibility-weighted Imaging: Technical Essentials and Clinical Neurologic Applications. Radiology 299, 3-26, doi:10.1148/radiol.2021203071 (2021).
8 Park, M. J. et al. Semiquantitative assessment of intratumoral susceptibility signals using non-contrast-enhanced high-field high-resolution susceptibility-weighted imaging in patients with gliomas: comparison with MR perfusion imaging. AJNR Am J Neuroradiol 30, 1402-1408, doi:10.3174/ajnr.A1593 (2009).
9 Nguyen, A. A. et al. Post-Processing Bias Field Inhomogeneity Correction for Assessing Background Parenchymal Enhancement on Breast MRI as a Quantitative Marker of Treatment Response. Tomography 8, 891-904, doi:10.3390/tomography8020072 (2022).
10 O'Malley, T. a. B., Elie and Long, James and Chollet, Francois and Jin, Haifeng and Invernizzi, Luca and others. KerasTuner, <https://github.com/keras-team/keras-tuner> (2019).
11 Eckel-Passow, J. E. et al. Glioma Groups Based on 1p/19q, IDH, and TERT Promoter Mutations in Tumors. N Engl J Med 372, 2499-2508, doi:10.1056/NEJMoa1407279 (2015).
12 Li, X. et al. Glioma grading by microvascular permeability parameters derived from dynamic contrast-enhanced MRI and intratumoral susceptibility signal on susceptibility weighted imaging. Cancer Imaging 15, 4, doi:10.1186/s40644-015-0039-z (2015).
Figures