3689
Relationship between QSM, R2*, and a polygenic risk score for unusual and psychotic experiences1Department of Electrical Engineering, Pontificia Universidad Catolica de Chile, Santiago de Chile, Chile, 2Biomedical Engineering, Faculty of Engineering, Universidad de Santiago de Chile, Santiago de Chile, Chile, 3Biomedical Imaging Center, Pontificia Universidad Catolica de Chile, Santiago de Chile, Chile, 4Millennium Institute for Intelligent Healthcare Engineering, Santiago de Chile, Chile, 5Center for Genetics and Genomics, Clinica Alemana Universidad del Desarrollo, Santiago de Chile, Chile, 6Center for Genomics and Bioinformatics, Universidad Mayor, Santiago de Chile, Chile, 7Rare Diseases Program, School of Medicine, Santiago de Chile, Chile, 8School of Electrical Engineering, Pontificia Universidad Catolica de Valparaiso, Valparaiso, Chile, 9Department of Psychiatry, School of Medicine, Pontificia Universidad Catolica de Chile, Santiago de Chile, Chile
Synopsis
Keywords: Electromagnetic Tissue Properties, Brain
Motivation: Psychosis has been studied from different perspectives, including genetic factors and dopamine dysfunction. However, those perspectives have been studied independently.
Goal(s): To investigate the relationship between genetic factors (i.e., Polygenic Risk Score, PSR) and magnetic tissue properties associated with dopamine (QSM, R2*) in a cohort of individuals with psychotic experiences.
Approach: Analyze the potential correlations among QSM, R2* and PRS scores using linear mixed models in a cohort of patients and controls obtained from the UK Biobank.
Results: We identified significant predictors for QSM and R2* values with PRS, revealing differences in specific brain regions associated with dopamine pathways.
Impact: The changes found in the brain regions associated with dopamine pathways provide further evidence to support that psychosis may be related to a dopamine dysfunction, and those changes may also be related to genetic factors.
Introduction
The physiopathology of psychosis is an active field of research. Psychosis has been linked to dopamine dysfunction1. Genetic risk factors of psychosis have been studied using schizophrenia polygenic risk scores (PRS)2. Dopamine dysfunction related to psychosis has been studied using PET3 and MRI through indirect methods such as neuromelanin-sensitive MR sequences4 and Quantitative Susceptibility Mapping (QSM)5. In our study, we aim to analyze together PRS and dopamine-related measures such as QSM, to identify potential correlations between these two factors.Methods
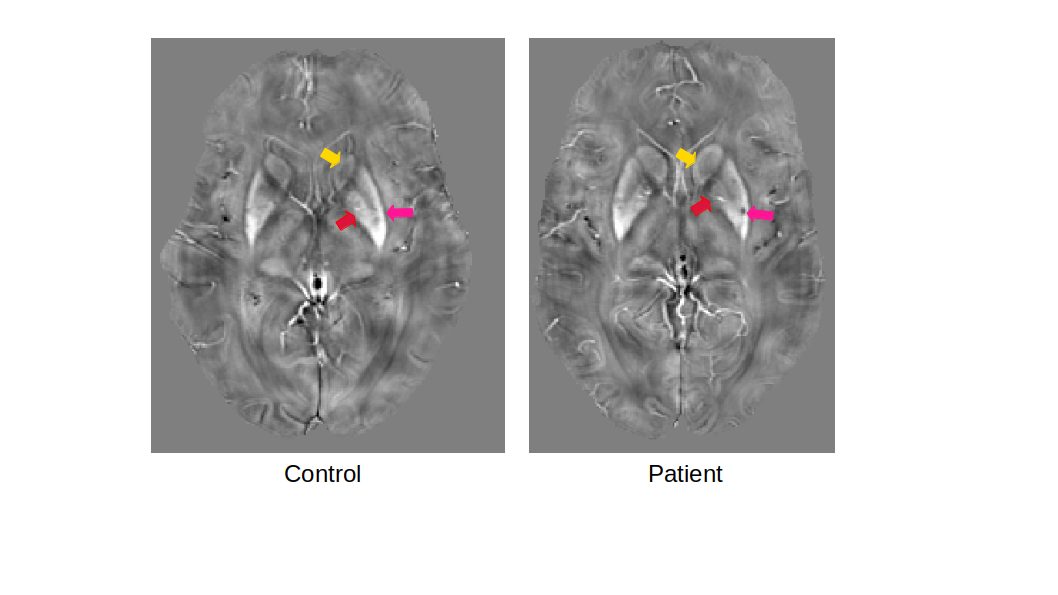
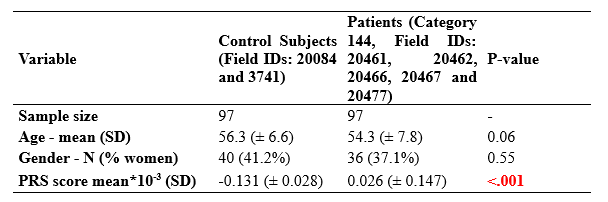
We analyzed MRI data from 97 patients and 97 controls from the UK Biobank. For controls, we excluded individuals with mental and behavioral disorders, nervous system diseases, and those who had taken iron or vitamin C, but other vitamins or mineral supplements were allowed (Table 1). For patients, we included those reporting unusual and psychotic experiences and excluded those with additional mental or neurological disorders, and those taking iron or vitamin C.We processed swMRI images (voxel size = 0.8x0.8x3mm³, matrix size = 256x288x48, TE1/2 = 9.42/20 ms, considering each RF coil and echo time separately) and T1 3D MPRAGE images (voxel size = 1x1x1mm³, matrix size = 208x256x256, TI/TR = 880/2,000 ms).We computed QSM maps as described in 6: (I) Channel combination using MCPC-3D-S7. (II) Laplacian phase unwrapping8 and echo combination by weighted sum. (III) Background field removal using vSHARP (maximum kernel size 12)9. (IV) Dipole inversion using iLSQR10 (Figure 1). We also reconstructed R2* maps from the swMRI images using a nonlinear technique available in the FANSI toolbox11 (https://gitlab.com/cmilovic/FANSI-toolbox). To calculate our own PRS, we generated a new cohort from the UK Biobank, defining cases as individuals on the p20461 category (Age when first had unusual or psychotic experience) and controls as the rest of the dataset. We used PLINK2 (https://www.cog-genomics.org/plink/2.0/) to filter and analyze the dataset, using standard filtering criteria and 10 principal components, age and sex as covariates, with 3136 cases and 335953 controls following filtering. After generating scores, we used PRSice (https://choishingwan.github.io/PRSice/) for PRS calculation on 40474 individuals with MRI images in which 355868 variants were used for PRS calculation. To evaluate the potential correlations between QSM and R2*, we segmented 20 brain regions of interest using a multi-contrast PD25 atlas12–14, which were evaluated with our PRS scores using Linear Mixed Models15 with random intercept and marginal models (Generalized Estimating Equations, GEE)16. Significance was set at p < 0.05. Analyses were conducted using R (v4.1.3) with "nlme"17 and "geepack"18.Results
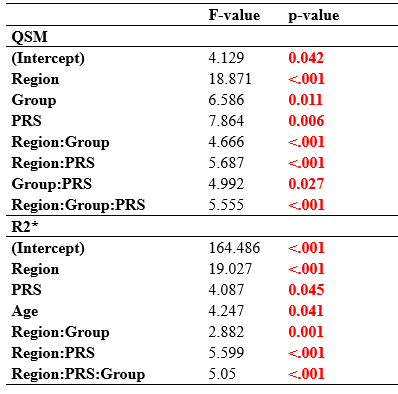
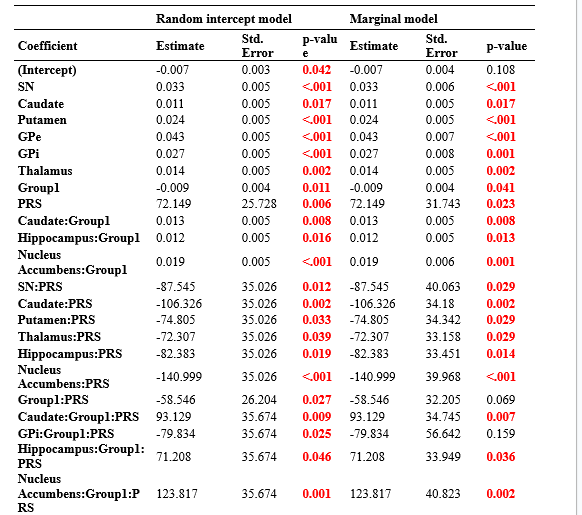
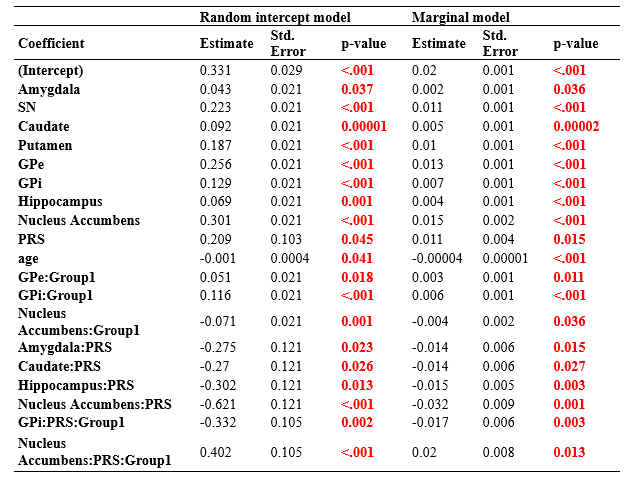
Significant predictors were identified for QSM and R2*, including region, PRS, group, and age (Table 2). We observed QSM differences between controls and patients in the caudate, hippocampus, and accumbens (Table 3), whereas R2* differences were found in the accumbens, GPe, and GPi (Table 4). PRS showed correlations with QSM and R2* in specific brain regions. For QSM, these correlations were observed in substantia nigra, caudate, putamen, thalamus, hippocampus, and accumbens, whereas R2* showed correlations in the amygdala, caudate, hippocampus, and accumbens. Specific regions demonstrated differences in QSM and R2* between controls and patients, with corresponding PRS correlations, including GPi and hippocampus for QSM/R2* and caudate and accumbens for QSM.Discussion
Our findings of QSM changes in the caudate, hippocampus, and nucleus accumbens have been associated with various conditions19–21 but not with psychosis. The correlation between PRS and QSM and R2* values aligns with previous research that reported magnetic susceptibility associations with genetic variants6. Furthermore, we established a significant relationship between QSM and R2* values and PRS in specific brain regions, offering the potential for predicting QSM and R2* values using PRS.Conclusion
Our study contributes to the limited literature on correlation variations between magnetic susceptibility, R2*, and related genetic factors related to psychosis. The changes found in the caudate, hippocampus, and accumbens provide further evidence to support that psychosis may be related to a dopamine dysfunction, and those changes may also be related to genetic factors.Acknowledgements
We thank ANID for their grant funding: Fondecyt 1231535 and the Millennium Institute for Intelligent Healthcare Engineering (ICN2021004).References
- Howes OD, Kapur S. The Dopamine Hypothesis of Schizophrenia: Version III--The Final Common Pathway. Schizophrenia Bulletin. 2009;35(3):549-562. doi:https://doi.org/10.1093/schbul/sbp006
- Zhang JP, Robinson D, Yu J, et al. Schizophrenia Polygenic Risk Score as a Predictor of Antipsychotic Efficacy in First-Episode Psychosis [published correction appears in Am J Psychiatry. 2019 Mar 1;176(3):252]. Am J Psychiatry. 2019;176(1):21-28. doi:10.1176/appi.ajp.2018.17121363
- Patel NH, Vyas NS, Puri BK, Nijran KS, Al-Nahhas A. Positron emission tomography in schizophrenia: a new perspective. J Nucl Med. 2010;51(4):511-520. doi:10.2967/jnumed.109.066076
- Wieland L, Fromm S, Hetzer S, Schlagenhauf F, Kaminski J. Neuromelanin-Sensitive Magnetic Resonance Imaging in Schizophrenia: A Meta-Analysis of Case-Control Studies. Front Psychiatry. 2021;12:770282. Published 2021 Oct 28. doi:10.3389/fpsyt.2021.770282
- García Saborit M, Jara A, Muñoz N, et al. Quantitative Susceptibility Mapping MRI in Deep-Brain Nuclei in First-Episode Psychosis. Schizophr Bull. 2023;49(5):1355-1363. doi:10.1093/schbul/sbad041
- Wang C, Martins-Bach AB, Alfaro-Almagro F, et al. Phenotypic and genetic associations of quantitative magnetic susceptibility in UK Biobank brain imaging. Nat Neurosci 2022. Published online May 23, 2022:1-14. doi:10.1038/s41593-022-01074-w
- Eckstein K, Dymerska B, Bachrata B, et al. Computationally Efficient Combination of Multi-channel Phase Data From Multi-echo Acquisitions (ASPIRE). Magn Reson Med. 2018;79(6):2996-3006. doi:10.1002/MRM.26963
- Li W, Avram A V., Wu B, Xiao X, Liu C. Integrated Laplacian-based phase unwrapping and background phase removal for quantitative susceptibility mapping. NMR Biomed. 2014;27(2):219-227. doi:10.1002/nbm.3056
- Bilgic B, Fan AP, Polimeni JR, et al. Fast quantitative susceptibility mapping with L1-regularization and automatic parameter selection. Magn Reson Med. 2014;72(5):1444-1459. doi:10.1002/mrm.25029
- Li W, Wang N, Yu F, et al. A method for estimating and removing streaking artifacts in quantitative susceptibility mapping. Neuroimage. 2015;108:111-122. doi:10.1016/J.NEUROIMAGE.2014.12.043
- Milovic C, Bilgic B, Zhao B, Acosta-Cabronero J, Tejos C. Fast nonlinear susceptibility inversion with variational regularization. Magn Reson Med. 2018;80(2):814-821. doi:10.1002/mrm.27073
- Xiao Y, Fonov V, Bériault S, et al. Multi-contrast unbiased MRI atlas of a Parkinson’s disease population. Int J Comput Assist Radiol Surg. 2015;10(3):329-341. doi:10.1007/s11548-014-1068-y
- Xiao Y, Beriault S, Pike GB, Collins DL. Multicontrast multiecho FLASH MRI for targeting the subthalamic nucleus. Magn Reson Imaging. 2012;30(5):627-640. doi:10.1016/j.mri.2012.02.006
- Xiao Y, Fonov V, Chakravarty MM, et al. A dataset of multi-contrast population-averaged brain MRI atlases of a Parkinson׳s disease cohort. Data Br. 2017;12:370-379. doi:10.1016/j.dib.2017.04.013
- Cnaan A, Laird NM, Slasor P. TUTORIAL IN BIOSTATISTICS USING THE GENERAL LINEAR MIXED MODEL TO ANALYSE UNBALANCED REPEATED MEASURES AND LONGITUDINAL DATA. Stat Med. 1997;16:2349-2380. doi:10.1002/(SICI)1097-0258(19971030)16:20
- Liang KY, Zeger SL. Longitudinal data analysis using generalized linear models. Biometrika. 1986;73(1):13-22. doi:10.1093/BIOMET/73.1.13Pinheiro JC, Bates DM. Mixed-Effects Models in S and S-PLUS. Springer. Published online 2000. doi:10.1007/B98882
- Halekoh U, Højsgaard S, Yan J. The R Package geepack for Generalized Estimating Equations. J Stat Softw. 2006;15(2):1-11. doi:10.18637/JSS.V015.I02
- Acosta-Cabronero J, Betts MJ, Cardenas-Blanco A, Yang S, Nestor PJ. In vivo MRI mapping of brain iron deposition across the adult lifespan. J Neurosci. 2016;36(2):364-374. doi:10.1523/JNEUROSCI.1907-15.2016
- Xu X, Zhou M, Wu X, et al. Increased iron deposition in nucleus accumbens associated with disease progression and chronicity in migraine. BMC Med. 2023;21(1):1-11. doi:10.1186/S12916-023-02855-1/FIGURES/4
- Ayton S, Fazlollahi A, Bourgeat P, et al. Cerebral quantitative susceptibility mapping predicts amyloid-β-related cognitive decline. Brain. 2017;140(8):2112-2119. doi:10.1093/BRAIN/AWX137
Figures