3687
Electrical properties of potato as a plant-based electroporation model at high (64 MHz) and low (1 kHz - 1 MHz) frequencies1Diagnostic and Interventional Radiology, University Hospital RWTH Aachen, Aachen, Germany, 2Philips Medical Systems, Best, Netherlands, 3Philips Research Europe, Hamburg, Germany
Synopsis
Keywords: Electromagnetic Tissue Properties, Electromagnetic Tissue Properties
Motivation: Plant-based models such as potatoes are employed for research on irreversible electroporation (IRE). Volumetric assessment of electroporation-mediated conductivity changes is desirable. MR-based electric properties tomography (EPT) provides volumetric conductivity assessment at the Larmor frequency.
Goal(s): This study aimed to assess IRE-mediated conductivity changes in potato tissue by EPT at 64 MHz and by electrochemical impedance spectroscopy (EIS) between 1kHz and 1 MHz.
Approach: Potato samples were electroporated with different pulse amplitudes and analyzed by EPT based on 3D FLAIR measurements and EIS.
Results: EIS detected a clear conductivity rise in the low frequency range, while EPT did not detect significant conductivity changes.
Impact: MR-based electric properties tomography offers volumetric conductivity measurement method at the Larmor frequency, but was not found capable of detecting significant conductivity changes in potato tissue at 64 MHz. This has implications for treatment response assessment in basic electroporation research.
Introduction
Irreversible electroporation (IRE) permanently destroys cell membranes by means of alternating electric fields and can be employed for minimally invasive tumor treatment1. Plant-based models such as potatoes are utilized in basic electroporation research, as they provide living-cell tissue while sparing laboratory animals. Electrochemical impedance spectroscopy (EIS) gives insight into the electrical properties of tissues in the ‘low’ frequency range (i.e., below 1 MHz). Here, IRE was reported to increase EIS-measured conductivity values of potato tissue2. However, EIS is invasive and limited to selected locations. In the context of device development, a volumetric conductivity measurement method is required to assess treatment response. MR-based electric properties tomography (EPT) maps the conductivity at the Larmor frequency, i.e., at 64 MHz for 1.5 T3. However, it is unclear whether EPT can distinguish electroporated from non-electroporated potato tissue.Methods
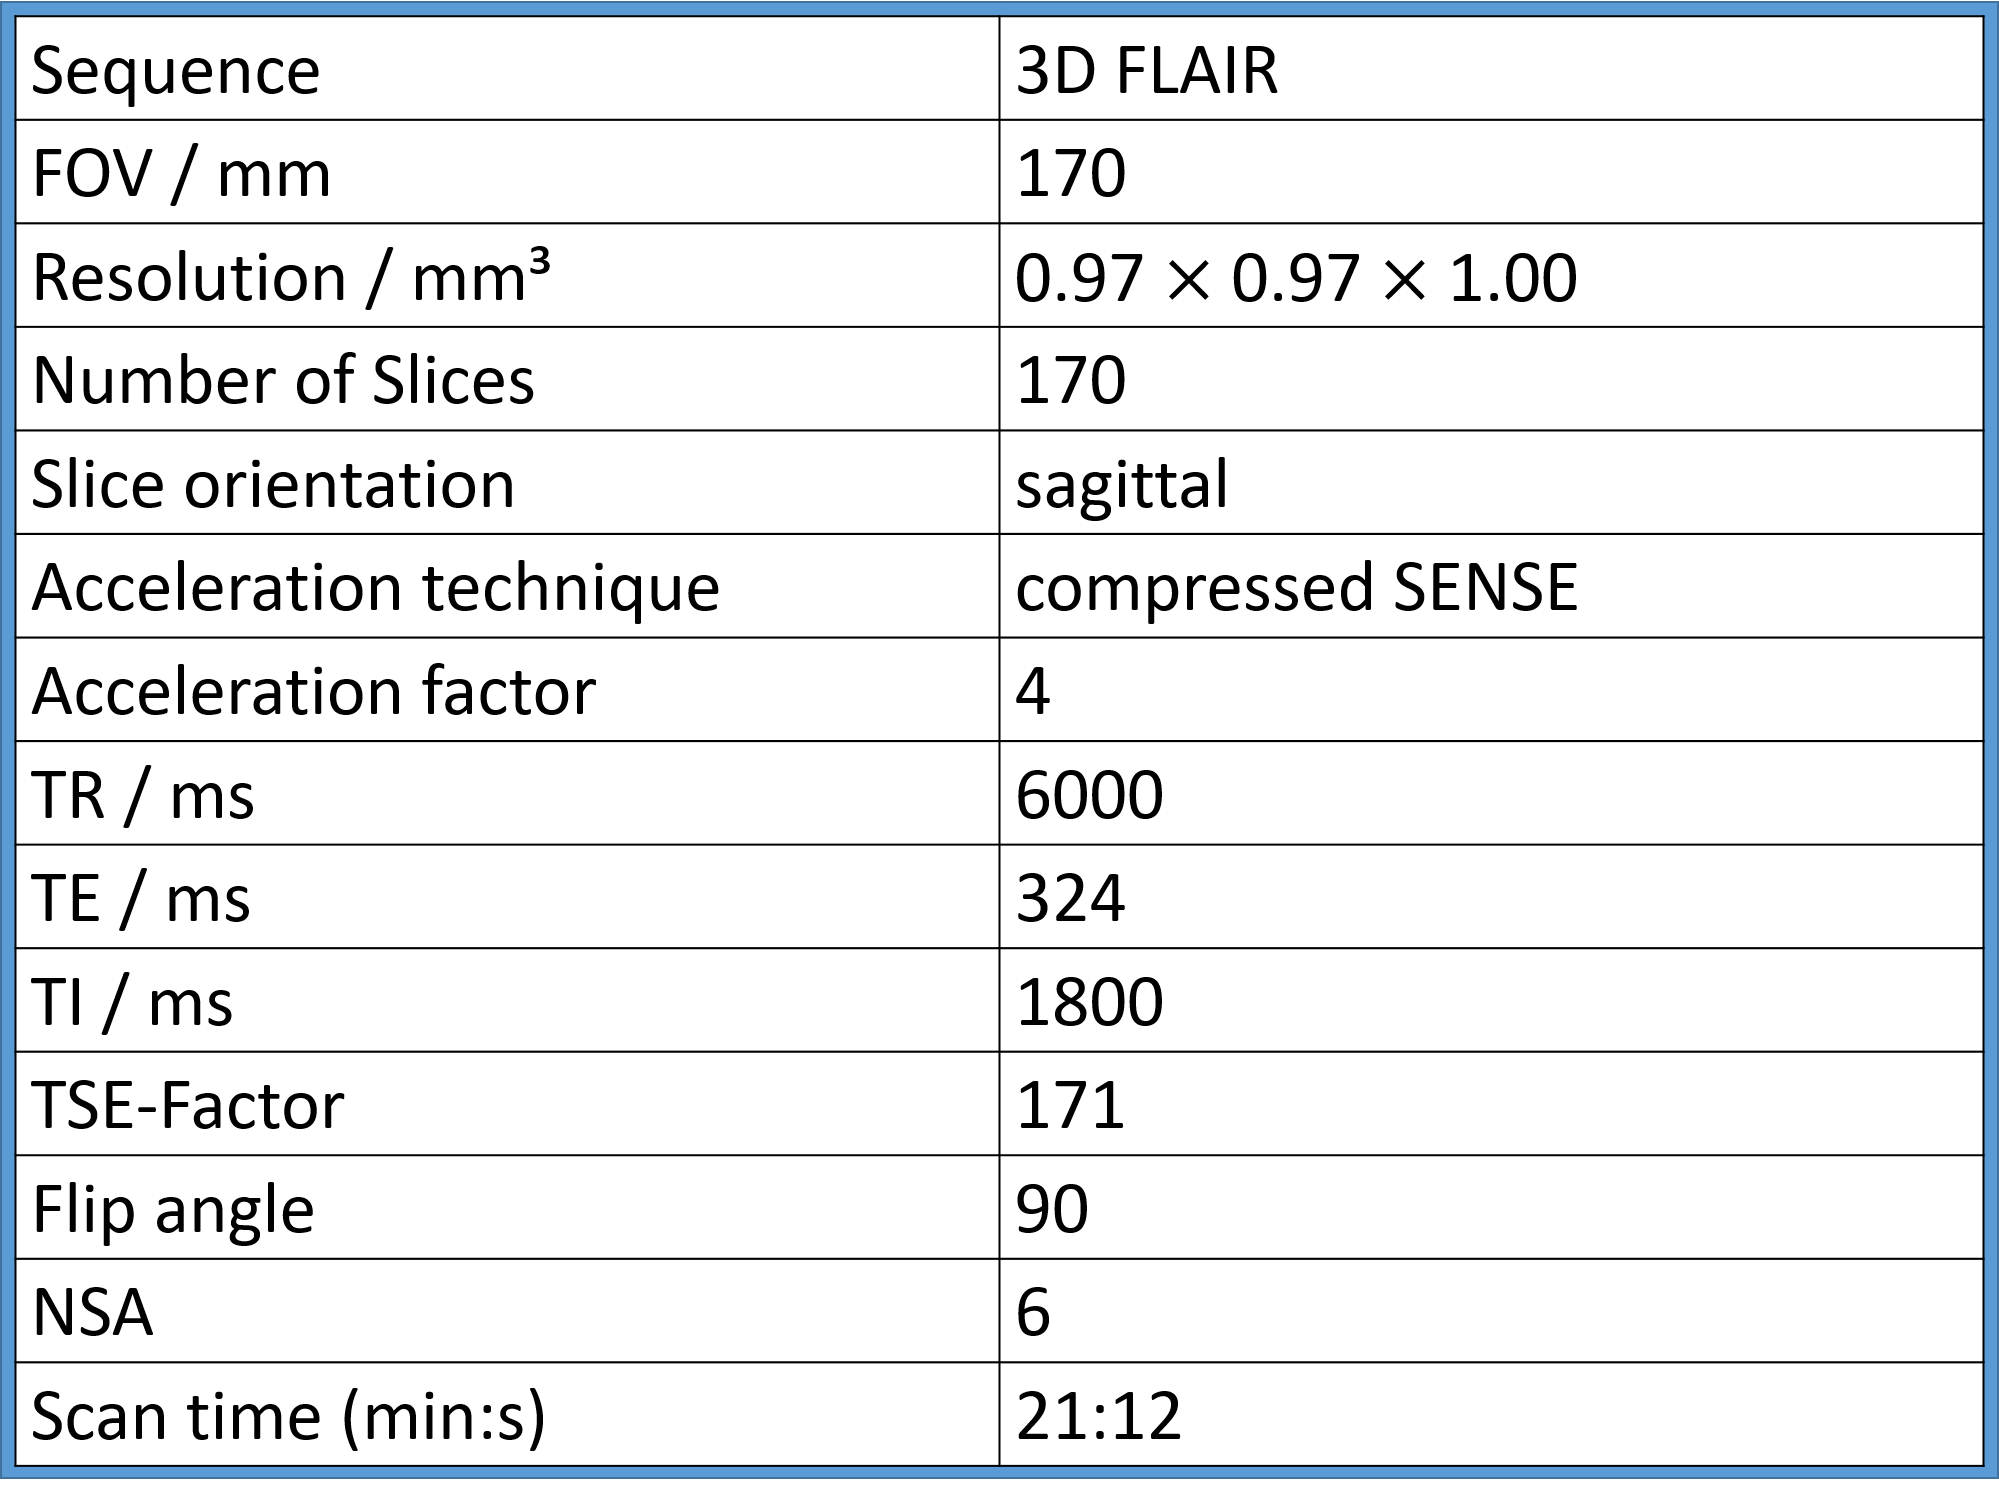
Six potato samples (Solanum tuberosum var. Sunita) were electroporated using the BTX Gemini X2 Twin Wave Electroporation System (Holliston, Massachusetts 01746, United States) with a custom-designed 2-needle applicator (needle diameter 1 mm, needle distance 1 cm, insertion depth 1.5 cm, exposed electrode length 1 cm) and applying 70 unipolar pulses (pulse duration 100 µs, pulse interval 100 ms) at 3 different amplitudes (100, 500 and 1000 V/cm). Samples were electroporated in duplicate, i.e., in two sets.For MR-based EPT, the samples were imaged four hours post electroporation at 1.5 T (Ambition, Philips, Best, The Netherlands) employing a 20-ch head coil and a 3D FLAIR sequence with compressed sensitivity encoding reconstruction. Figure 1 summarizes the scan parameters. Semi-automatic segmentation of electroporation zones (EPZs) on the 3D FLAIR magnitude images was performed in 3D Slicer (v4.11, www.slicer.org) using the ‘level tracking’ tool. In addition to the real EPZ, a pseudo EPZ per sample was defined for control purposes as an ellipsoidal region of interest in the non-electroporated location of each sample.
Conductivity at 64 MHz was derived from MR images using EPT, i.e., the truncated Helmholtz equation for the conductivity σ=∇2φ/(2μ0ω) (FLAIR image phase φ, Larmor frequency ω, vacuum permeability μ0) was solved using numerical differentiation. To avoid the typical boundary artefacts of EPT, the differentiation kernel was shaped locally for not mixing voxels from inside/outside the segmented (real or pseudo) EPZs. Subsequently, a median filter was applied for denoising. Mean conductivity values were calculated within the EPZs and within the immediately surrounding rim regions and compared by means of two-tailed paired t-tests.
Immediately after MRI, the potatoes were cut in half along the needle plane. Two EIS measurements were performed per sample using an ISX-3 impedance analyzer (ScioSpec, Bennewitz, Germany) and a four-point custom measurement probe (needle diameter 1 mm, outer-needle-distance 1 cm, needle length 1.5 cm, insertion depth 1 cm). Spectra were recorded between 1 kHz and 1 MHz. One measurement was taken within the center of the EPZ, and a reference measurement was taken in the intact medulla of the same potato half.
Results
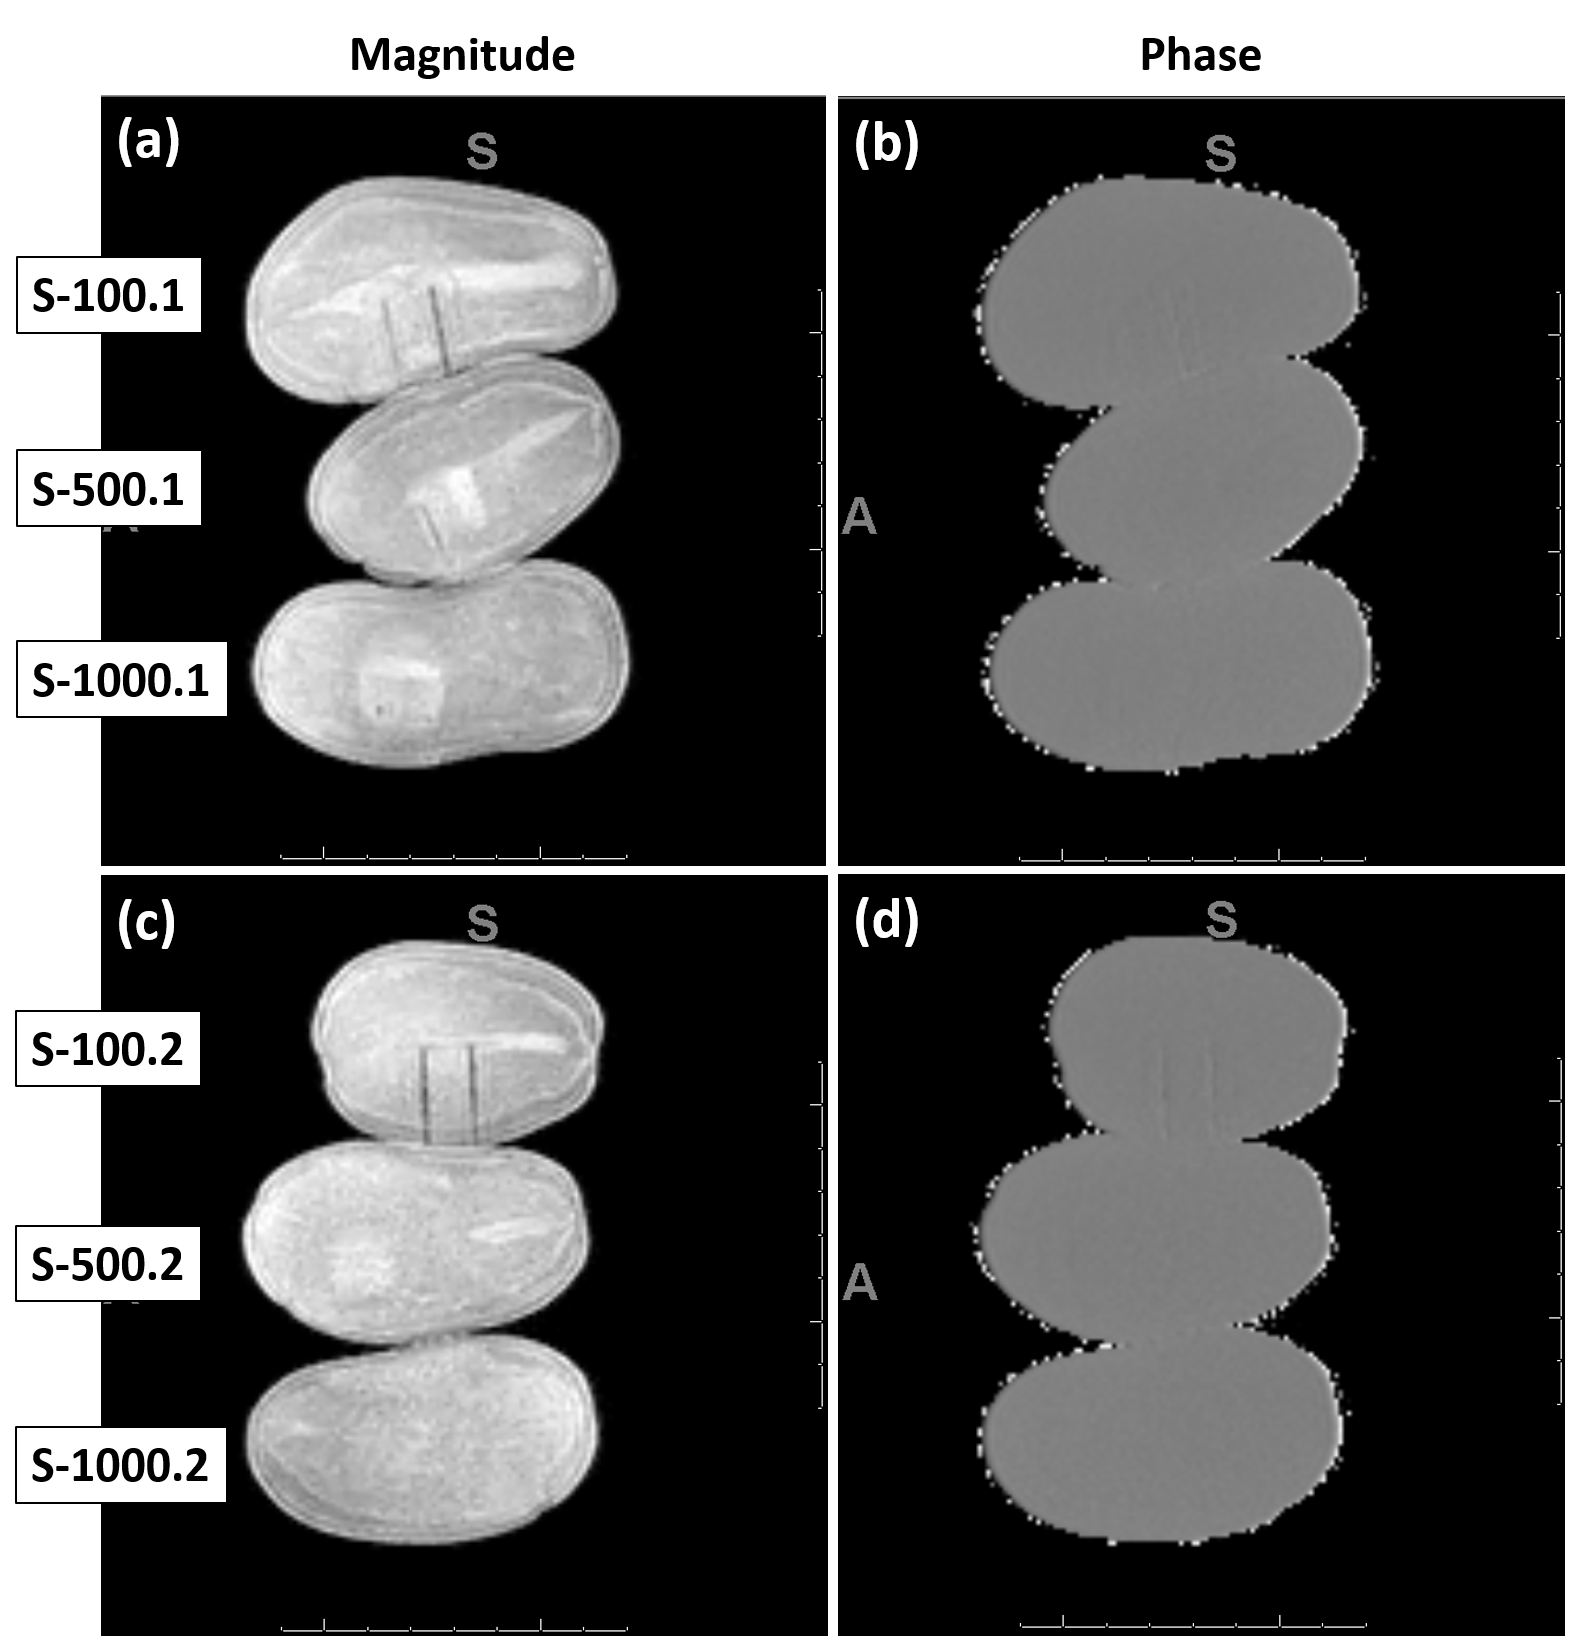
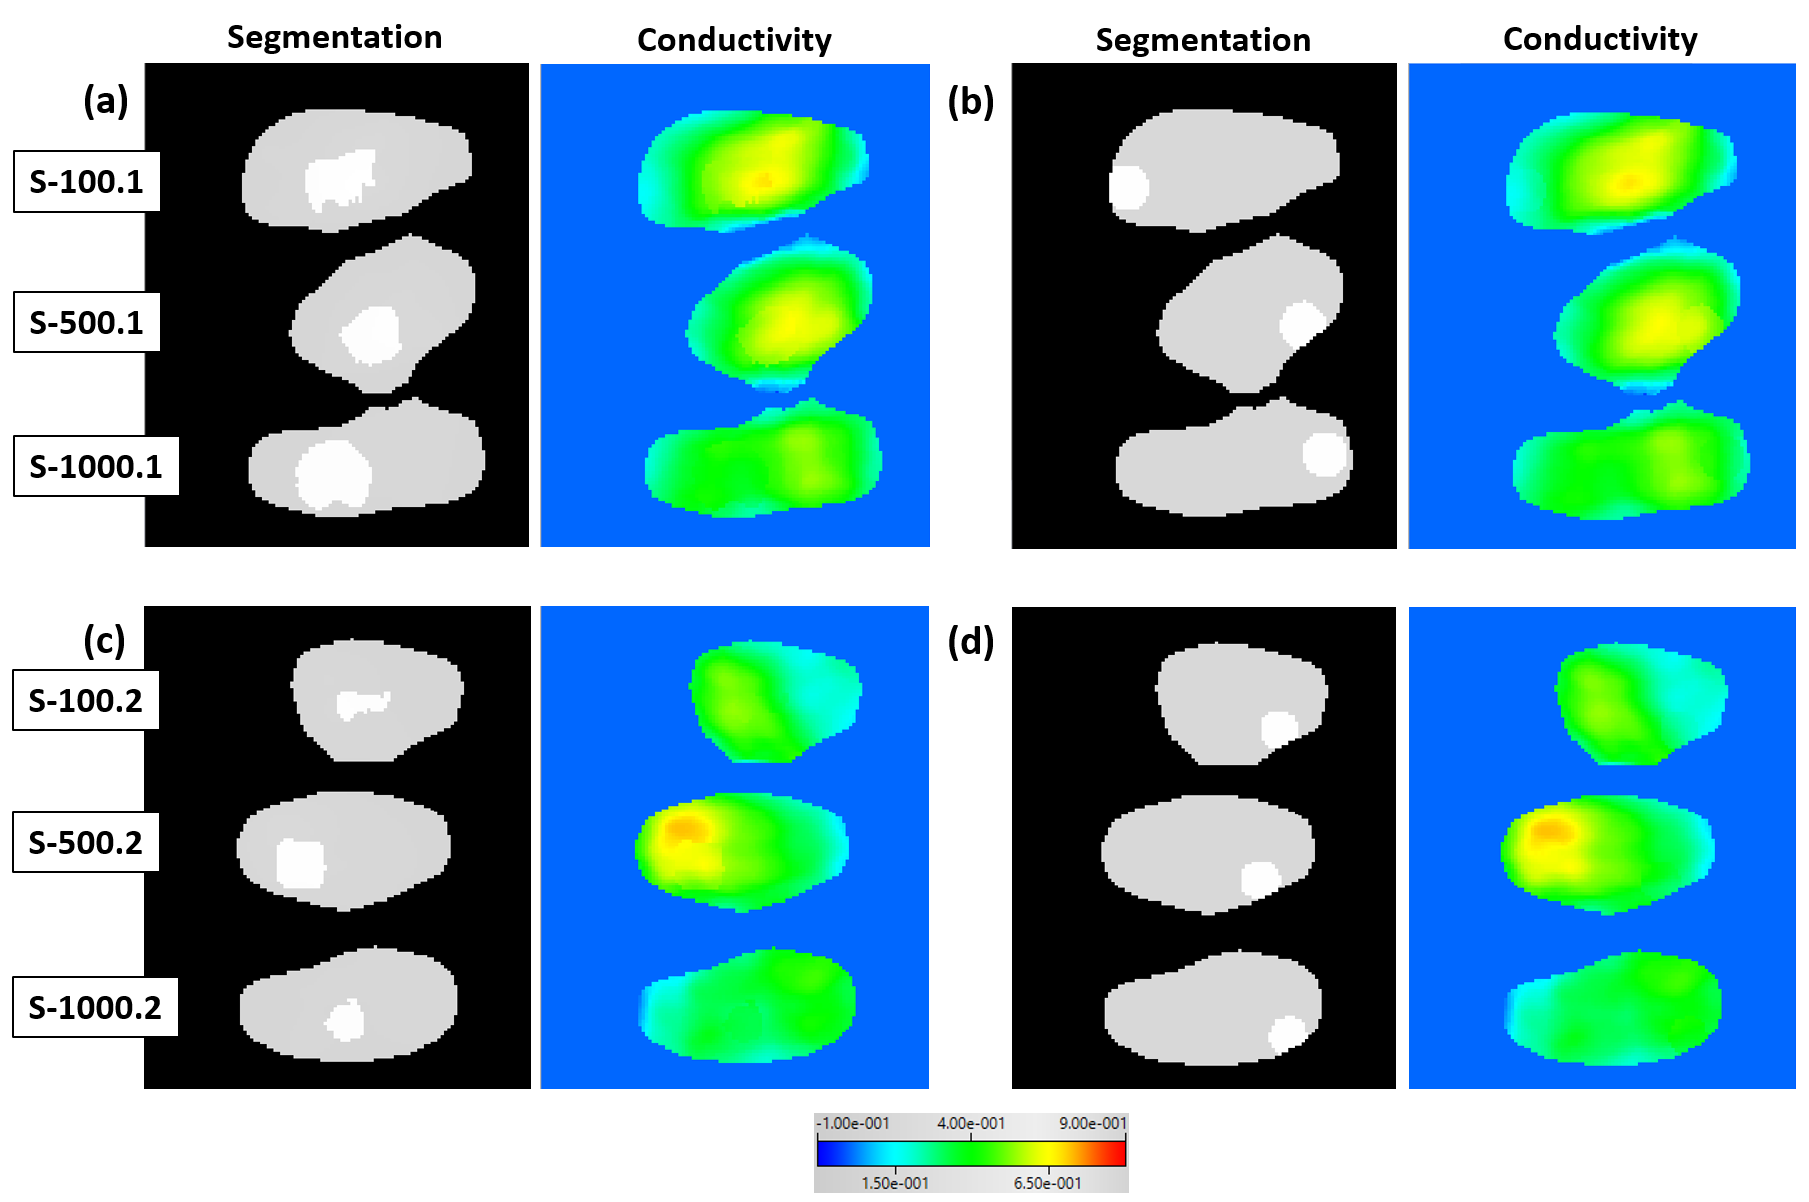
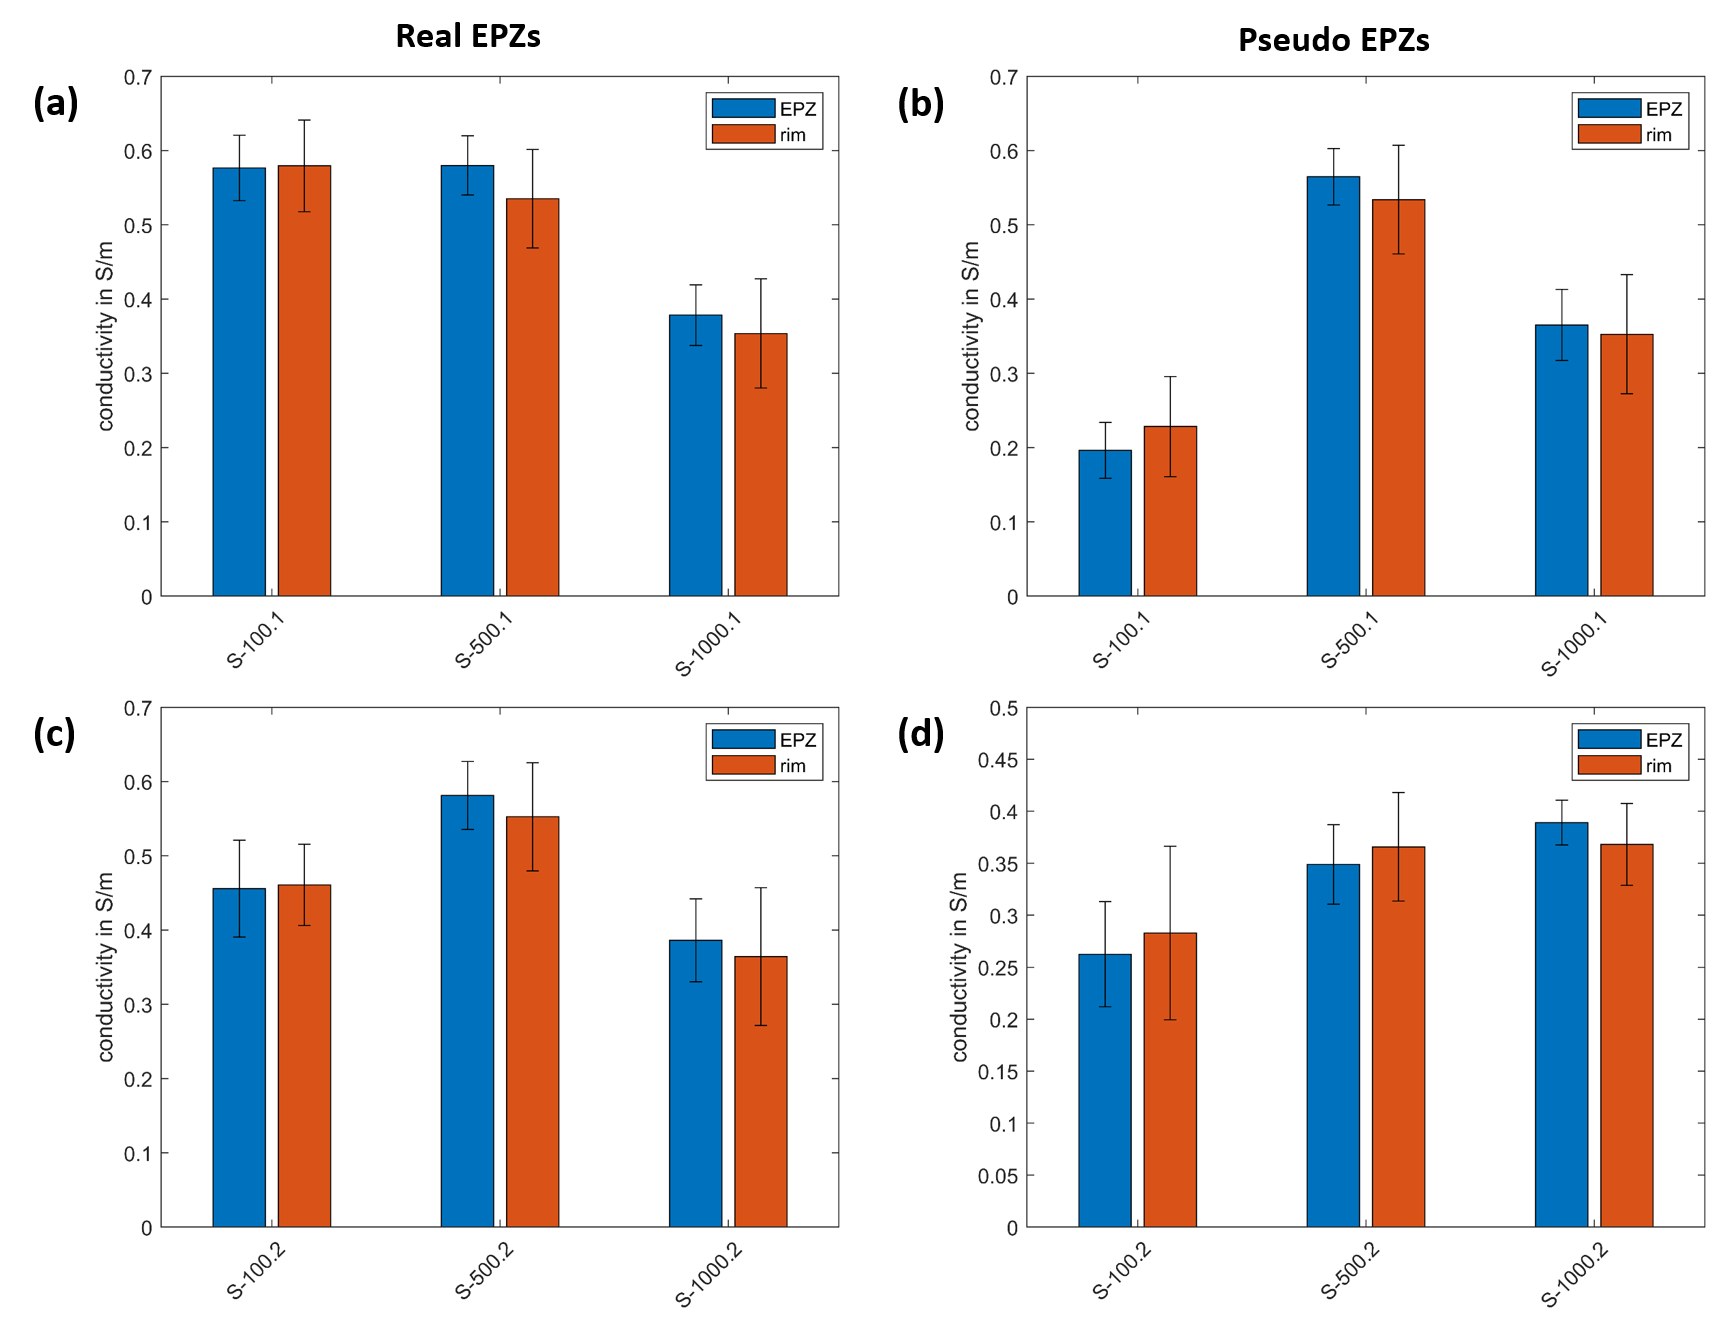
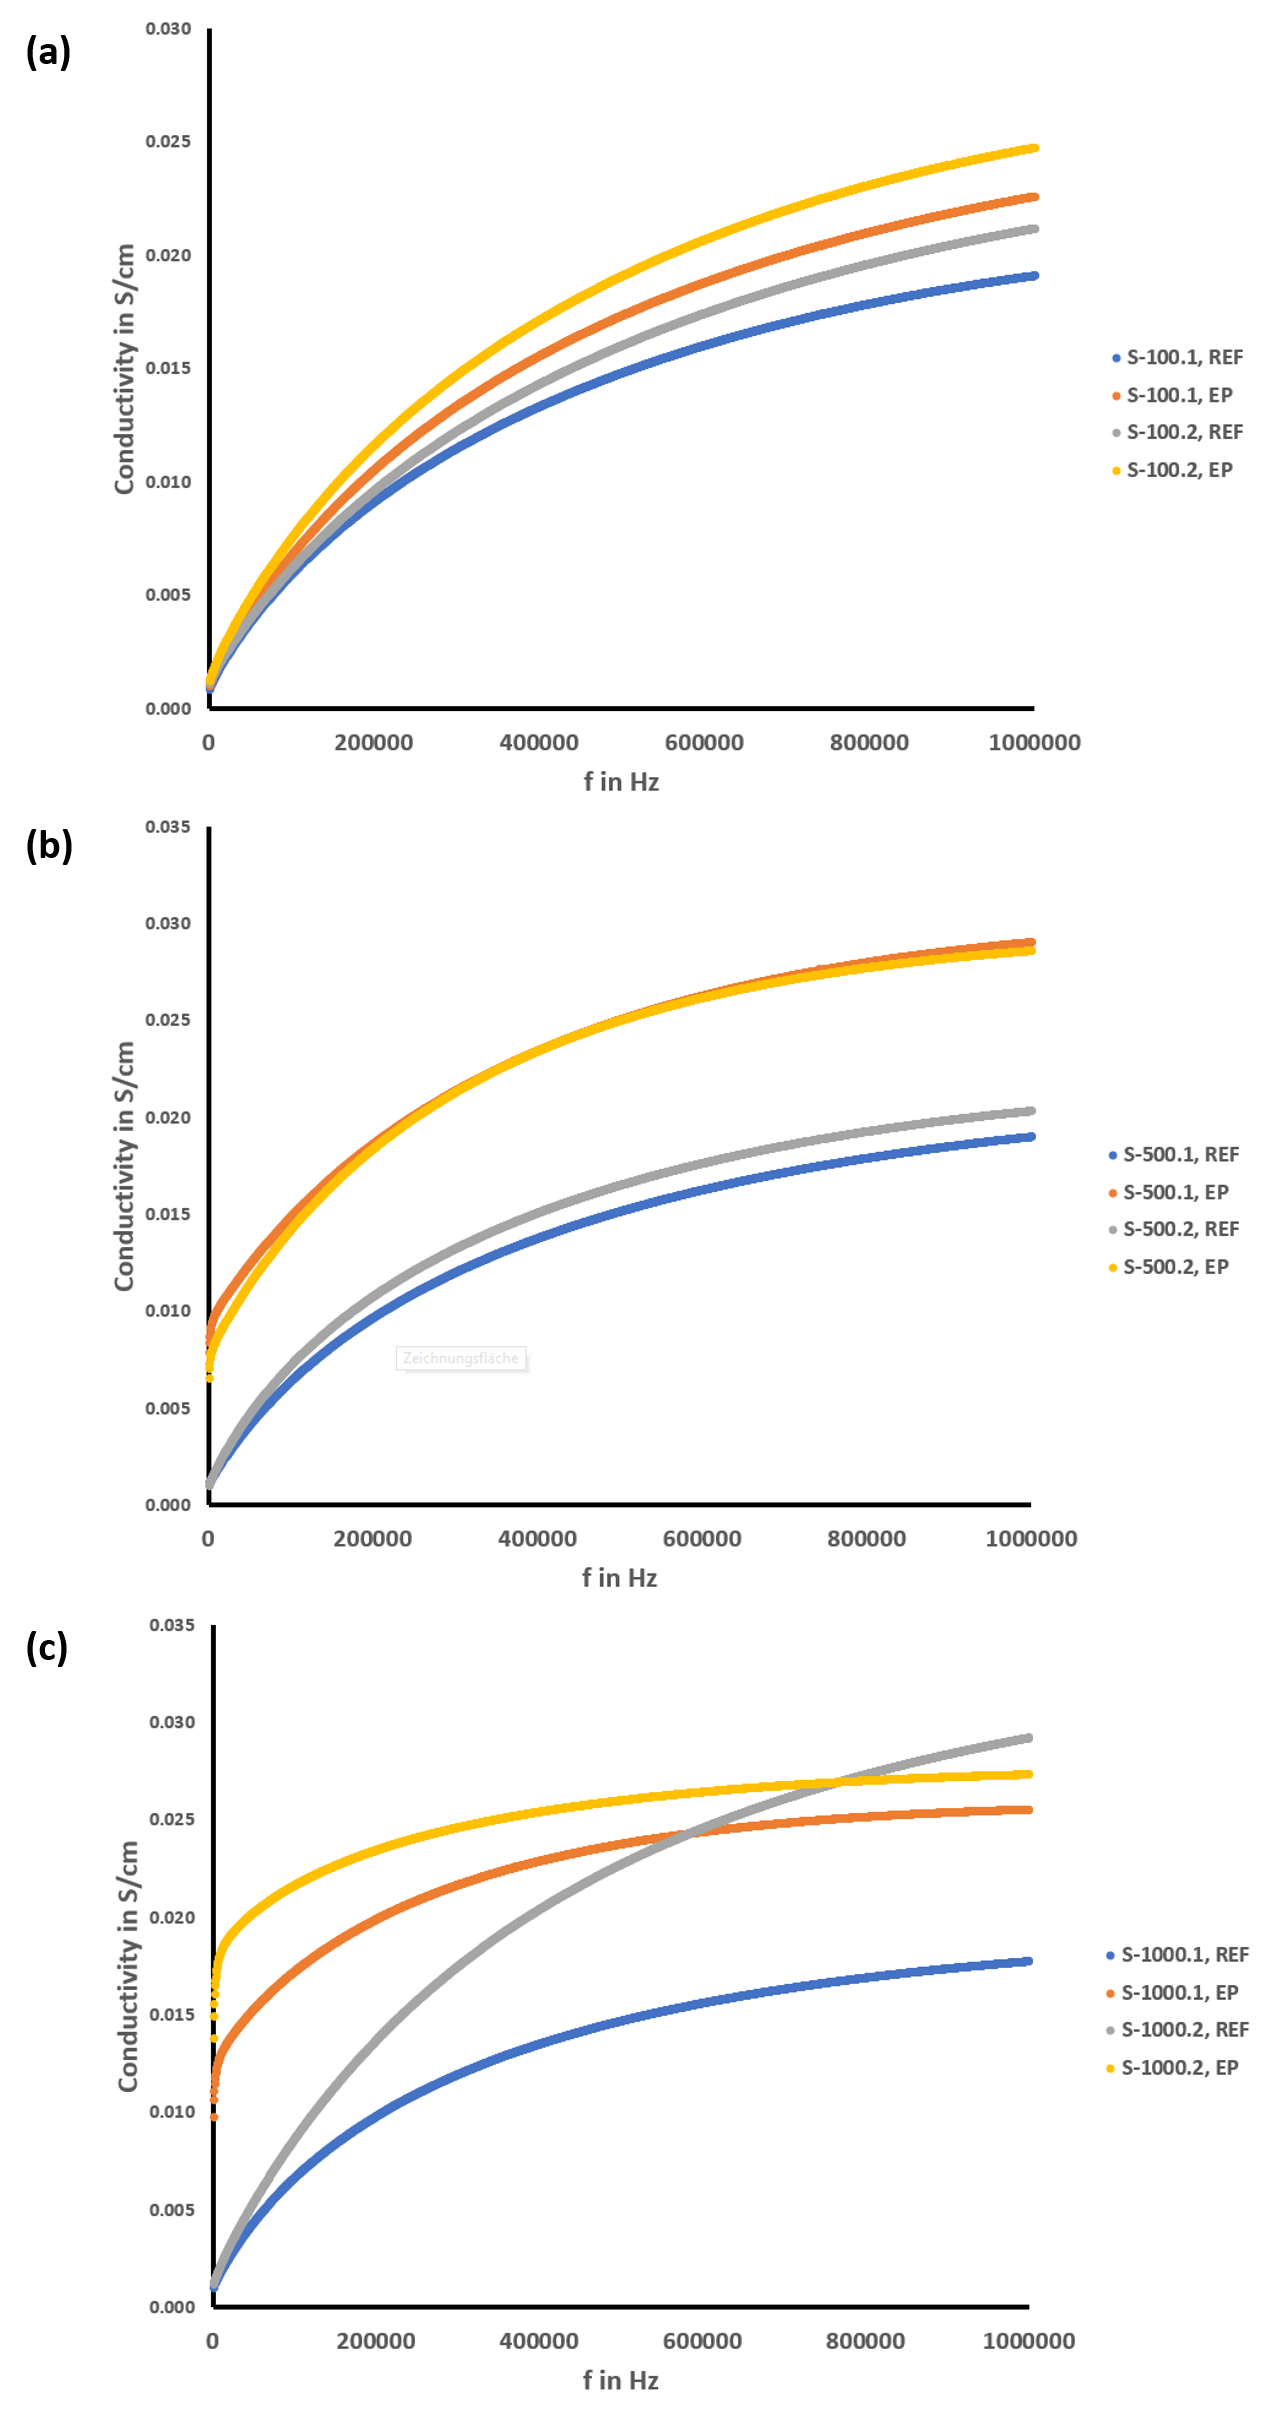
On 3D FLAIR magnitude images, EPZs manifest as hyperintense to the surrounding potato medulla (Figure 2). No clear visual correlate between the segmented real EPZ can be discerned on the EPT-reconstructed conductivity maps (Figure 3). In fact, mean conductivity at the Larmor frequency (64 MHz) as measured by EPT is rather sample-dependent than influenced by the effects of electroporation (Figure 4). We found no significant conductivity increase inside the EPZ, neither for the real EPZs (σEPZ=0.5±0.1 S/cm vs. σrim=0.5±0.1 S/cm, p=0.06) or the pseudo EPZs (σEPZ=0.4±0.1 S/cm vs. σrim=0.4±0.1 S/cm, p=0.94). In contrast, EIS measurements show a clear conductivity increase inside the EPZ for the samples electroporated at 500 V/cm and 1000 V/cm, which is highest for the low end (1 kHz) and smallest for the high end of the spectrum (1 MHz) (Figure 5). For the samples electroporated at 100 V/cm, the conductivity increase is visible, but less strong.Discussion
While conductivity at low frequencies is mainly determined by the mobility of ions (i.e., cellular tissue structure), conductivity at high frequencies is mainly determined by the concentration of ions. As electroporation does not change the total ion concentration inside the EPZ, conductivity measured with EPT is not altered by electroporation. Electroporation, however, destroys cell membranes in the potato, which increases the mobility of ions and thus also the conductivity measured with EIS. An MR-based alternative to EIS ist given by magnetic resonance electrical impedance tomography, which also measures the conductivity in the low frequency regime4.Conclusion
According to this study, EPT measuring conductivity at Larmor frequency is no suitable tool for monitoring electroporation, at least not for electroporation of a potato model.Acknowledgements
No acknowledgement found.References
1 Thomson KR et al. Introduction to Irreversible Electroporation - Principles and Techniques. Tech Vasc Interv Radiol 2015; 18:128–134.
2 Yao C et al. Dielectric Variations of Potato Induced by Irreversible Electroporation under Different Pulses Based on the Cole-Cole Model. IEEE Trans Dielectr Electr Insul 2017; 24(4):2225-2233.
3 Katscher et al. Electric properties tomography: Biochemical, physical and technical background, evaluation and clinical applications. NMR Biomed 2017; 30(8): e3729.
4 Kranjc M et al. Magnetic resonance electrical impedance tomography for monitoring electric field distribution during tissue electroporation. IEEE Trans Med Imaging. 2011;30(10):1771-1778.
Figures