3686
Age-related changes of electrical conductivity in adults: preliminary results with MR-EPT1IADI U1254, INSERM, Université de Lorraine, Nancy, France, 2Siemens Healthcare SAS, Saint Denis, France, 3CIC-IT 1433, CHRU Nancy, INSERM, Université de Lorraine, Nancy, France
Synopsis
Keywords: Electromagnetic Tissue Properties, Electromagnetic Tissue Properties, MR EPT, conductivity, liver, brain, age-related changes
Motivation: Age-related study of electrical conductivity may be useful for personalized SAR modelling.
Goal(s): To evaluate in-vivo conductivity changes in a preliminary study in adults (brain and liver), using MR Electrical Properties Tomography, at 3T.
Approach: We used a UTE sequence to obtain RF-weighted images suitable for conductivity reconstruction. Data from 10 subjects were analyzed: in the brain, white matter and grey matter values were quantified; in the liver, fat volume fraction was also obtained for comparison.
Results: In-vivo conductivities were close to literature values, except for white matter which was higher in vivo. A significant dependency with age was found in the liver.
Impact: Knowledge of electrical properties of tissues is required for SAR modelling. Currently, values from ex-vivo/animal studies are used. In-vivo measurements by MR-EPT could bring valuable insights, in particular age-related changes, if existing, could be considered for MRI safety studies.
INTRODUCTION
Knowledge of age-related changes of electrical conductivity (𝜎) is important for MRI safety modelling, in order to get personalized specific absorption rate estimation. MR electrical properties (EPs) tomography (MR-EPT) is a non-invasive imaging technique that reconstructs the EPs of biological tissues using high radiofrequency (RF) signature pulse sequences. In this study, we validated MR-EPT against ground truth probe measurements in phantom experiments, and we performed a preliminary in-vivo investigation in adults, including brain and liver measurements. In particular, we sought to study age-related changes of conductivity. It may be assumed that liver conductivity varies with fat volume fraction, which is age-dependent 1.MATERIALS AND METHODS
MR data acquisition: MRI measurements were performed on 10 volunteers (5 male, 5 female, 32.5 ± 11 years old and BMI ranging from 19 to 32 kg/m²) using a 3T MR scanner (Siemens Prisma, Erlangen, Germany). For all scans, a 2-port body coil was employed for transmission while different combinations of surface coils were used for reception. 3D images were acquired using a UTE Spiral VIBE sequence 2 (TE = 50 μs, FA = 3°, voxel size = 1x1x1 mm3 (phantom) / 1.2x1.2x1.2 mm3 (brain) / 2×2×2.5 mm3 (liver)).Phantom (agar and various concentrations of NaCl) scans and ground truth probe measurements were made following He Z. et al. 3, in the 0~ 3S/m range. The liver water and fat maps were acquired in a 18 s breath-hold using a dual-echo Dixon VIBE sequence and then reformatted to match the dimensions of UTE scan. MPRAGE was acquired for brain anatomy.
Electrical properties reconstruction: Image-based EPT 4 uses the complex image of a UTE/ZTE sequence with a low flip angle (I≈ B0 =B1+B1-), to reconstruct conductivity with:
σ = Re(ΔB/(jωµ0B)) , where μ0 is the vacuum permeability, ω is the angular frequency.
To mitigate noise amplification resulting from the differentiation operator, we computed the second derivatives of B using a large 3D second-order Savitzky-Golay filter. We employed a filter size of [11 11 11] for phantoms/liver and [7 7 7] for the brain. Furthermore, after differentiation, we applied a [3 3 3] median filter to reduce boundary effects.
Image analysis: For liver data, the FVF maps 5 were generated by combining the fat image (F) and water image (W) as:
FVF= F/(F+W)×100%.
The liver segmentation was performed with k-means algorithm (k=5) and corrected manually. For brain data, white matter and grey matter were segmented using software SPM 12 (WTCN, UCL, London, UK). All ROIs were eroded with a disk-shaped structure element with a radius of 2.
RESULTS
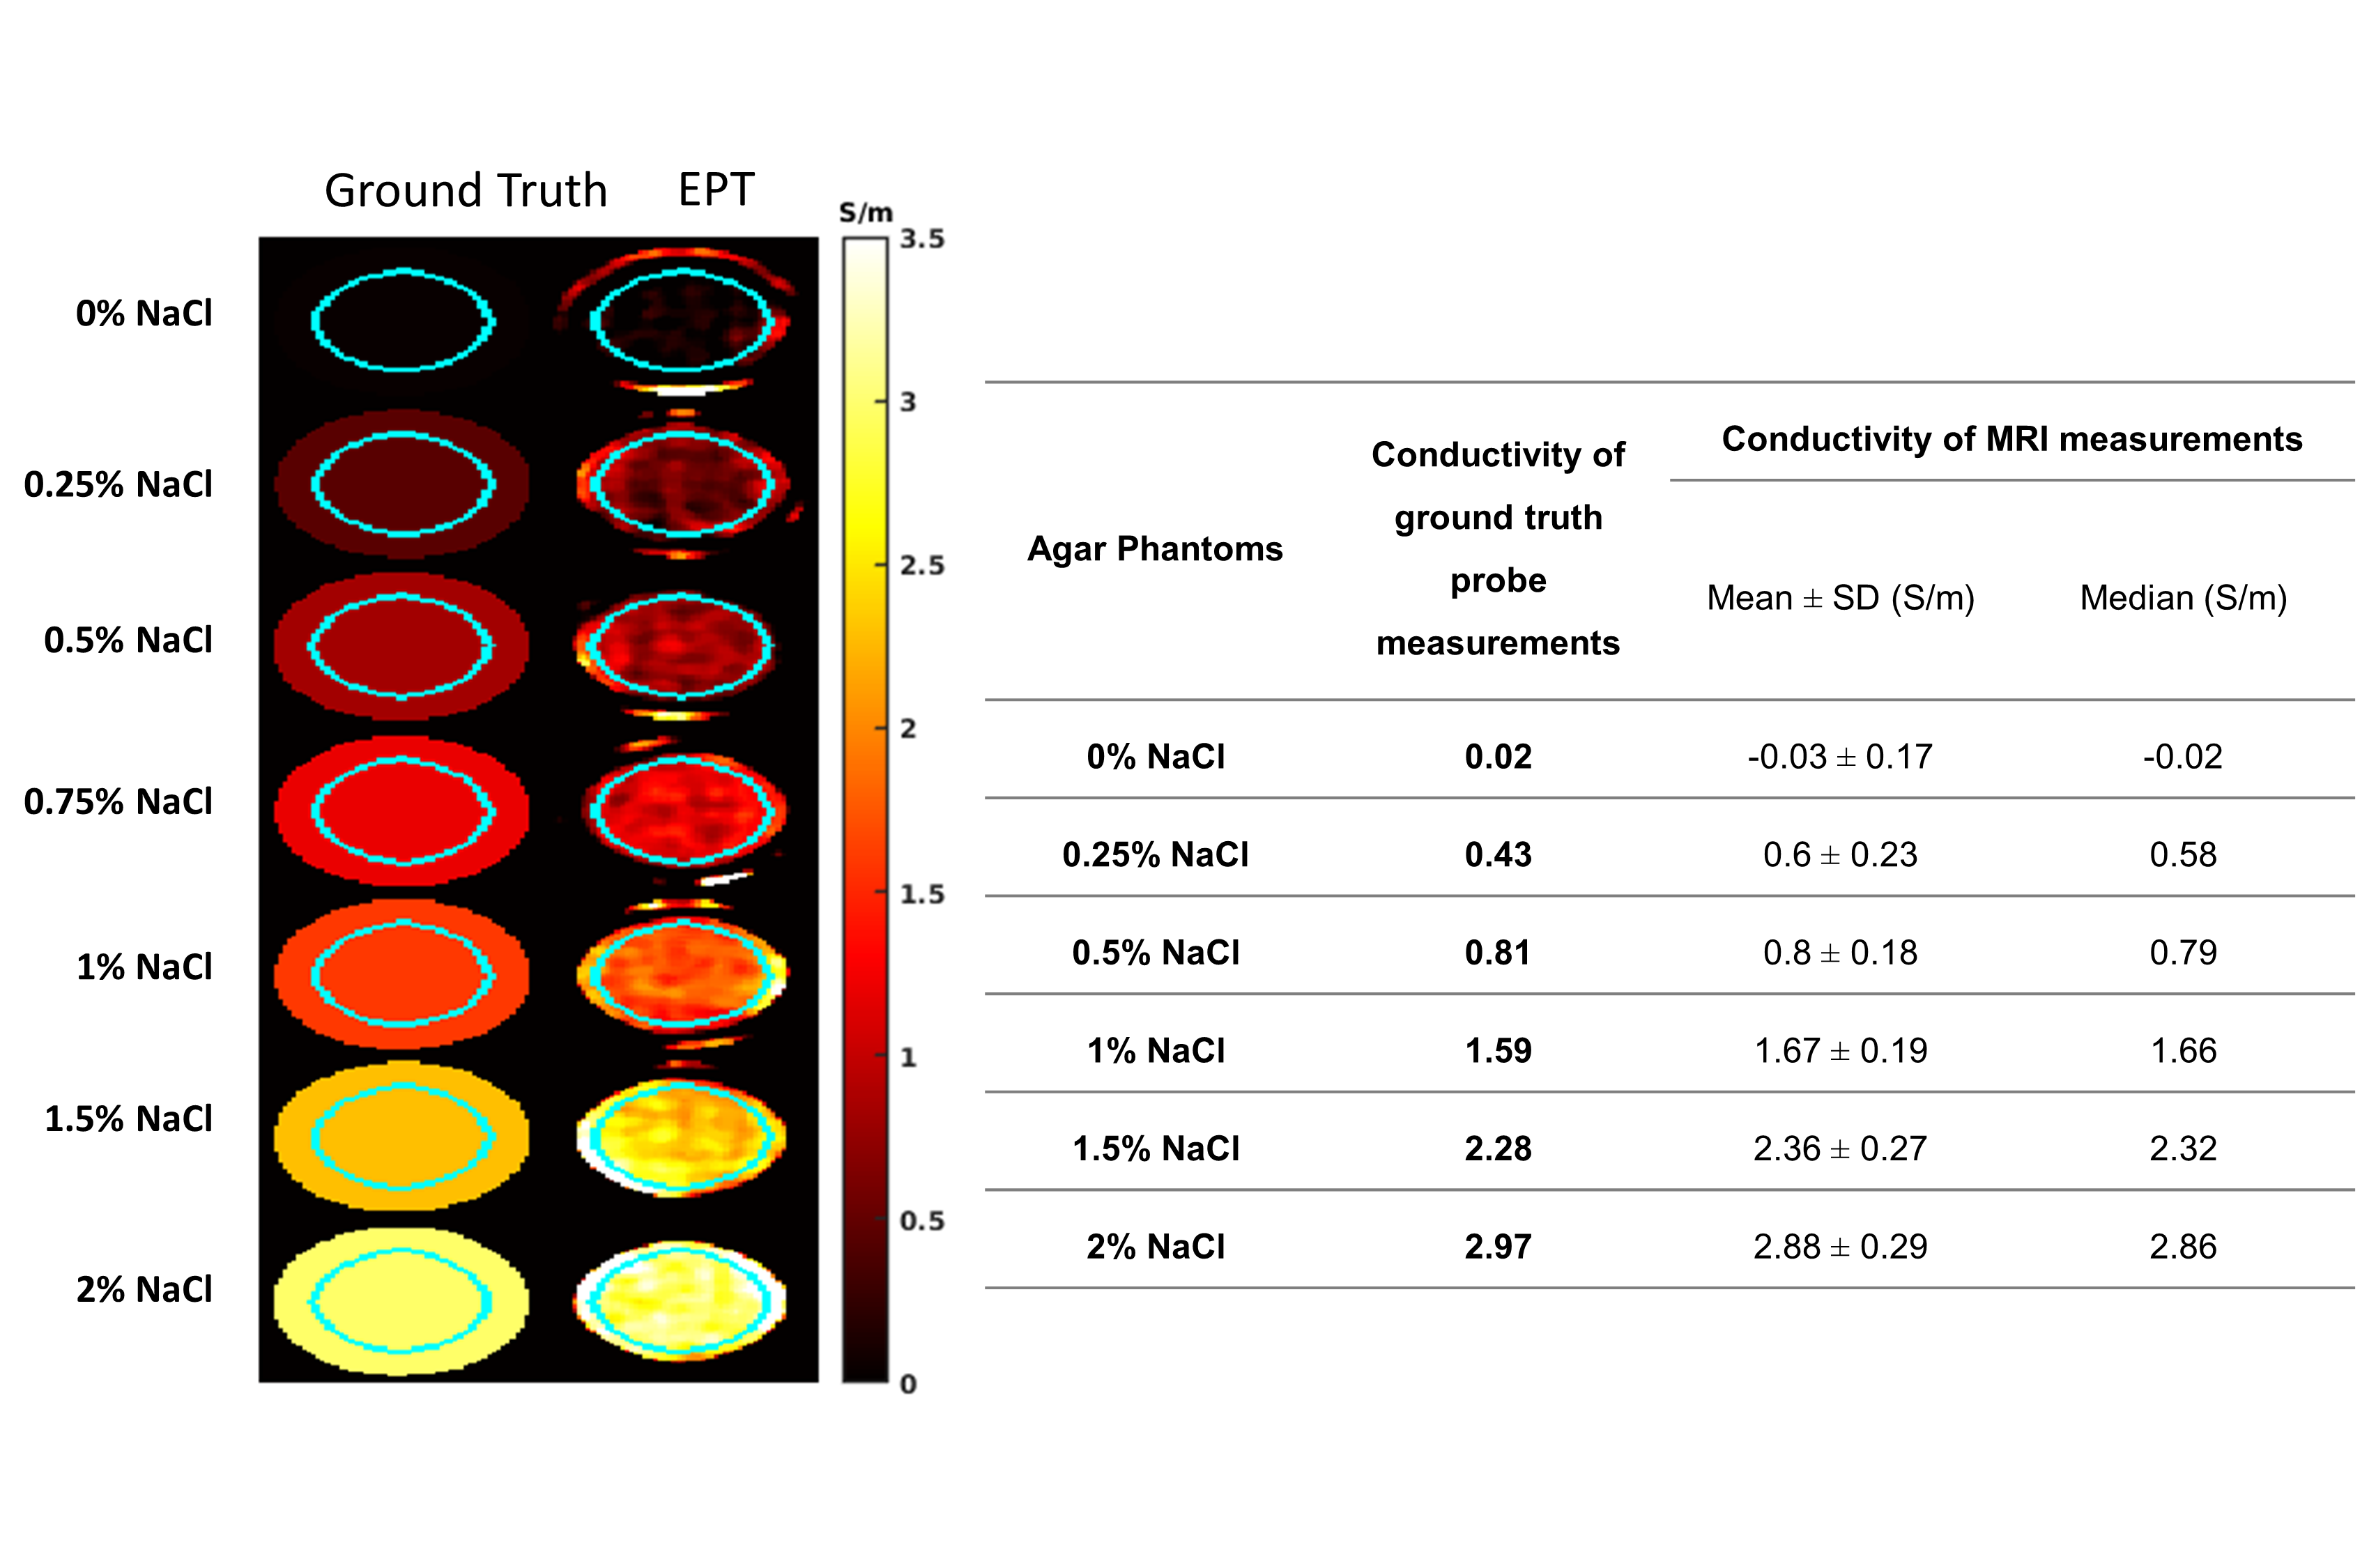
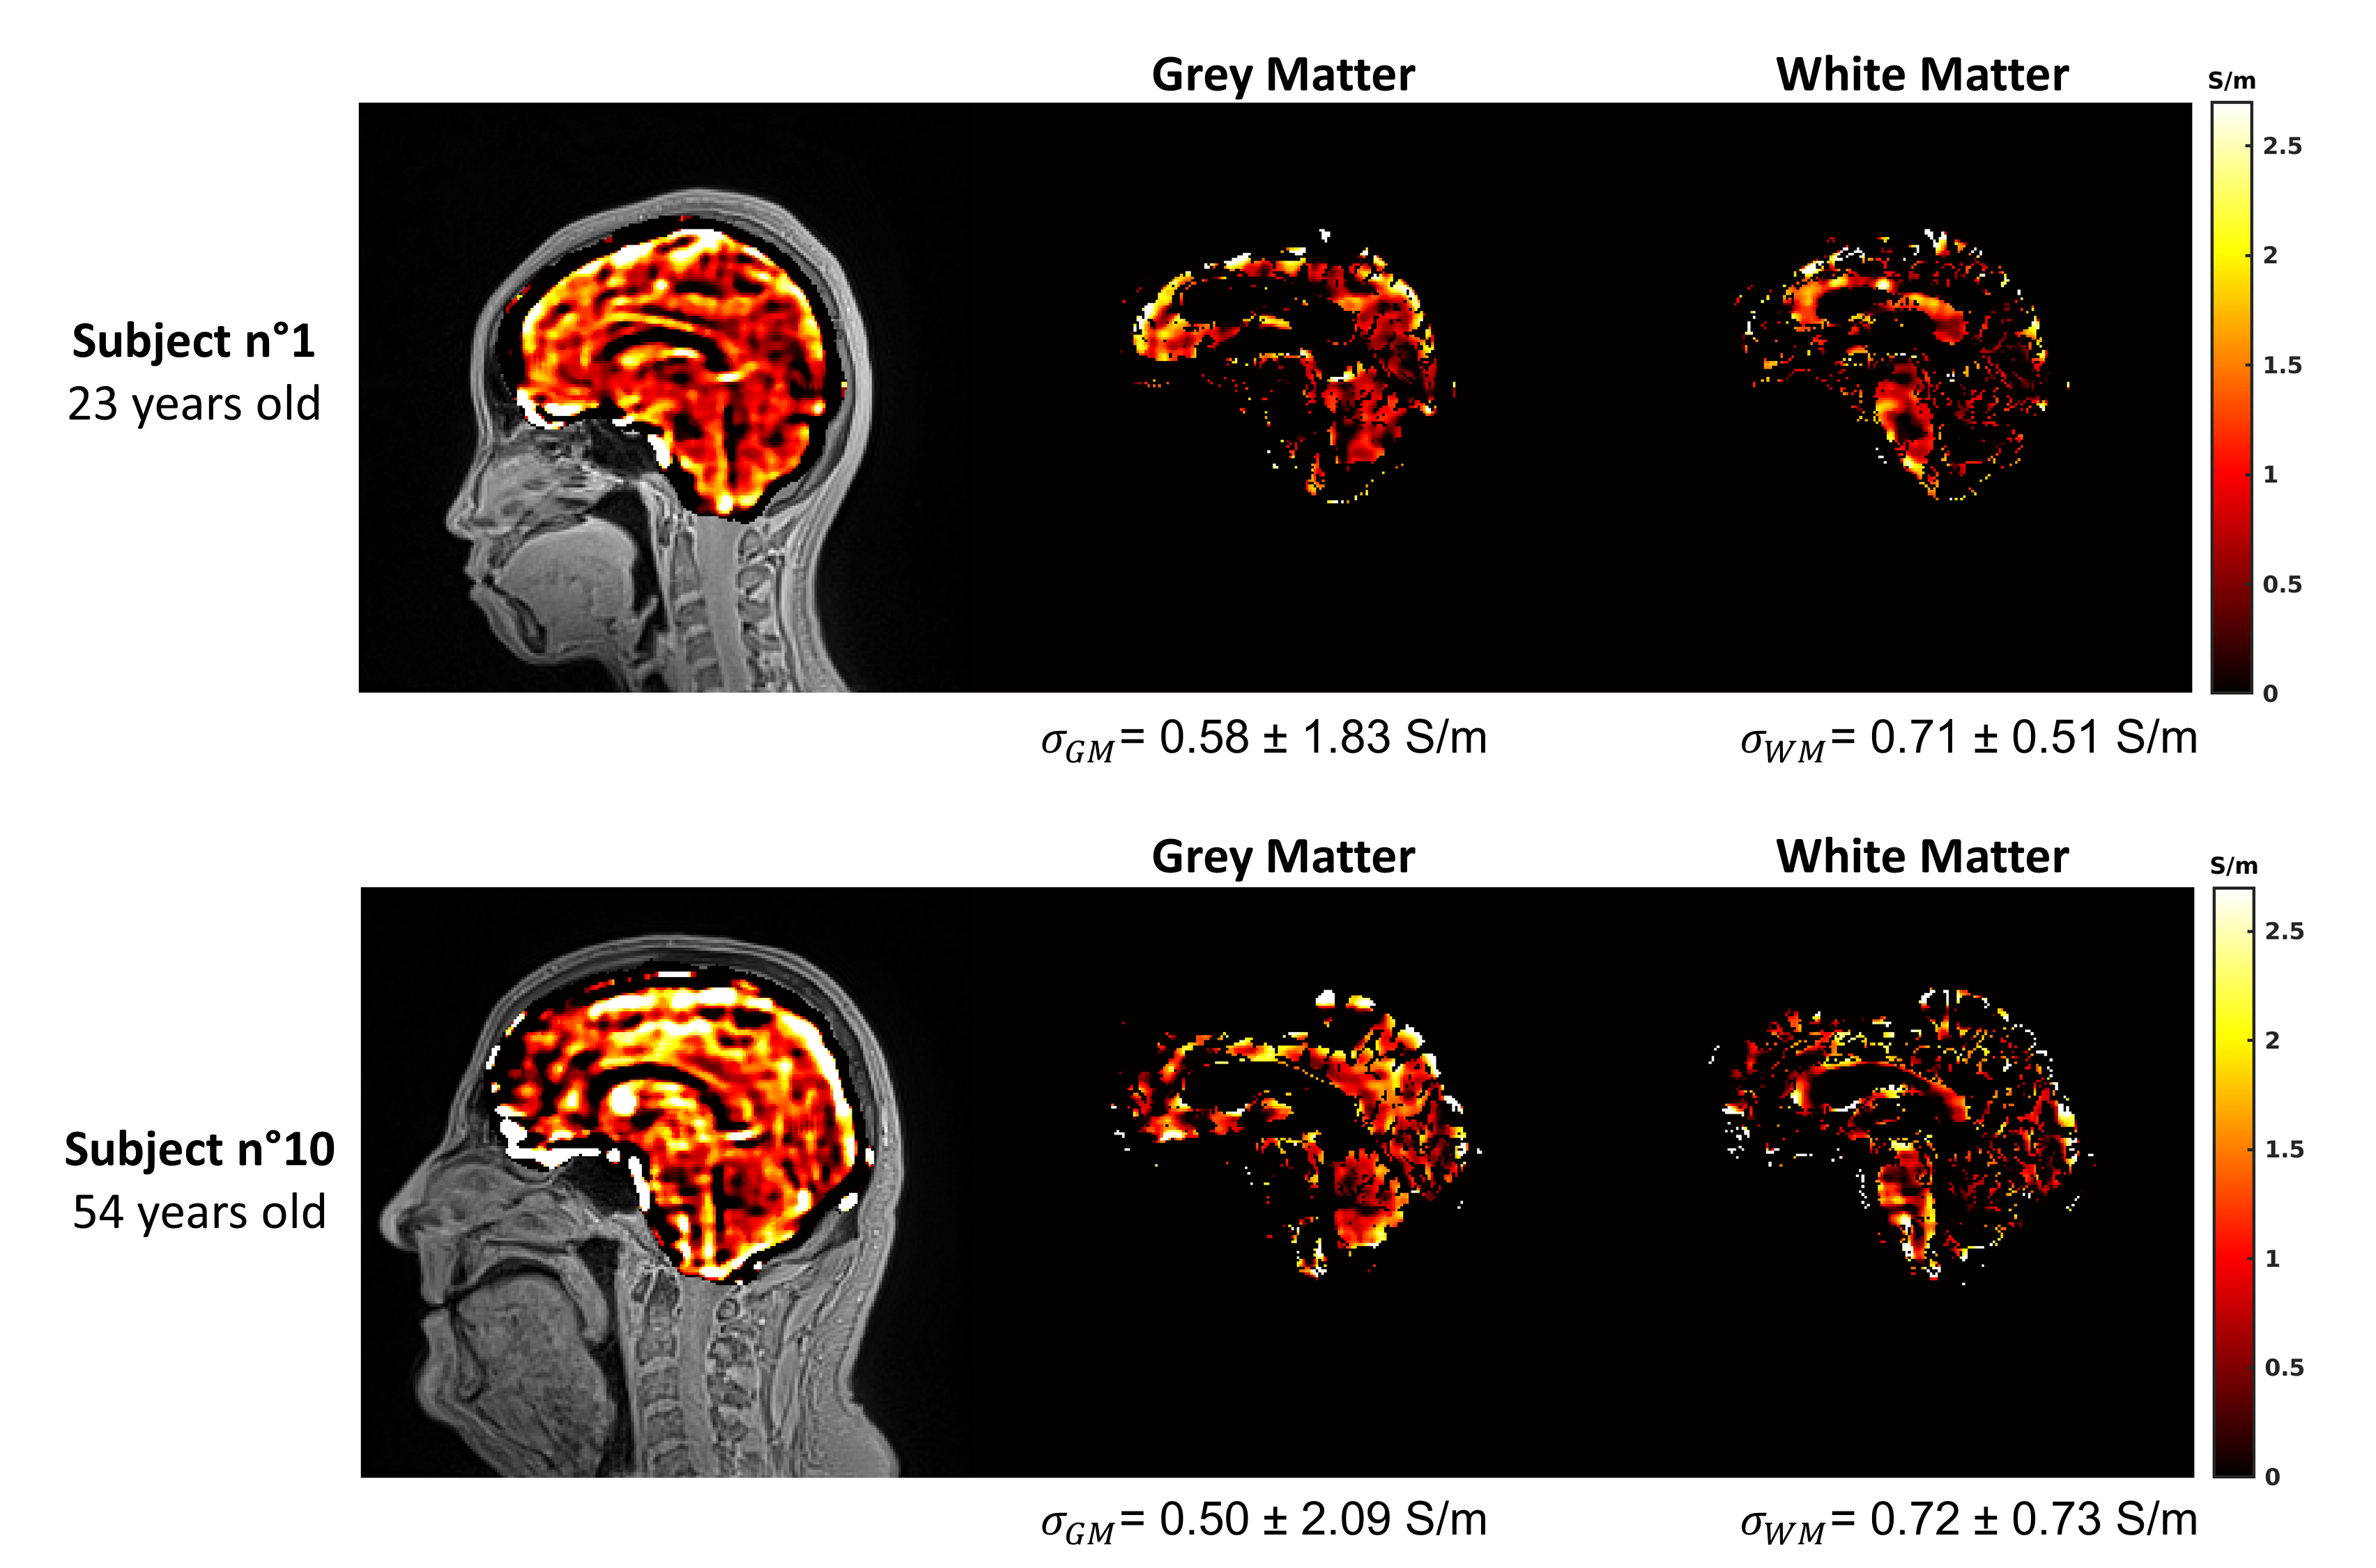
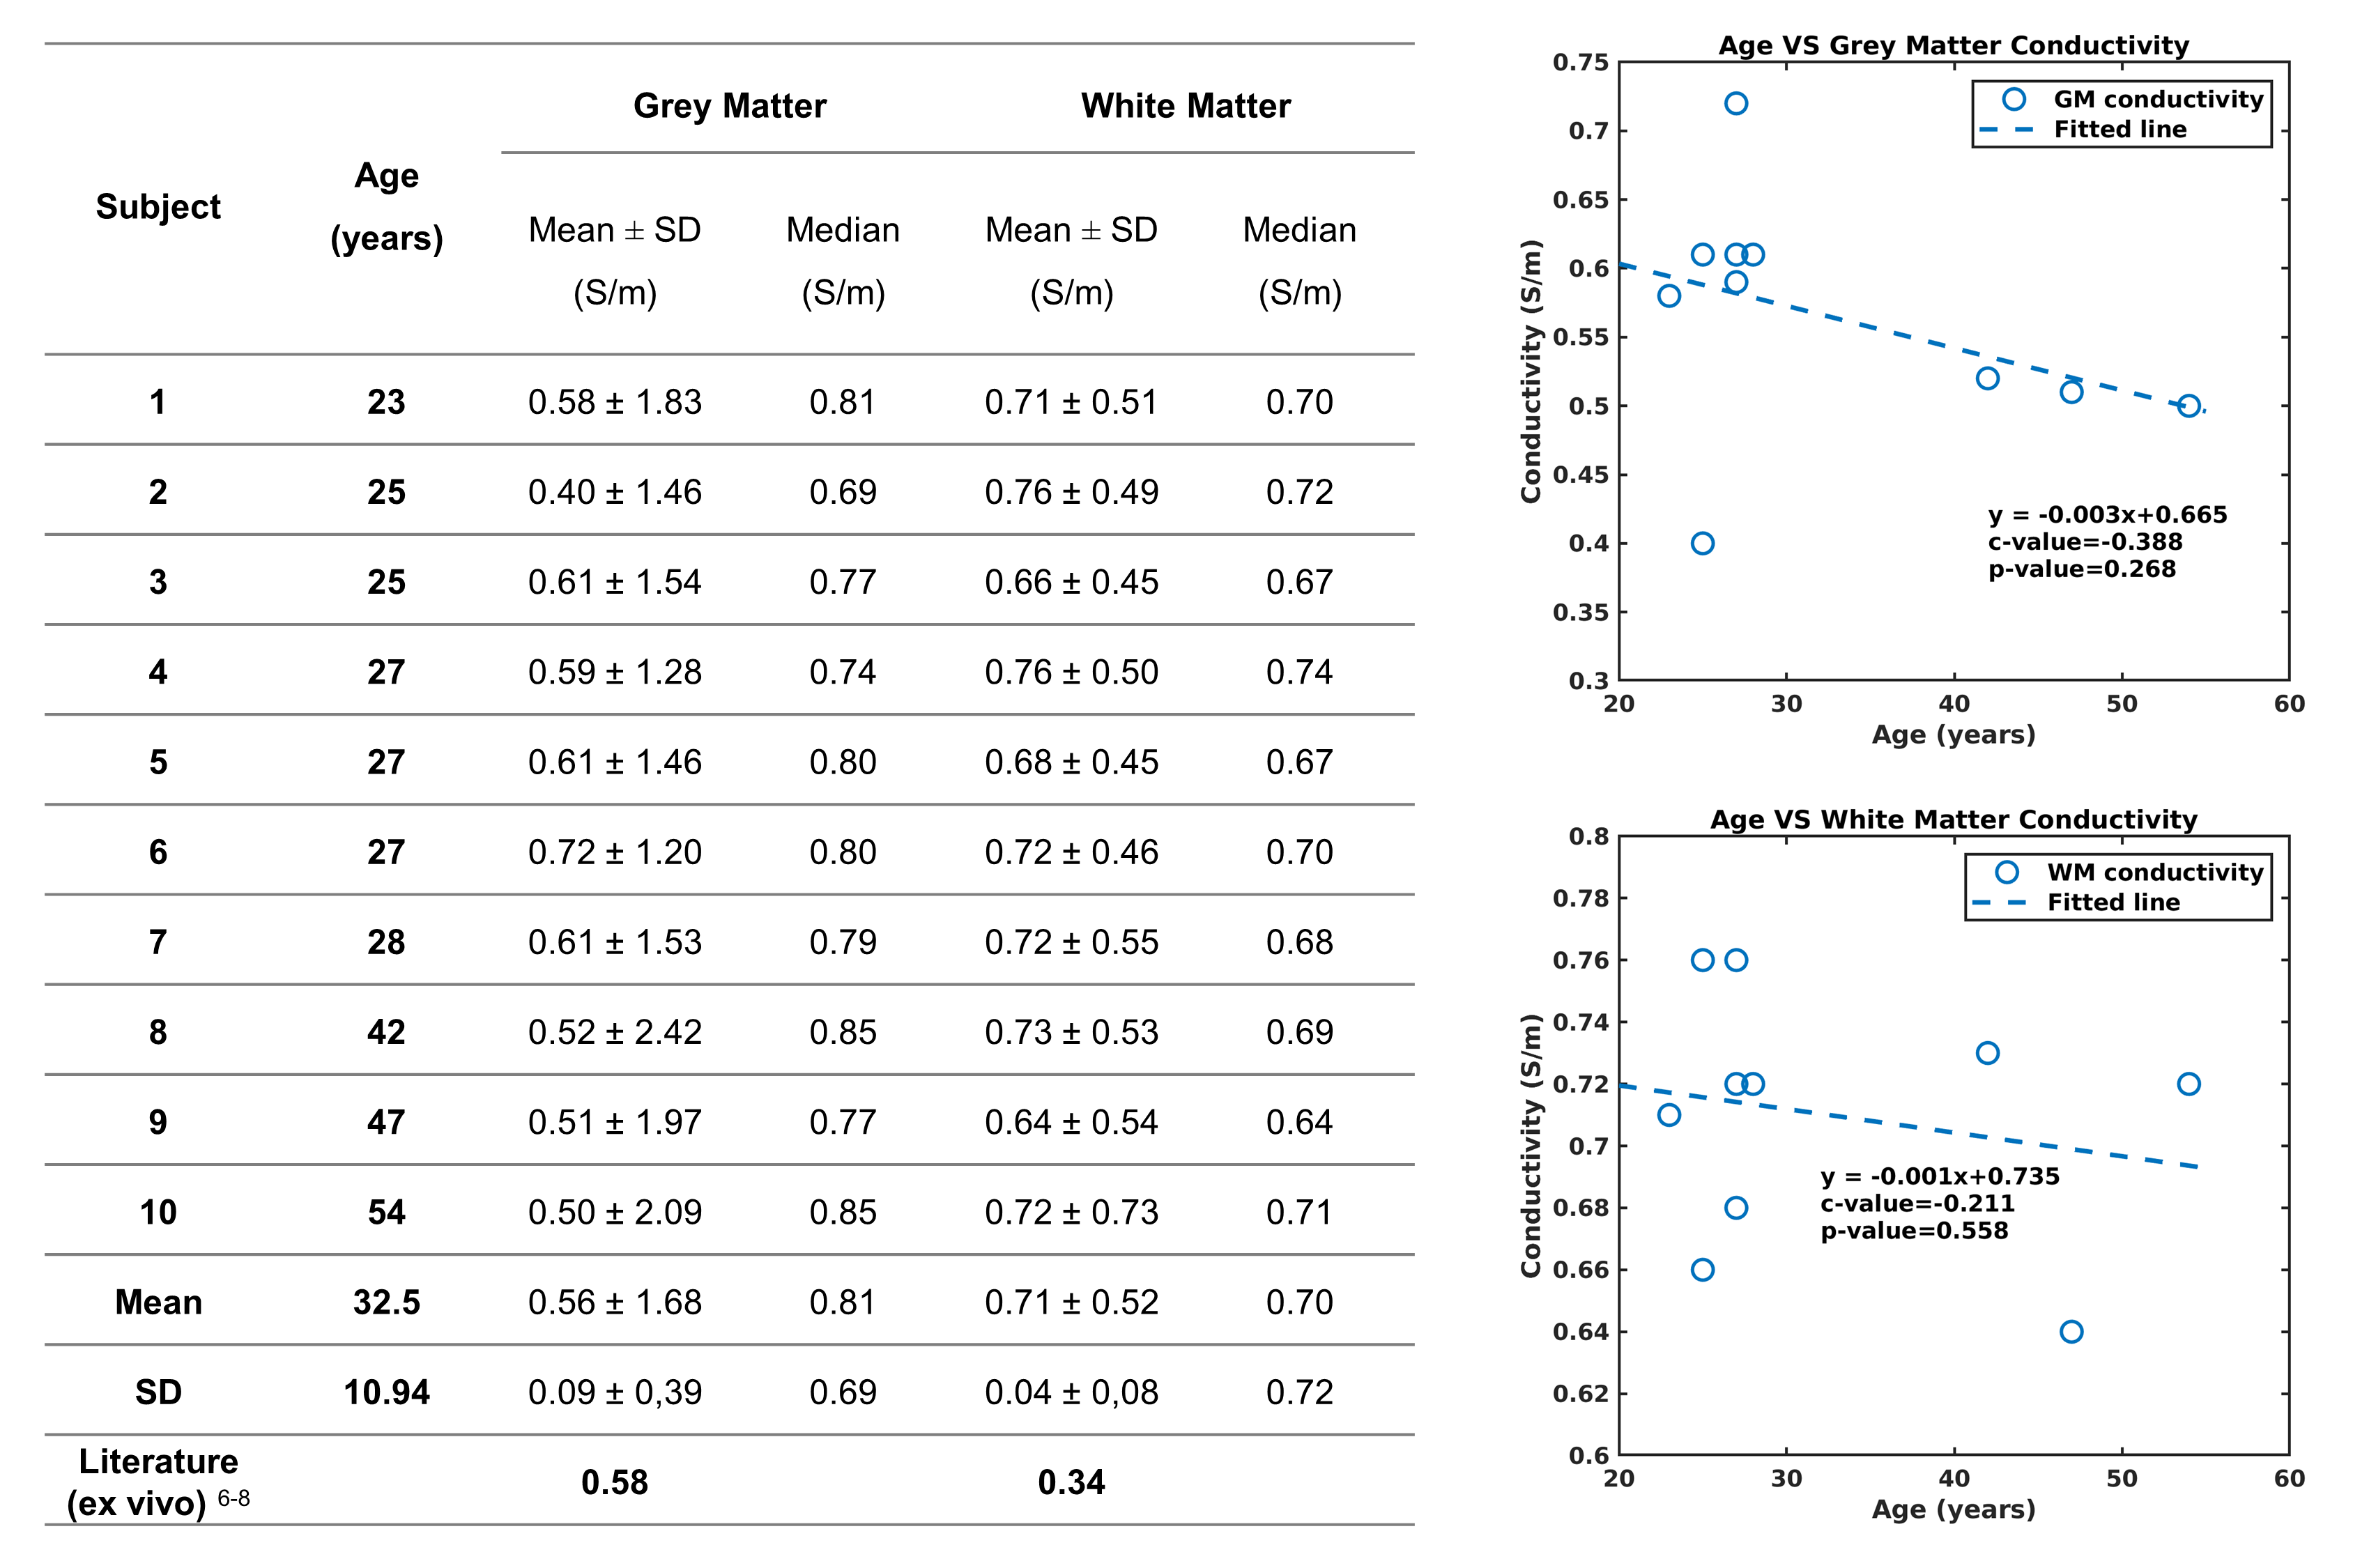
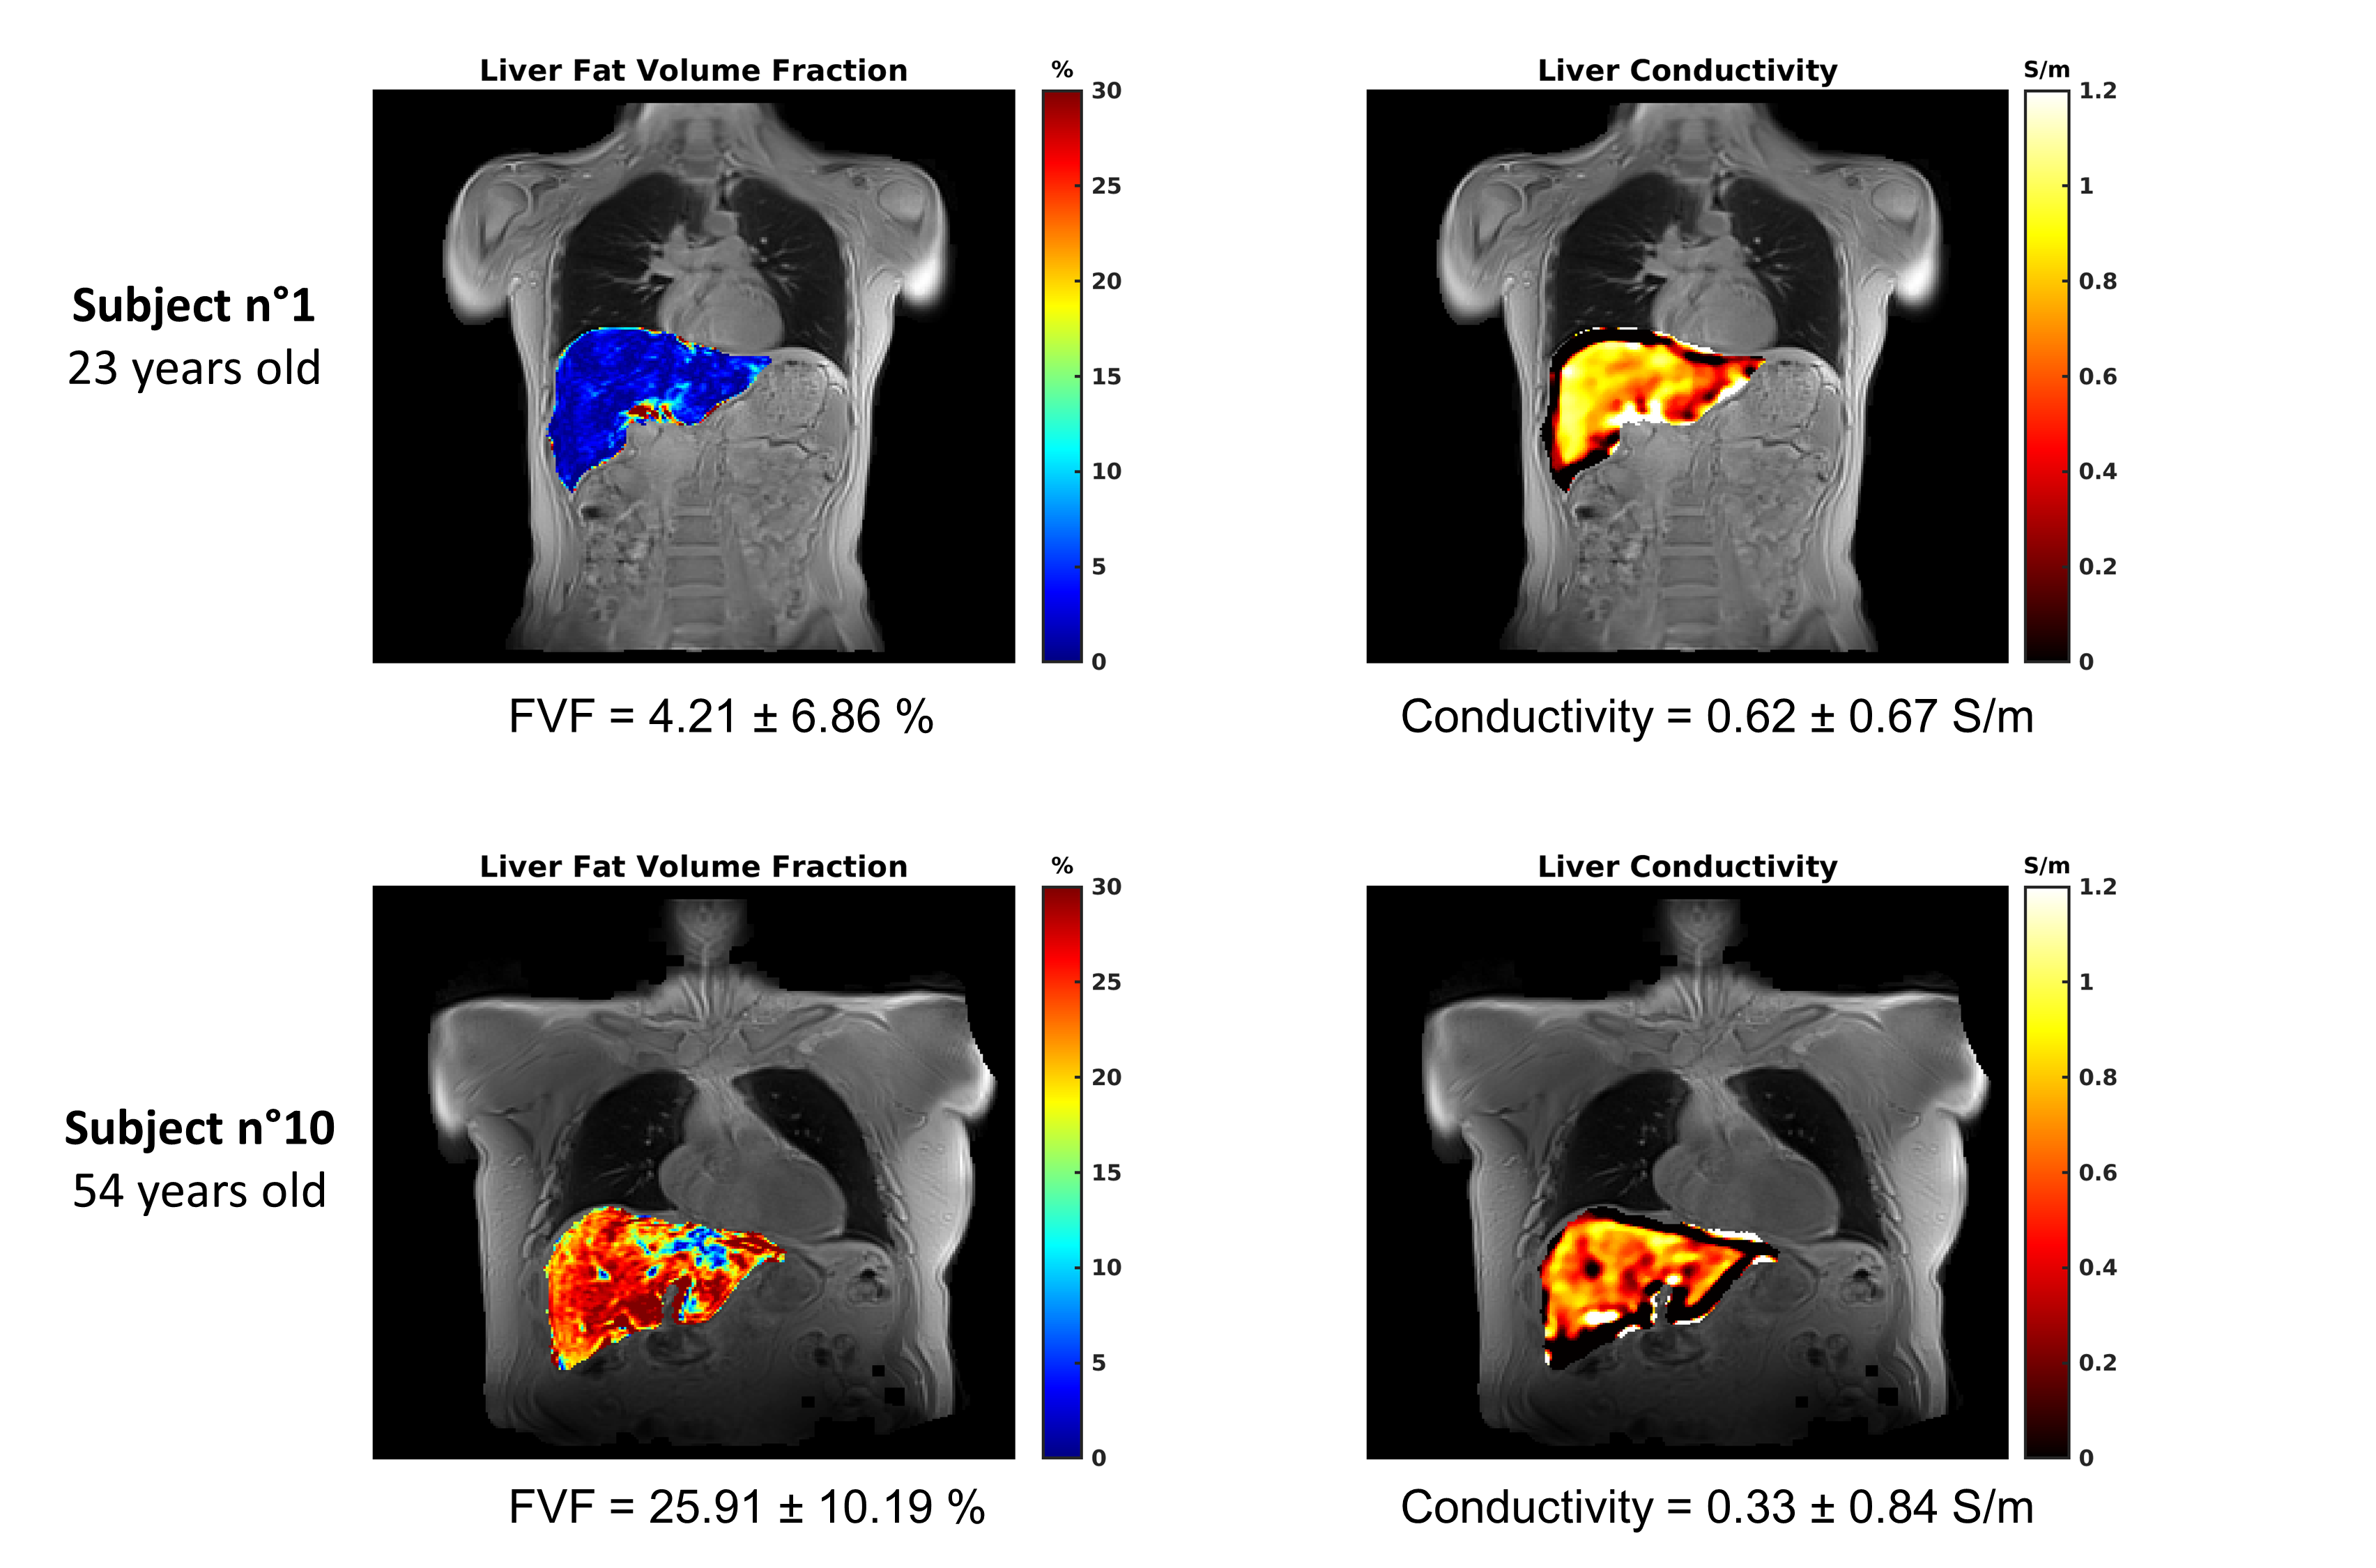
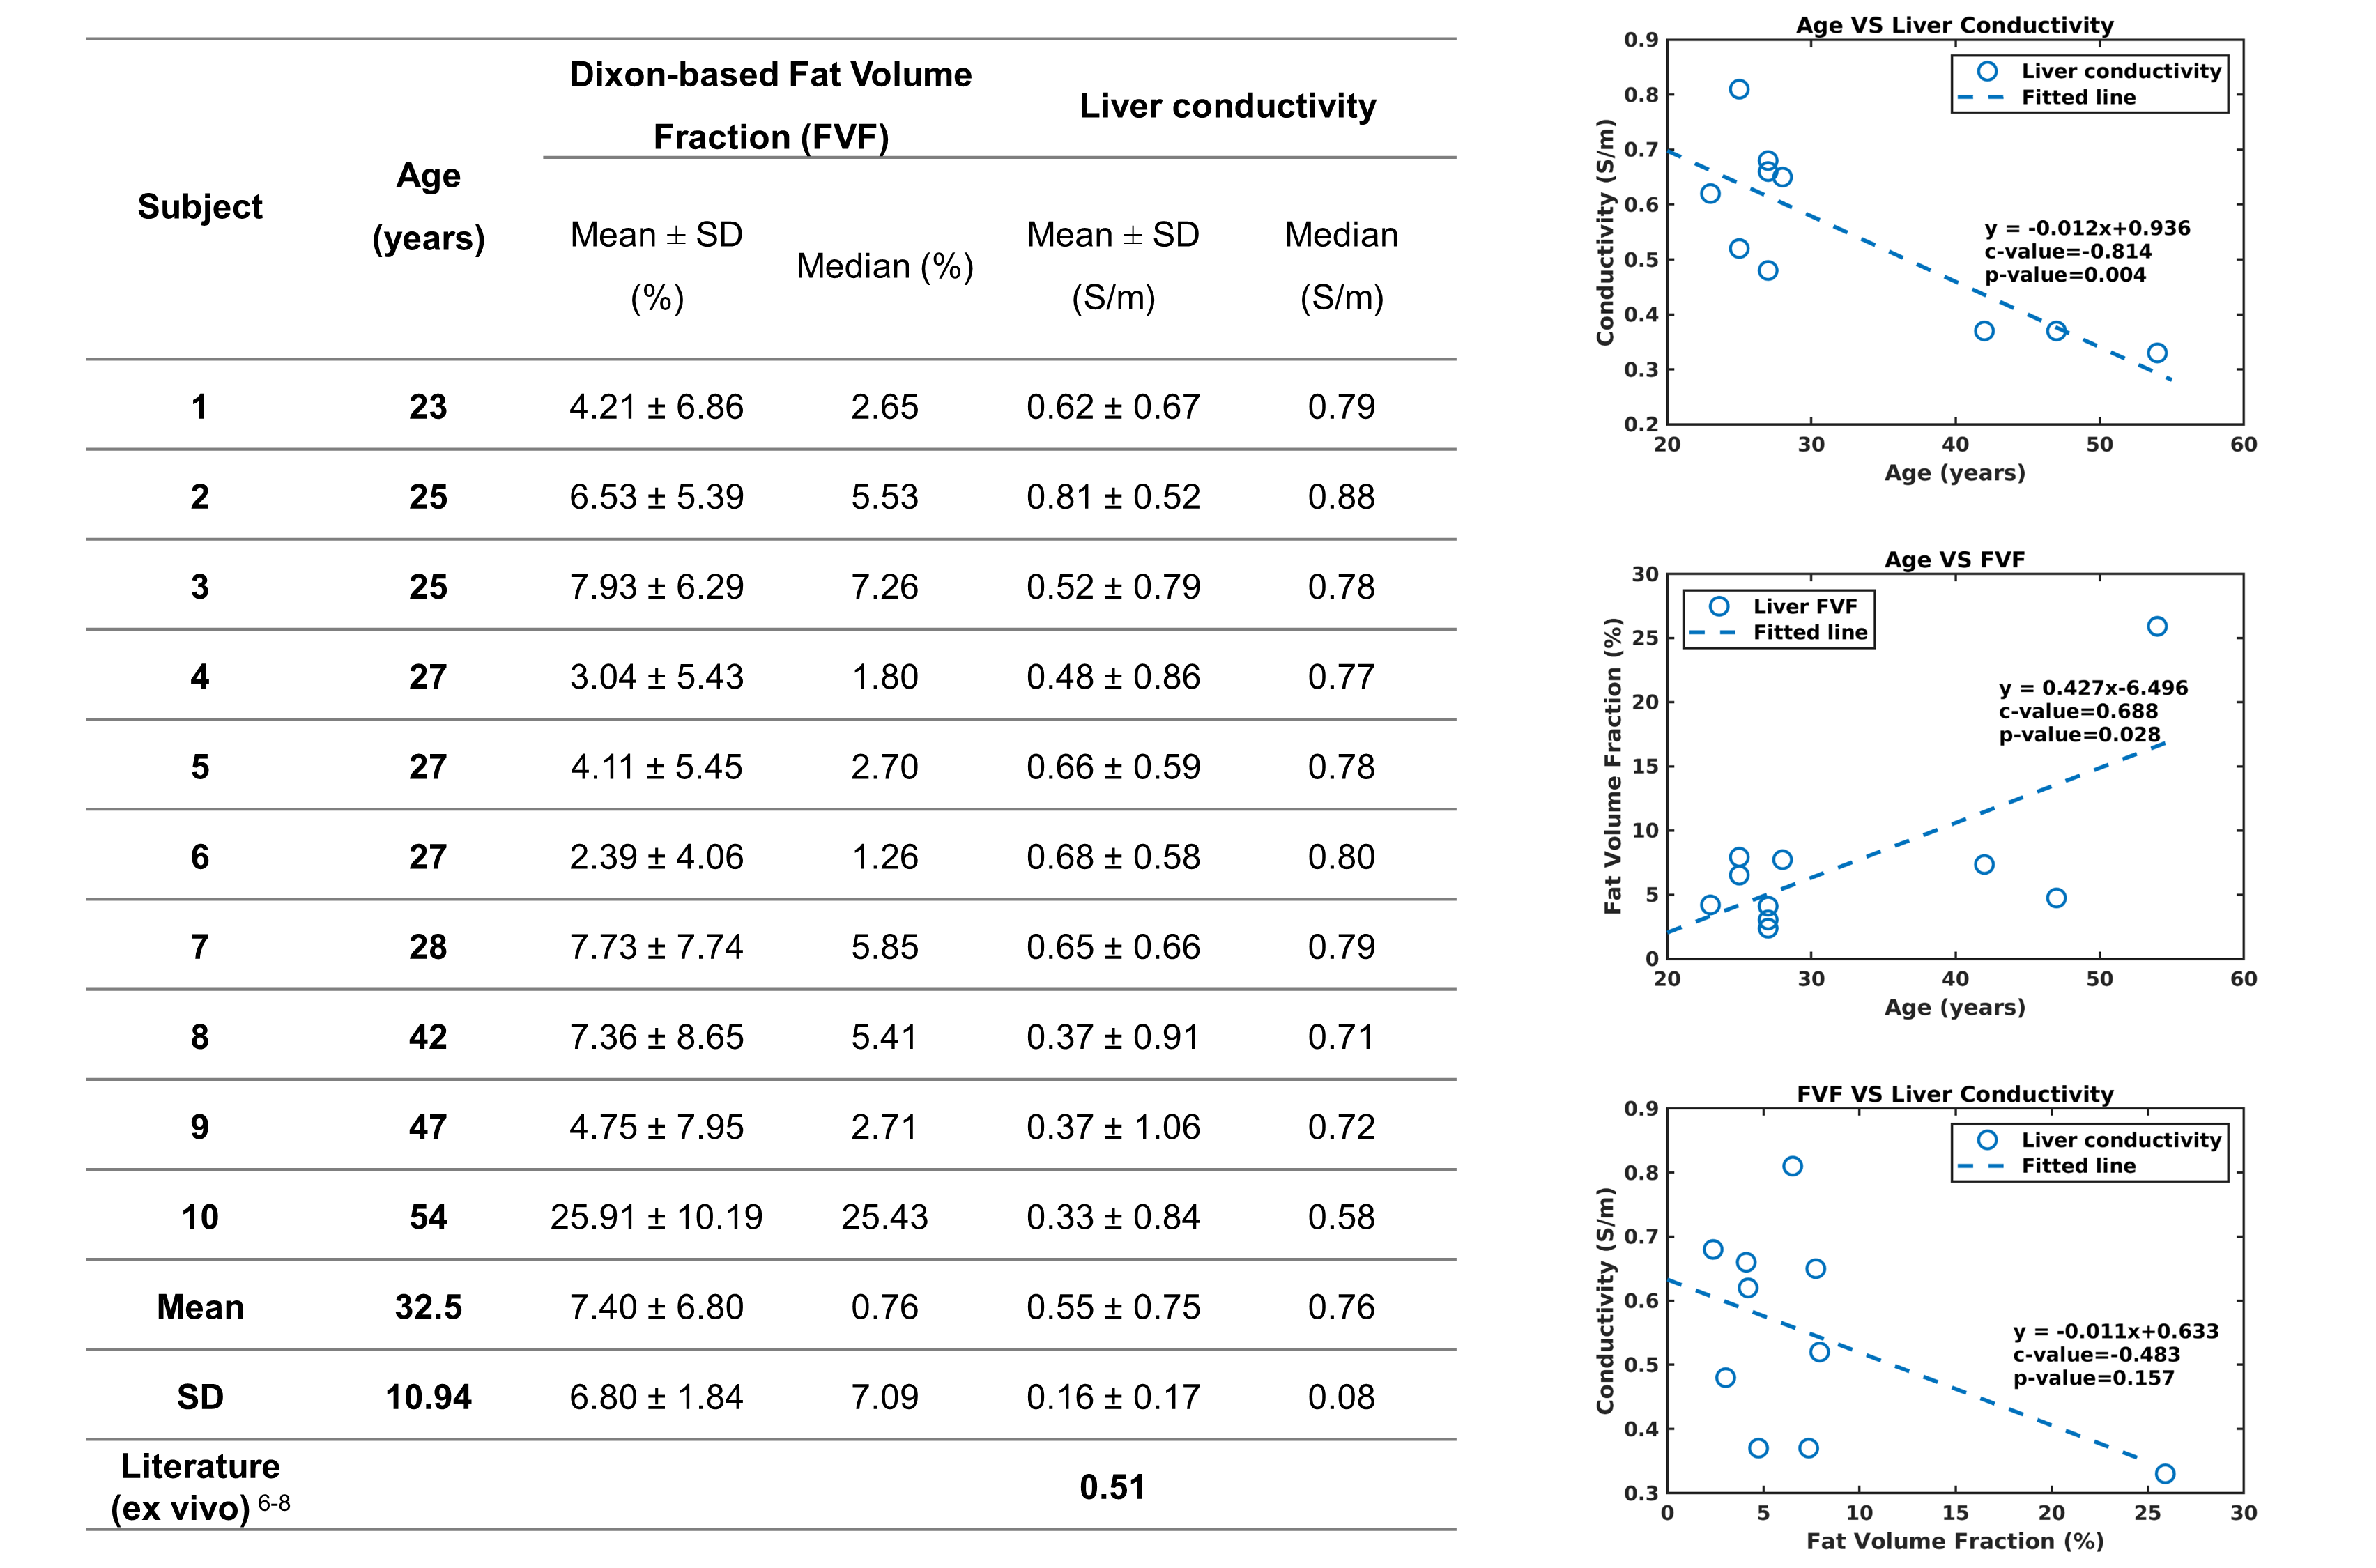
Results in phantoms (Figure 1) show excellent agreement between ground truth and MRI measurements. Brain conductivity maps of two subjects are shown in Figure 2. In-vivo conductivity mean values in the brain were: 0.56 ± 0.09 S/m (grey matter, GM), 0.71 ± 0.04 S/m (white matter, WM). The WM value was higher than that reported in the literature for ex-vivo human studies 6–8 : 0.34 S/m (WM). No significant changes with age (Figure 3) were observed (p-value > 0.05). Liver FVF and conductivity maps of two subjects are shown in Figure 4. In-vivo conductivity values in the liver were 0.55 ± 0.16 S/m (vs. 0.51 S/m in the literature 6–8). Significant correlations (Figure 5) were found between age and conductivity (r = -0.814, p = 0.004), and between age and FVF (r = 0.688, p = 0.028).DISCUSSION
It is expected to measure higher conductivities in-vivo compared to ex-vivo, as shown in Peyman et al., 2007 9 in animals (0.09 S/m higher values in-vivo at 150 MHz in pigs). However, this may not explain the difference measured in this study which is larger 0.71 S/m in WM. Few ex-vivo data are available. Age-related changes in the brain were not expected in the age range of this study (23 to 54 years old), but would be expected between children/adults/elderly people10. Age-related changes in the liver are expected, and our results in comparison with FVF are consistent with the literature 1.CONCLUSION
This study needs to be confirmed by larger studies to clarify the actual range of conductivity values in different organs in-vivo, and check whether it is relevant to use values from ex-vivo or animal studies. Age-related changes also need to be investigated more thoroughly, as shown in the liver here, where conductivity ranged from 0.33 to 0.81 S/m. This could have a significant impact on SAR studies.Acknowledgements
Funding: ANR-21-CE19-0040 (ELECTRA project), CPER IT2MP, FEDER (European Regional Development Fund). The authors thank Thomas Benkert (PhD, Application Development, Siemens Healthcare GmbH, Erlangen, Germany) for providing the UTE sequence.References
- Ulbrich EJ, Fischer MA, Manoliu A, et al. Age- and Gender Dependent Liver Fat Content in a Healthy Normal BMI Population as Quantified by Fat-Water Separating DIXON MR Imaging. Zhang Z, ed. PLoS ONE. 2015;10(11):e0141691. doi:10.1371/journal.pone.0141691.
- Mugler JP, Fielden SW, Meyer CH, et al. Breath‐hold UTE lung imaging using a stack-of-spirals acquisition. In: 23rd Annual Meeting International of the Society for Magnetic Resonance in Medicine. Toronto, Canada; 2015:1476.
- He Z, Doguet M, Soullié P, De Sousa PL, Lefebvre P, Odille F. Comparison and validation of multiple MR-EPT methods with ground truth vector network analyzer measurements. In: London, England, UK; 2022:2910. doi:10.58530/2022/2910
- Lee SK, Bulumulla S, Wiesinger F, Sacolick L, Sun W, Hancu I. Tissue Electrical Property Mapping from Zero Echo-Time Magnetic Resonance Imaging. IEEE Trans Med Imaging. 2015;34(2):541-550. doi:10.1109/TMI.2014.2361810
- Reeder SB, Sirlin CB. Quantification of Liver Fat with Magnetic Resonance Imaging. Magnetic Resonance Imaging Clinics of North America. 2010;18(3):337-357. doi:10.1016/j.mric.2010.08.013
- Gabriel C, Gabriel S, Corthout E. The dielectric properties of biological tissues: I. Literature survey. Phys Med Biol. 1996;41(11):2231-2249. doi:10.1088/0031-9155/41/11/001
- Gabriel S, Lau RW, Gabriel C. The dielectric properties of biological tissues: II. Measurements in the frequency range 10 Hz to 20 GHz. Phys Med Biol. 1996;41(11):2251-2269. doi:10.1088/0031-9155/41/11/002
- Gabriel S, Lau RW, Gabriel C. The dielectric properties of biological tissues: III. Parametric models for the dielectric spectrum of tissues. Phys Med Biol. 1996;41(11):2271-2293. doi:10.1088/0031-9155/41/11/003
- Peyman A, Holden SJ, Watts S, Perrott R, Gabriel C. Dielectric properties of porcine cerebrospinal tissues at microwave frequencies: in vivo , in vitro and systematic variation with age. Phys Med Biol. 2007;52(8):2229-2245. doi:10.1088/0031-9155/52/8/013
- Gabriel C, Peyman A. Dielectric Properties of Biological Tissues; Variation With Age. In: Conn’s Handbook of Models for Human Aging. Elsevier; 2018:939-952. doi:10.1016/B978-0-12-811353-0.00069-5
Figures