3685
Added Value of Electrical Conductivity Information to Apparent Diffusion Coefficient in Distinguishing Thoracic Lesions1Laboratory for Biomarker Imaging Science, Hokkaido University Graduate School of Medical Science and Engineering, Sapporo, Japan, 2Philips Research Laboratories, Hamburg, Germany, 3Department of Respiratory Medicine, Hokkaido University Faculty of Medicine, Sapporo, Japan, 4Department of Diagnostic Imaging, Hokkaido University Faculty of Medicine, Sapporo, Japan, 5Global Center for Biomedical Science and Engineering, Hokkaido University Faculty of Medicine, Sapporo, Japan
Synopsis
Keywords: Electromagnetic Tissue Properties, Electromagnetic Tissue Properties
Motivation: The electrical conductivity (σ) has been proven as helpful for glioma and breast cancer characterization. Our prior study also suggests its potential utility in distinguishing benign and malignant thoracic lesions.
Goal(s): This study aimed to evaluate the added value of σ to thoracic lesion diagnosis by apparent diffusion coefficient (ADC).
Approach: In this prospective study, we used radiomics analysis to evaluate the prediction value of ADC and σ. The diagnostic performance of selected ADC, σ, and composite indices were compared.
Results: 7 independent features were identified in 21 lesions. Half of the top 4 features were from σ. All indices achieved excellent performance.
Impact: The results of this preliminary study highlight the potential usefulness of noninvasive electrical conductivity (σ) measurement in the characterization of thoracic lesions.
Introduction
Apparent diffusion coefficient (ADC) derived from diffusion-weighted imaging (DWI) has been shown as useful in distinguishing between benign and malignant lung1 or mediastinal2 lesions. Electrical Properties Tomography (EPT) is a recently developed MRI technique that mathematically estimates tissues' electrical conductivity (σ) from phase. Its potential clinical usefulness has been documented in gliomas3 and breast cancers4. The potential usefulness in thoracic lesions has also been proposed5, but the added value of EPT to currently available MRI sequences is unknown. Radiomics has allowed medical images to be transformed into high throughput data that provide more complete information6. It has detected new diagnostic markers otherwise undetectable by conventional imaging analytics7. Implementing radiomics, along with the addition of σ map, may render meaningful quantitative MRI indices that distinguish benign and malignant thoracic lesions. This study aimed to conduct radiomic analysis to determine the added value of σ to thoracic lesion diagnosis by ADC.Methods
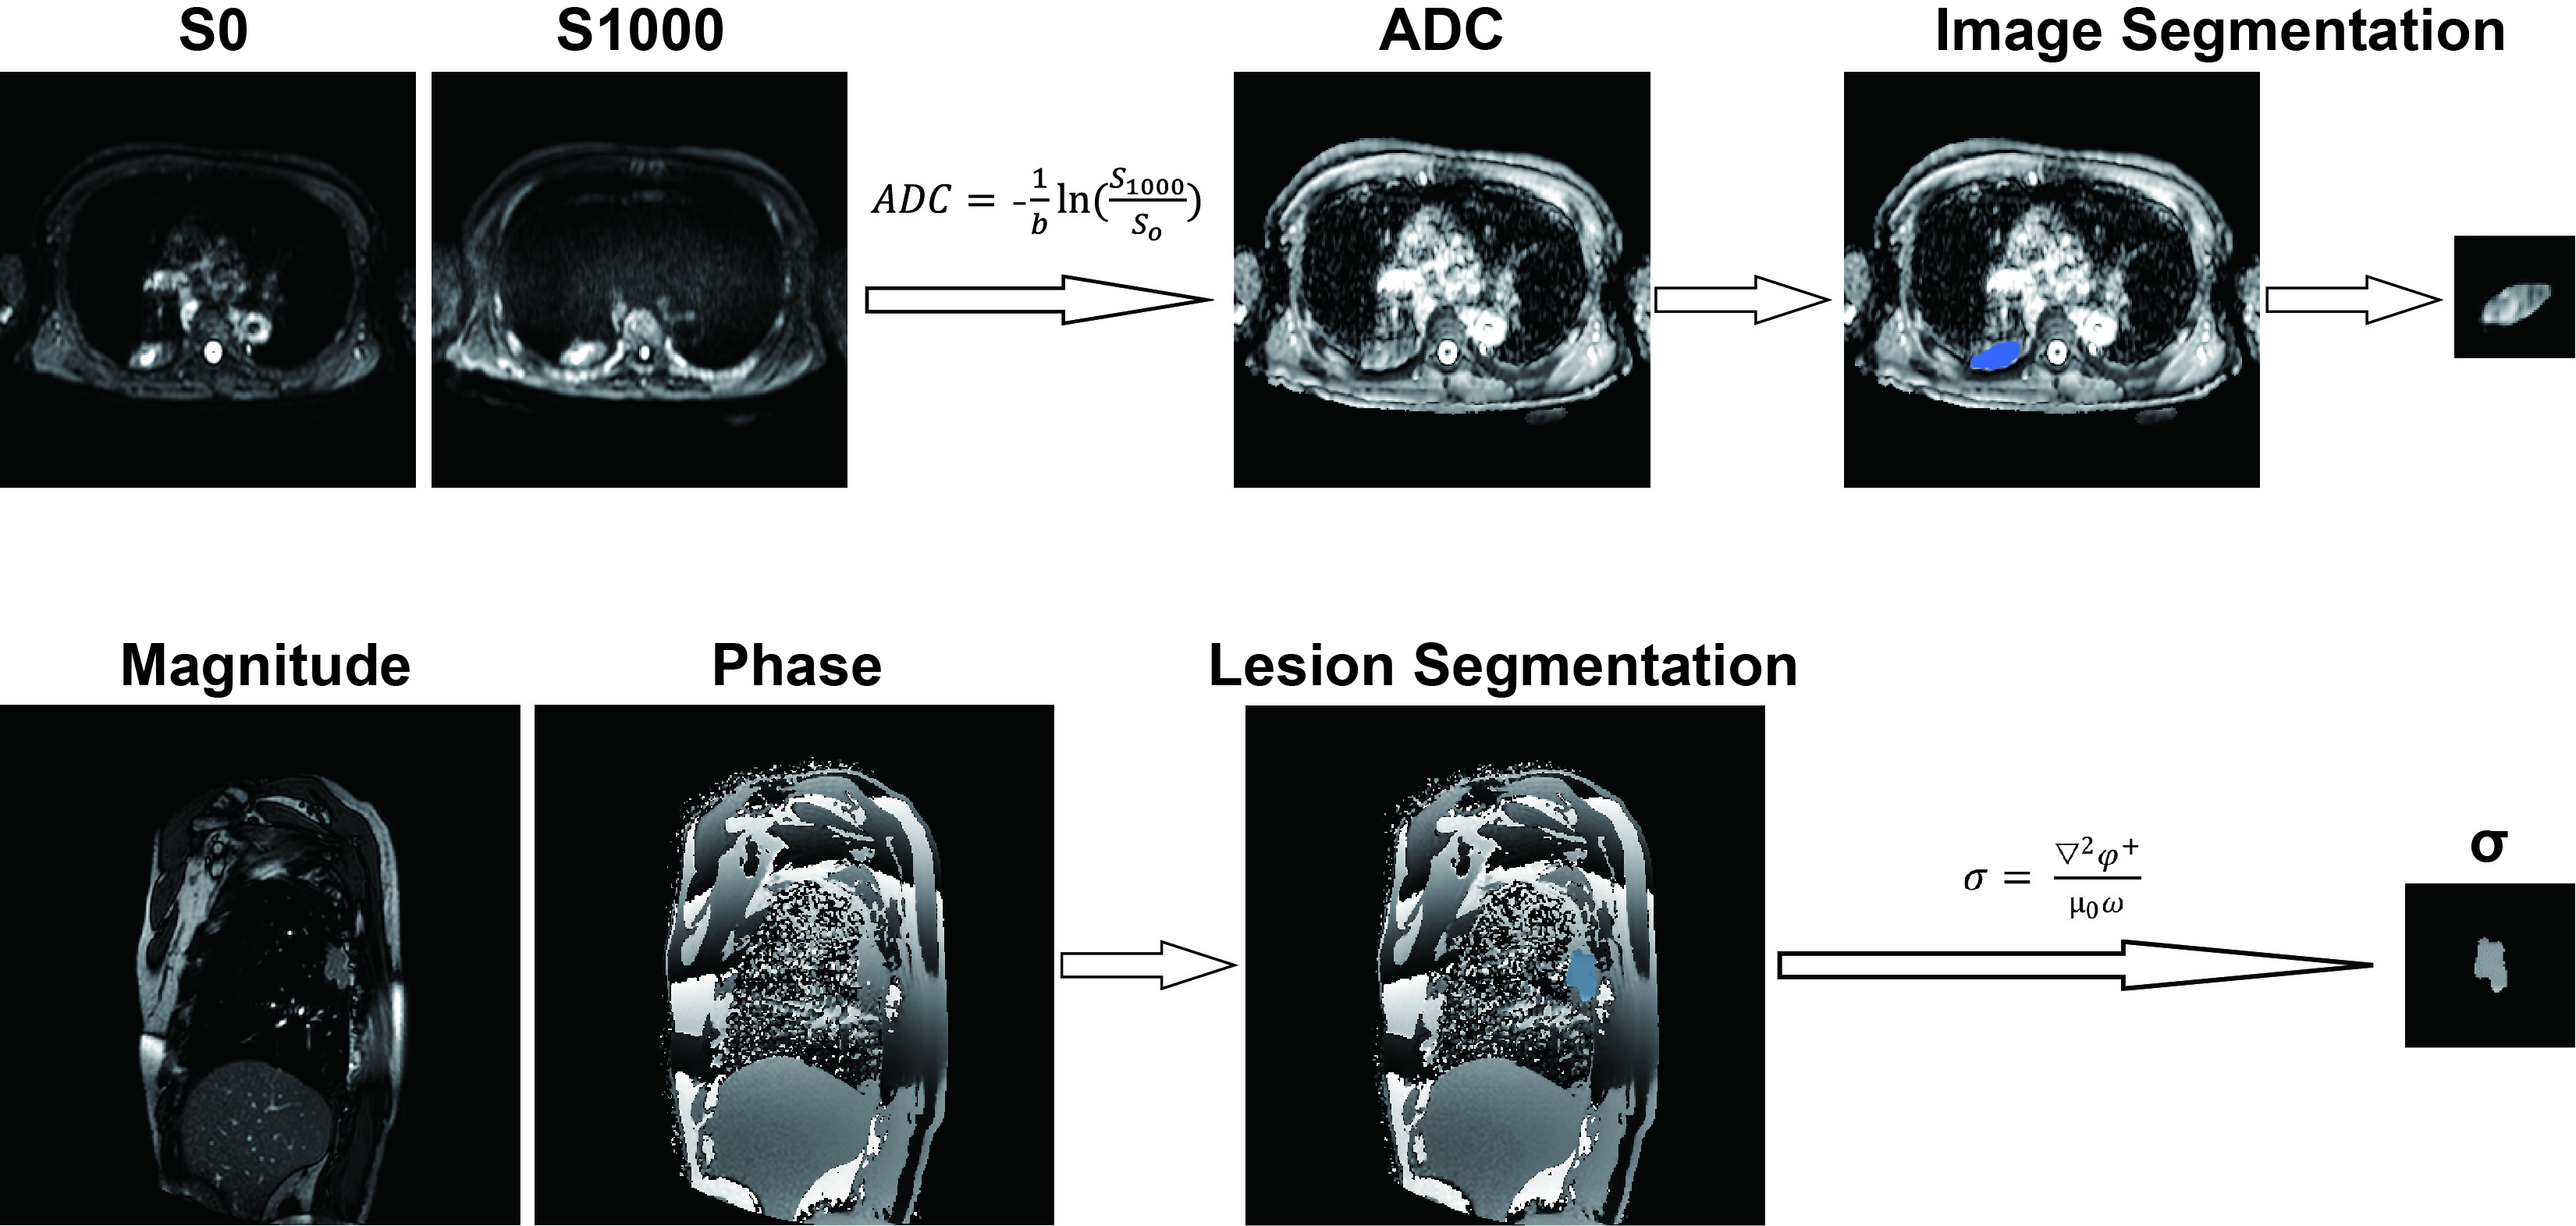
Twenty-three treatment-naïve patients with lung (N = 21) or mediastinal (N = 2) lesions who underwent DWI and EPT were enrolled. Exclusion criteria were: contraindications to MRI, motion artifacts and difficult lesion segment. MRI was performed using a 1.5T scanner (Achieva, Philips Healthcare). An axial 2D-spin echo-echo planar imaging was employed for DWI (TR/TE = 5656.3/65.7 ms, NSA = 3, Voxel size = 2.73×3.43×6 mm, number of slices = 40, b value = 0, 1000 s/mm2, no synchronization under free breath), while a sagittal 2D-steady state free precession (SSFP) sequence was used for EPT (TR/TE = 16/4 ms, FA = 30°, NSA = 2, Voxel size = 2×2×5 mm, number of slices = 1, non-selective pulse, 10 dynamic sessions under single breath-hold). ADC and σ were calculated by the formula ADC = (-1/b)×ln(Sb/S0) and σ = ▽2φ+/µ0ω, respectively, where Sb is the signal intensity at different b-values, φ+ is the phase of H+ (the positive circularized component of the magnetic field H+ = (Hx + iHy/2)), µ0 is magnetic vacuum permeability, and ω is Larmor frequency (Figure 1). A trained author drew regions of interest (ROIs) along the lesion contour and semi-automatically computed masks at ADC and σ images using 3D slicer. For each ROI, 837 radiomic features (histogram, texture, and wavelet transformation) were extracted from the corresponding ADC and σ maps using pyradiomics. Significant features were selected using student t-tests and least absolute shrinkage and selection operator (LASSO) logistic regression. Strict rules were applied so that there were no redundant features. Random forest was used for feature importance analysis. ADC, σ, and composite indices were built, and diagnostic performance was assessed by ROC analysis. P < 0.05 was considered statistically significant. Statistical analysis was performed using R.Results
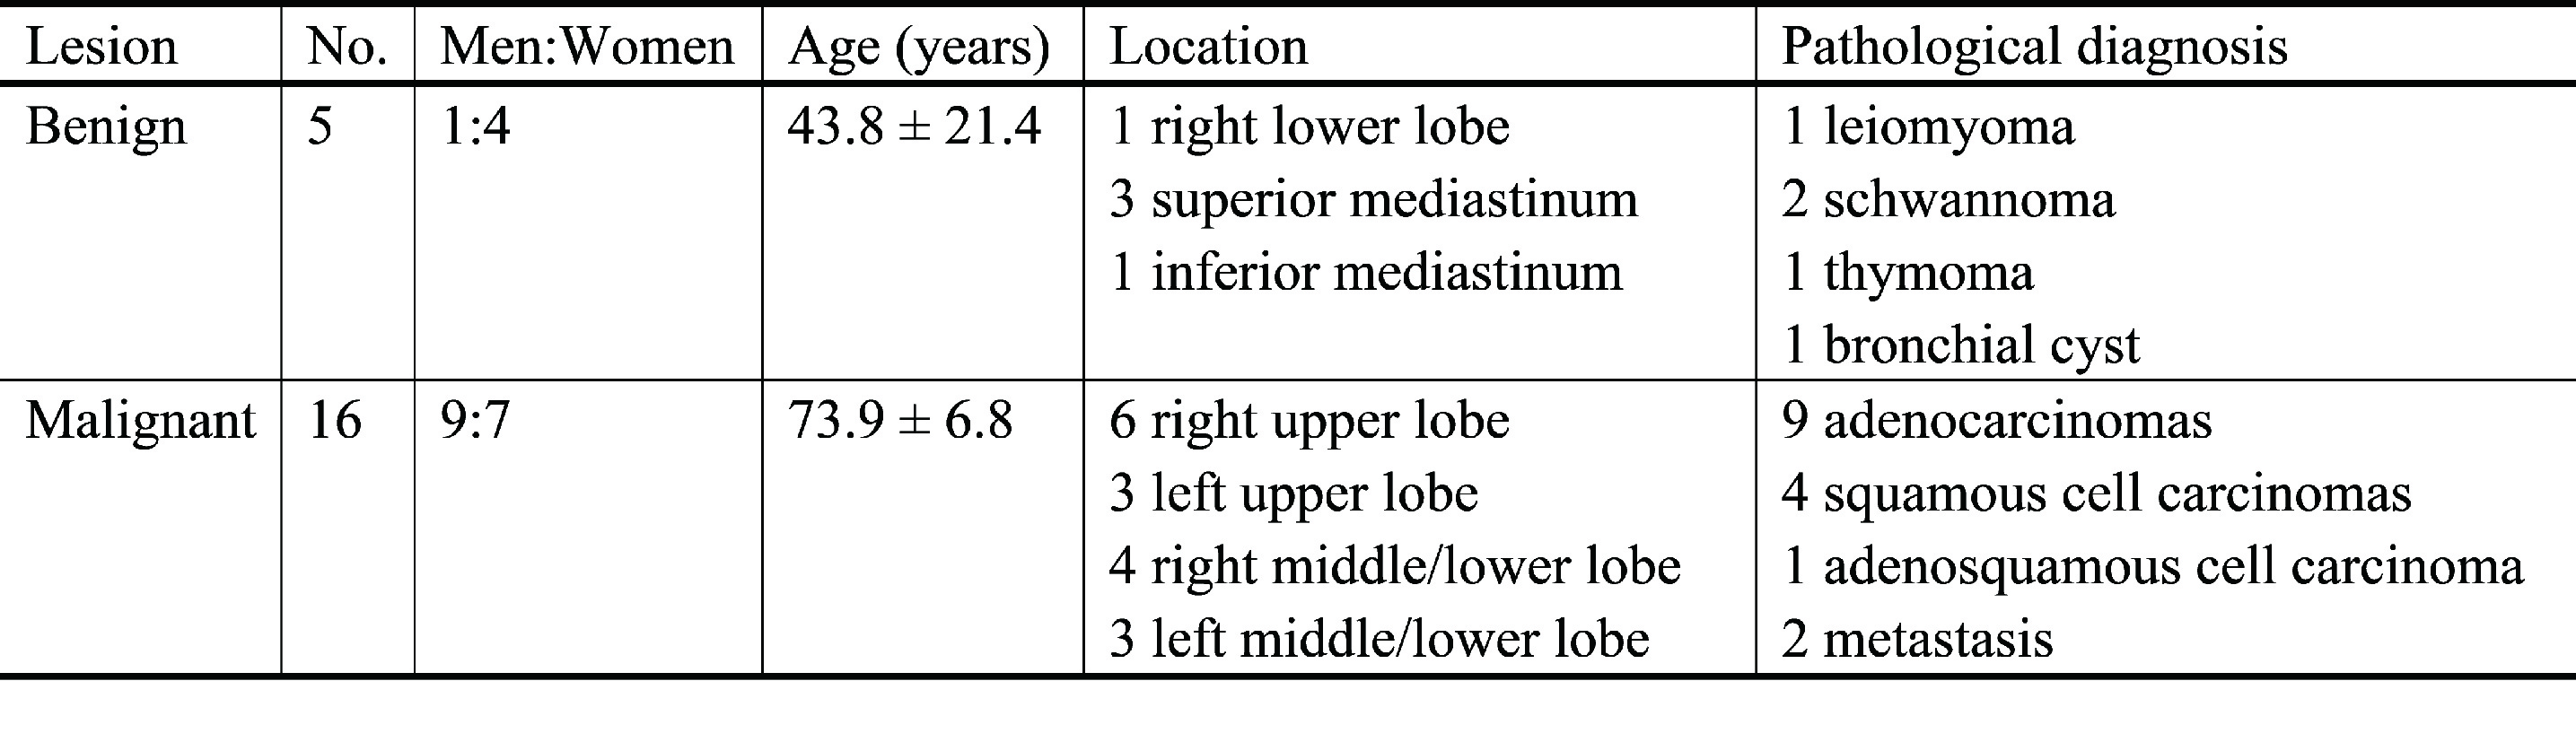
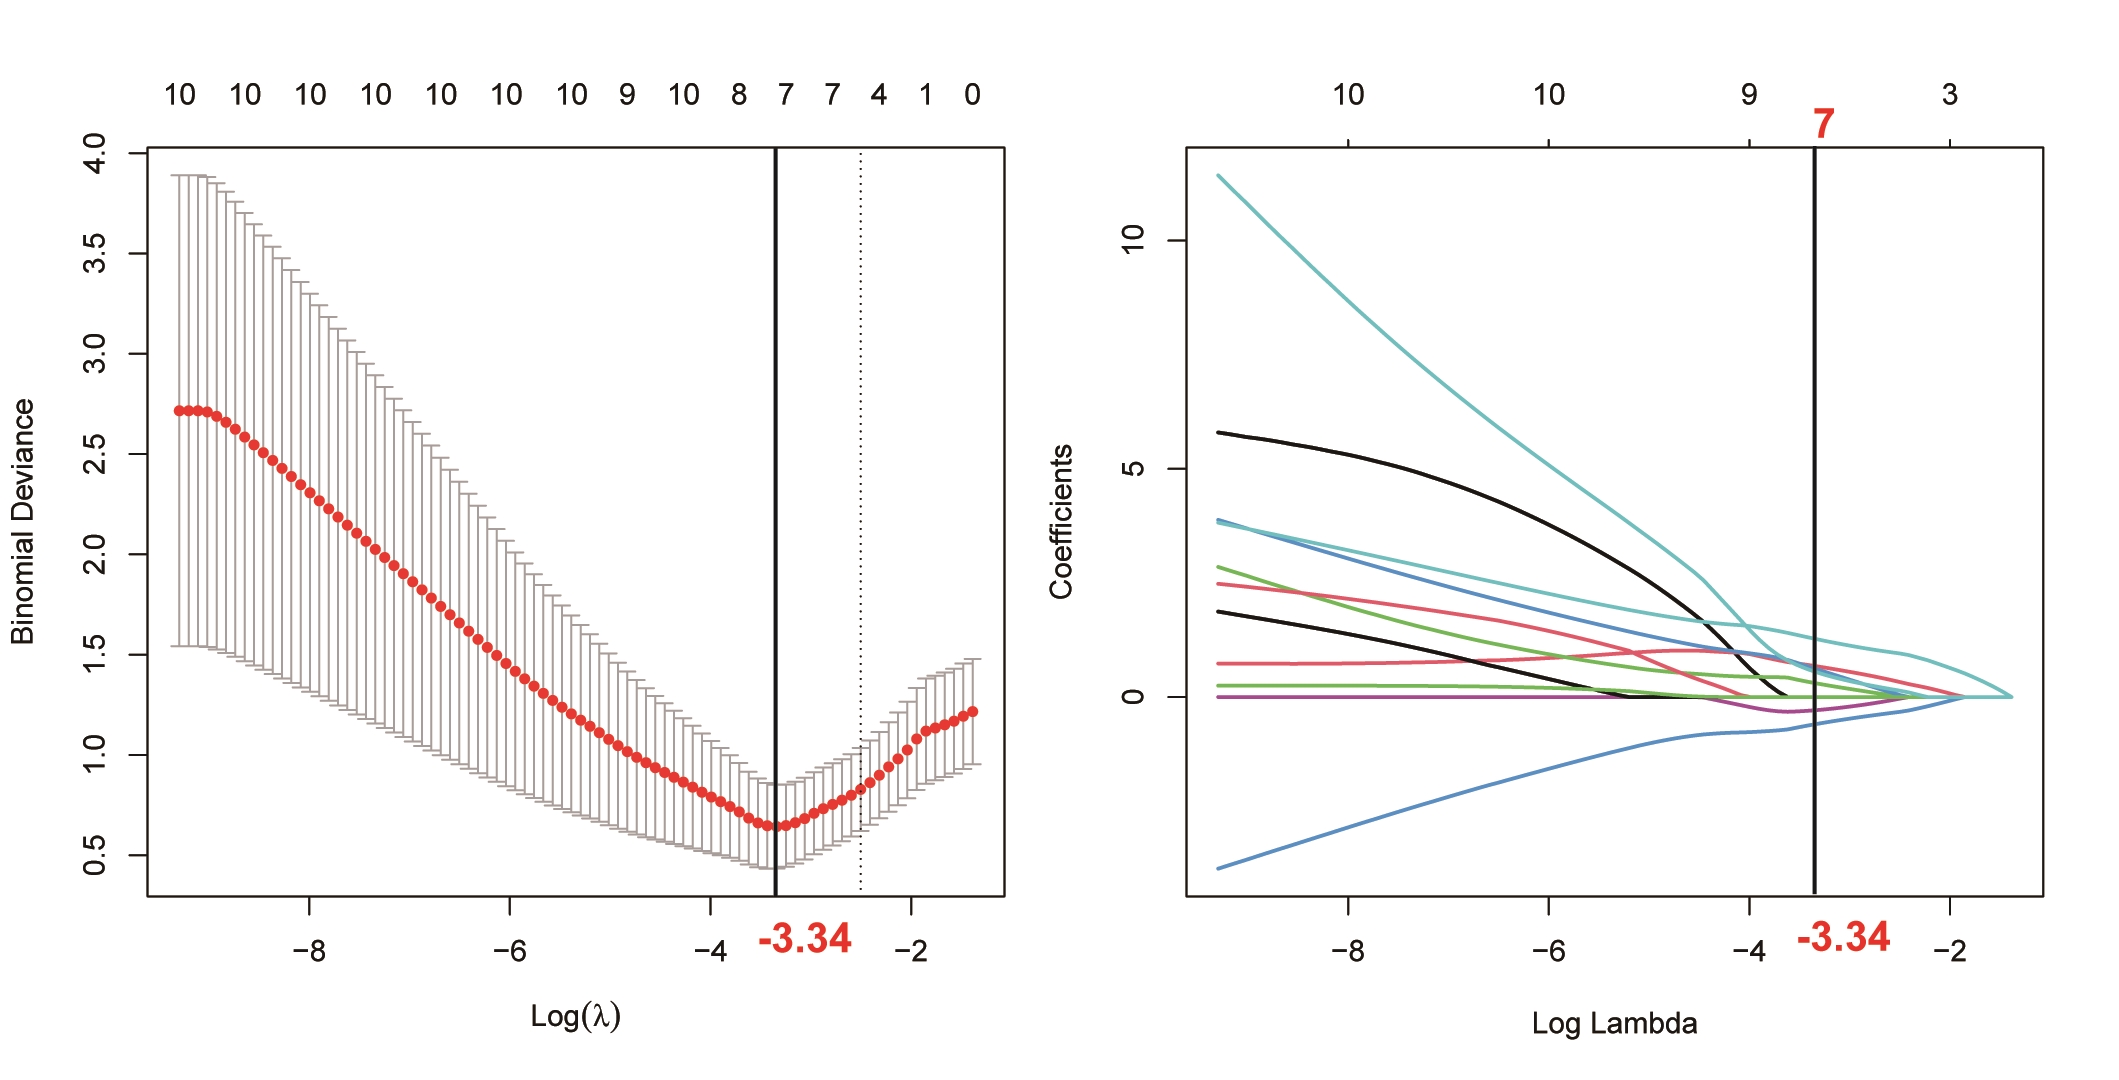
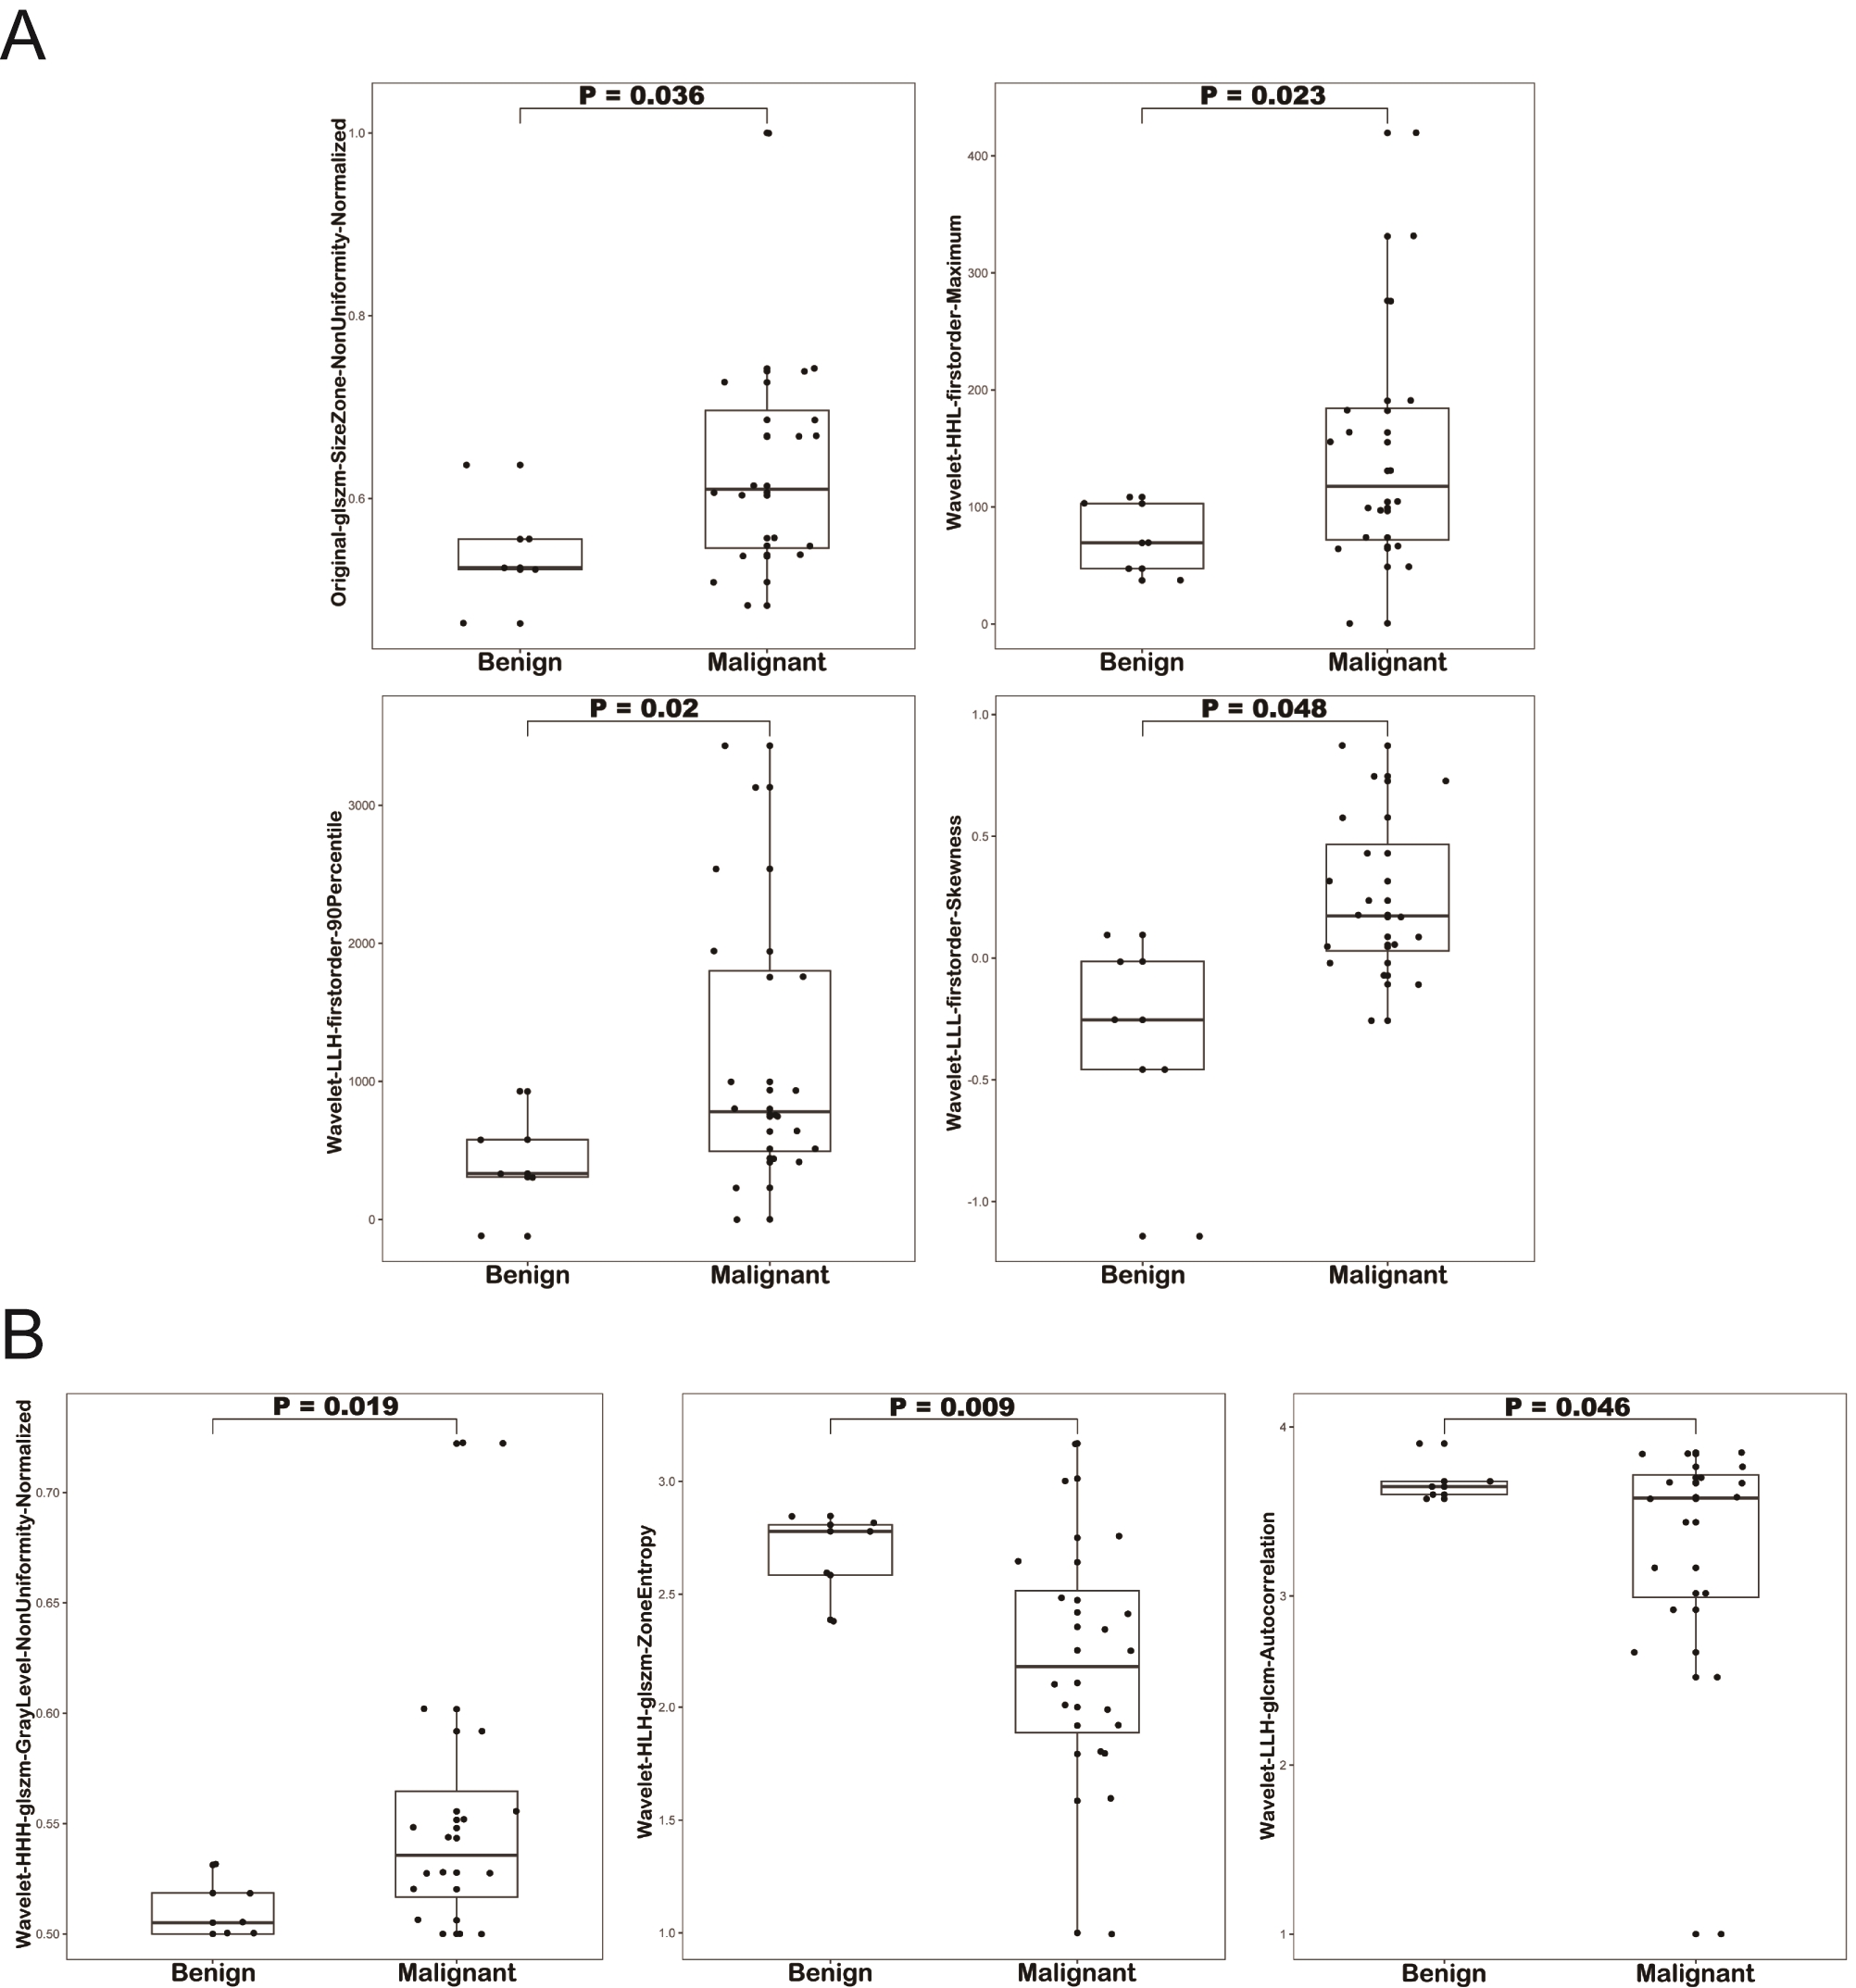
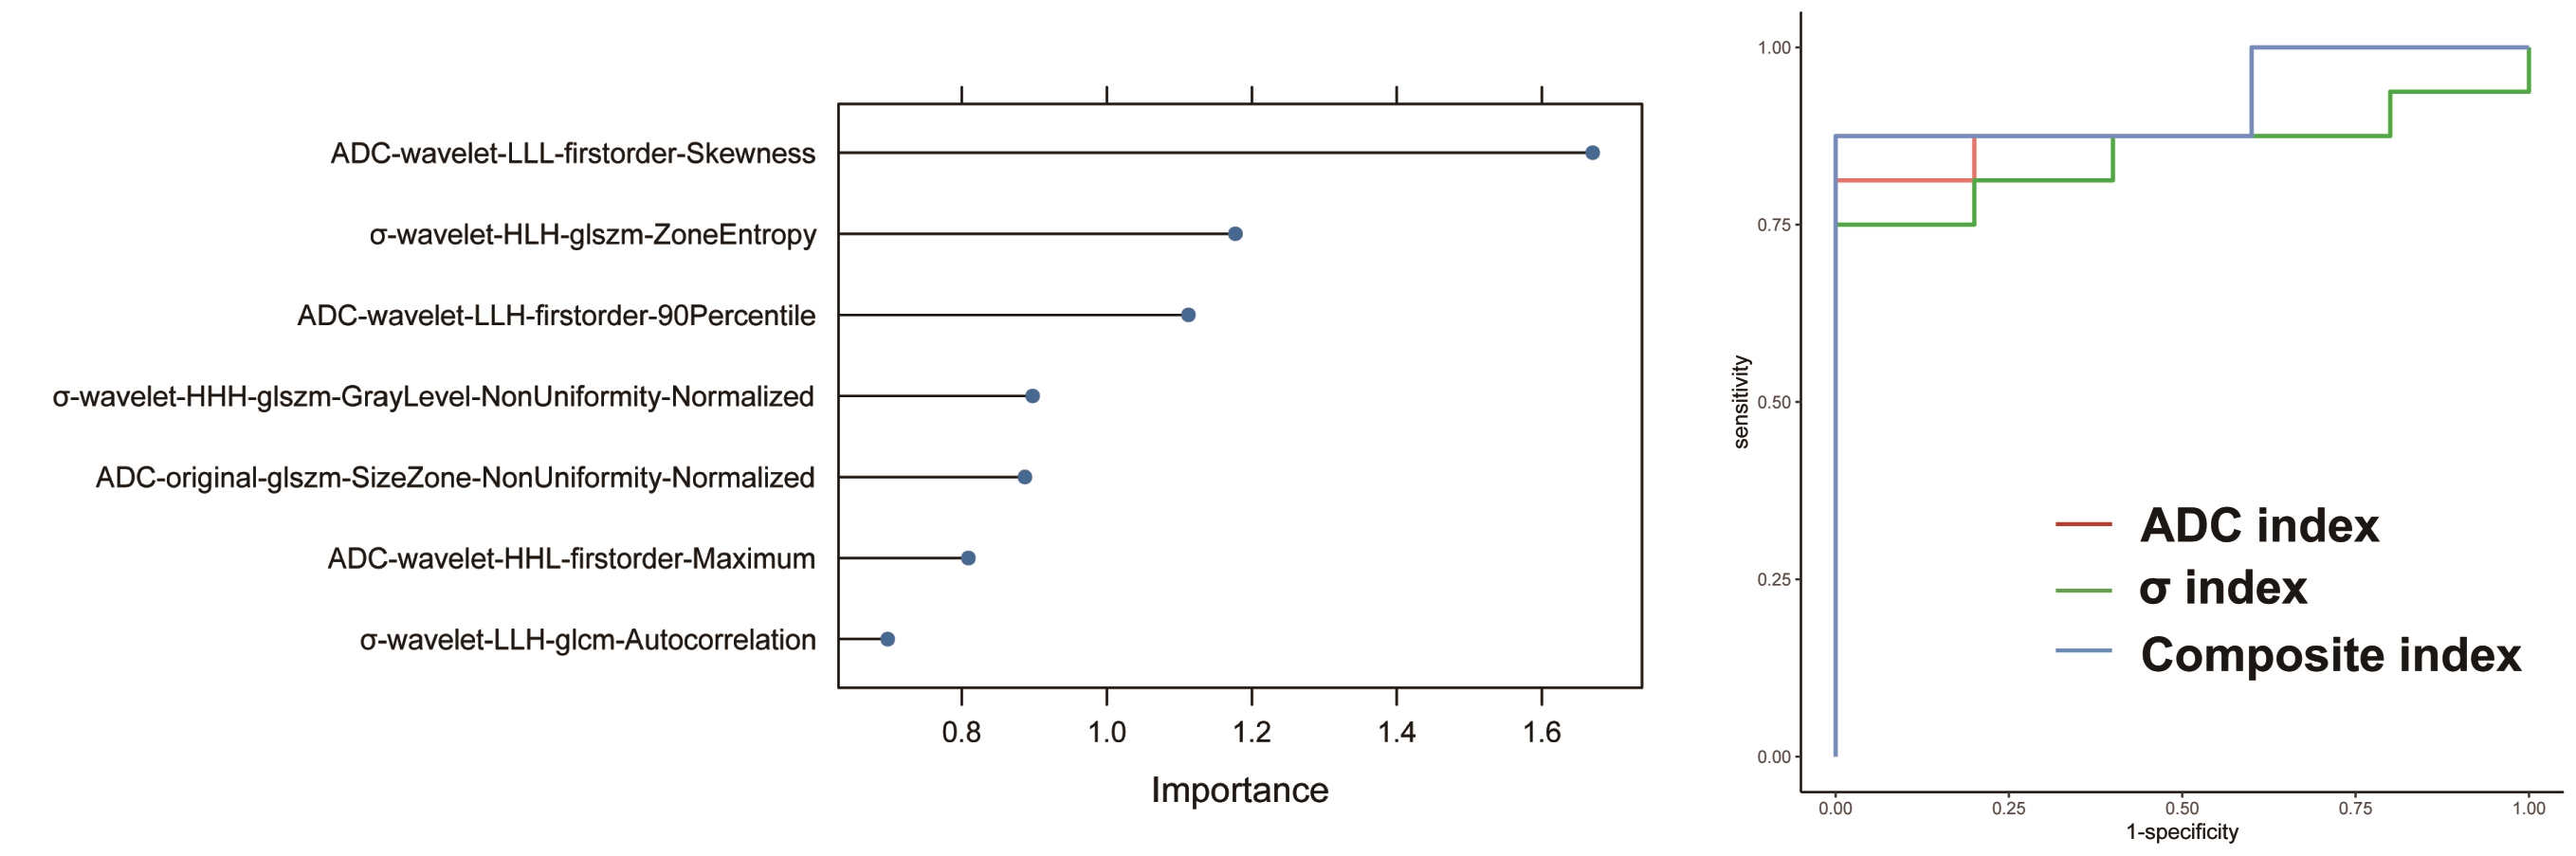
Two lesions were excluded because of too small lesion size (< 2mm). Thus, 21 lesions (19 lung and 2 mediastinal) were evaluated. Their breakdown is given in Figure 2. Nineteen radiomic features (7 from ADC and 12 from σ maps) were significantly related to malignancy (P < 0.05), and LASSO regression identified 7 independent features (4 from ADC and 3 from σ maps) (Figure 3). The malignant lesions had significantly higher ADCoriginal-glszm-SizeZone-Nonuniformity-Normalized (P=0.036), ADCwavelet-HHL-firstorder-Maximum (P=0.023), ADCwavelet-LLH-firstorder-90Percentile (P=0.02), ADCwavelet-LLH-firstorder-Skewness (P=0.048) and σwavelet-HHH-glszm-graylevel-NonUniformity-Normalized (P=0.019) than benign lesions (Figure 4). σwavelet-HLH-glszm-ZoneEntropy (P=0.009) and σwavelet-LLH-glcm-Autocorrelation (P=0.046) of malignant lesions were lower than those in benign lesions (Figure 4). Two σ-derived features ranked in the top 4 orders (Figure 5). The AUC values of ADC, σ, and composite indices were 0.913 (95% CI: 0.788-1), 0.850 (95% CI: 0.684-1), and 0.925 (95% CI: 0.808-1), respectively. Upper lung and superior mediastinal lesions appeared to have lower indices than in the middle and lower lung field lesions.Discussion
Half of the top 4 important features were from σ, and the composite index achieved the highest AUC, indicating the addition of σ can help improve discrimination ability. The high AUC (> 0.8) of ADC in distinguishing the two lesion types is similar to previous reports8. Higher ADCwavelet-HHL-firstorder-Maximum, ADCwavelet-LLH-firstorder-90Percentile, and ADCwavelet-LLH-firstorder-Skewness indicate the higher overall intensity for malignant lesions in ADC maps. Other ADC- and σ- derived features are thought to reflect the heterogeneity and uniformity of textures within tissues or lesions. σ additionally provides tissue electrical information, which enables the model to behave more comprehensively. However, more samples must validate these preliminary findings.Conclusion
This study used radiomic analysis to investigate the added value of σ to ADC in distinguishing thoracic lesions. DWI and EPT can become noninvasive imaging techniques to distinguish benign and malignant thoracic lesions. Integrating EPT into routine clinical practice may improve overall diagnostic accuracy.Acknowledgements
This study was funded by the grants-in-aid for scientific research by the Japan Society for Promotion of Science (17K10390 and FY2017 JSPS Invitation Fellowship for Research in Japan) and the Global Institution for Collaborative Research and Education, Hokkaido University.References
1. Karaman A, Durur-Subasi I, Alper F, et al. Is it better to include necrosis in apparent diffusion coefficient (ADC) measurements? The necrosis/wall ADC ratio to differentiate malignant and benign necrotic lung lesions: Preliminary results. J Magn Reson Imaging. 2017;46:1001-1006.
2. Shin KE, Yi CA, Kim TS, et al. Diffusion-weighted MRI for distinguishing non-neoplastic cysts from solid masses in the mediastinum: problem-solving in mediastinal masses of indeterminate internal characteristics on CT. Eur Radiol. 2014;24:677-84.
3. Tha KK, Katscher U, Yamaguchi S, et al. Noninvasive electrical conductivity measurement by MRI: a test of its validity and the electrical conductivity characteristics of glioma. Eur Radiol. 2018;28:348-355.
4. Katscher U, Kim DH, Seo JK. Recent progress and future challenges in MR electric properties tomography. Comput Math Methods Med. 2013;2013:546562.
5. Tha KK, Katscher U, Kikochi E, et al. Noninvasive Assessment of Electrical Conductivity of Lung and Mediastinal Mass Lesions: Feasibility and Potential Clinical Value. ISMRM 2020.
6. Gillies RJ, Kinahan PE, Hricak H. Radiomics: Images Are More than Pictures, They Are Data. Radiology. 2016;278:563-77.
7. Lambin P, Leijenaar RTH, Deist TM, et al. Radiomics: the bridge between medical imaging and personalized medicine. Nat Rev Clin Oncol. 2017;14:749-762.
8. Xiang L, Yang H, Qin Y, et al. Differential value of diffusion kurtosis imaging and intravoxel incoherent motion in benign and malignant solitary pulmonary lesions. Front Oncol. 2023;12:1075072.
Figures