3683
Measurement of Radiation Effects in Tumor Tissues using MR-based Conductivity Imaging1Division of Applied RI, Korea Institute of Radiological and Medical Science, Seoul, Korea, Republic of, 2Department of Biomedical Engineering, Kyung Hee University, Seoul, Korea, Republic of, 3Department of Hepato-Biliary-Pancreas Surgery, Chonnam National University Medical School, Gwangju, Korea, Republic of, 4Department of Radiology, Chosun University Hospital and Chosun University College of Medicine, Gwangju, Korea, Republic of
Synopsis
Keywords: Electromagnetic Tissue Properties, Tumor, Ionizing radiation
Motivation: Ionizing radiation produces ions inside the human body that can kill cancerous tissues by damaging DNA directly or creating charged particles that damage DNA.
Goal(s): Contrast mechanism of electrical conductivity is determined by the concentration and mobility of ions that make up tissues.
Approach: We applied MR-based conductivity imaging to mouse brain tumors to evaluate the responses in irradiated and non-irradiated tissues during the peri-irradiation period.
Results: MR-based conductivity images effectively showed acute response after irradiation in glial tumors.
Impact: High-frequency conductivity images can differentiate each brain tissues including viable tumors, tumor necrosis, and normal brain. It shows potential as a tool to differentiate the therapeutic effect of radiation by measuring absolute values and calculating percentage changes.
Synopsis
Ionizing radiation produces ions inside the human body that can kill cancerous tissues by damaging DNA directly or creating charged particles that damage DNA. Magnetic resonance (MR)-based conductivity imaging has been reported as a sensitive tool to measure and evaluate the responses of normal tissues to irradiation. The response of malignant tissues following irradiation is required to evaluate its therapeutic effects in clinical practice.Abstract
Recent MR-based conductivity imaging reported higher sensitivity than other MR techniques for evaluating the responses of normal tissues immediately after irradiation1. However, it is still necessary to verify the responses of cancer tissues to irradiation by conductivity imaging for it to become a reliable tool in evaluating therapeutic effects in clinical practice. In this study, we applied MR-based conductivity imaging to mouse brain tumors to evaluate the responses in irradiated and non-irradiated tissues during the peri-irradiation period. Absolute conductivities of brain tissues were measured to quantify the irradiation effects, and the percentage changes were determined to estimate the degree of response. Time-course variations in the tissue responses of both tissues were compared before and up to 10 days post-irradiation.Methods
For intracranial tumors, C6 glioma cells were injected into the right caudate-putamen of 14 Balb/c nude mice for in vivo imaging. Tumor growth was confirmed on MR images using a 9.4T MRI (Agilent Technologies) 2 weeks after tumor cell inoculation. The mice were divided into an irradiated group (n = 7) and a non-irradiated group (n = 7). In the irradiated group, the mean dose rate was 0.98 Gy/min, and the field size was 5 × 30 cm under a Co-60 gamma-ray irradiation unit. Imaging experiments were performed before and at 0, 1, 2, 3, 7, and 10 days after irradiation in both groups. For the electrical conductivity imaging, a multi-echo multi-slice (MEMS) spin-echo pulse sequence was applied to obtain a B1 map, which was used to calculate high-frequency conductivity images2,3. Since electrical conductivity is a material property that provides an absolute value, we measured the conductivity values for the regions-of-interests (ROIs) in both groups. The absolute conductivity of the mouse brain tissues was used to quantify the irradiation effects. The percentage change (%), which indicates the degree of response depending on irradiation, was calculated following the irradiation based on the values before irradiation.Results and Discussion
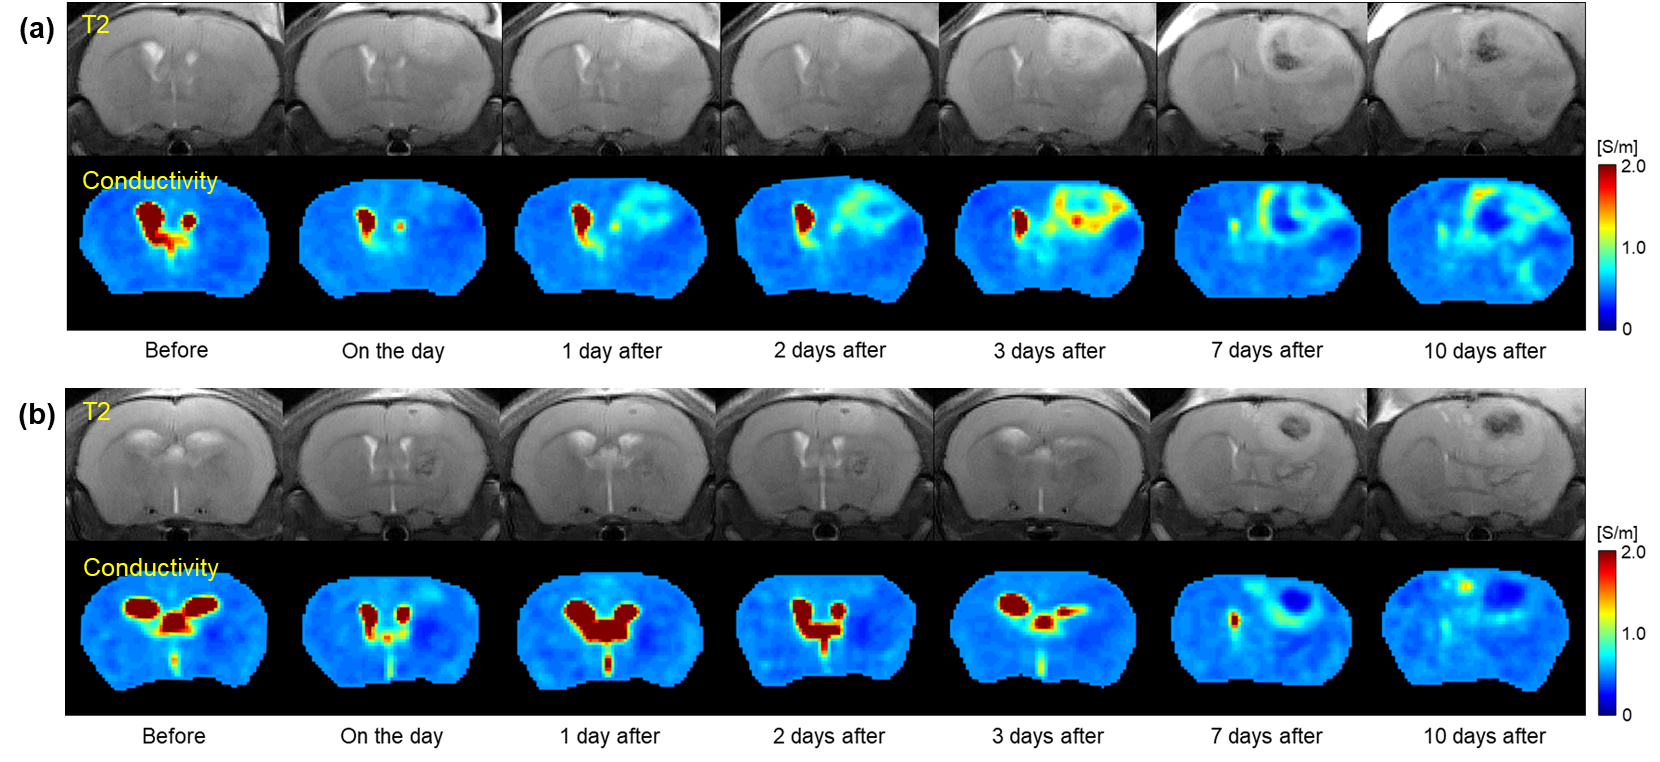
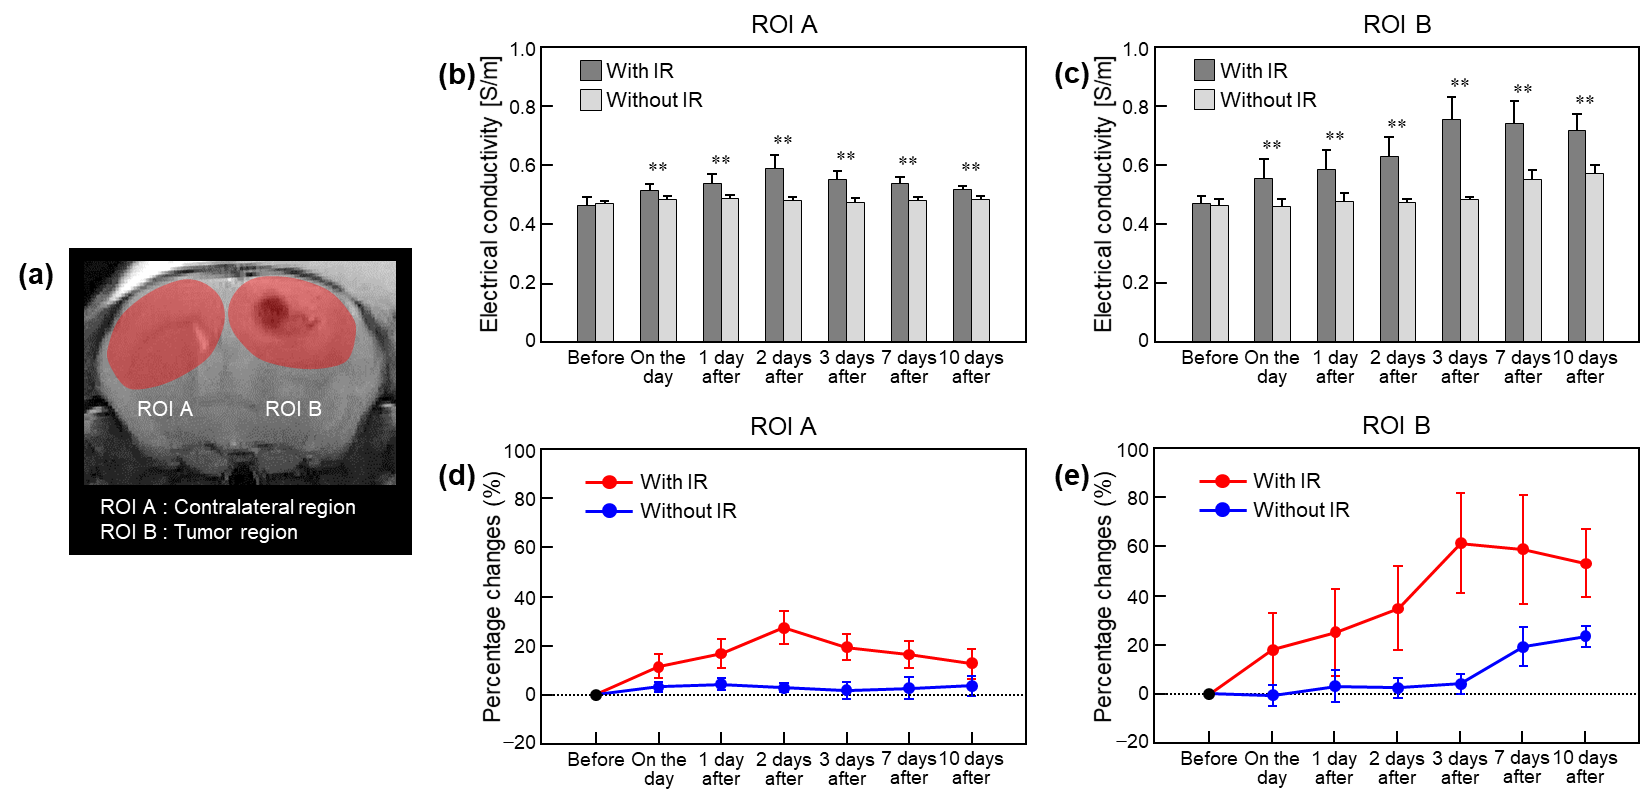
Fig. 1 shows the full time-course images of the MR and electrical conductivity of the in vivo brain tumors with and without irradiation. All images were obtained before and 0, 1, 2, 3, 7, and 10 days after in the irradiated (Fig. 1a) and non-irradiated (Fig. 1b) groups. The conductivity images show clear contrast changes between the two groups over time. Specifically, the conductivity of the irradiated group shows an increase up to 3 days after and a slight decrease up to 10 days. On the contrary, the conductivity of the non-irradiated group shows similar contrast up to 3 days and changes up to 10 days. The contrast of the tumor rims was clearly different between the two groups. Fig. 2 shows a comparison of absolute conductivity and percentage changes (%) from in vivo mouse brain tissues with and without irradiation. ROI was placed to cover the entire tumor tissues and was placed on the contralateral region with the same area (Fig. 2a). The conductivity of the contralateral region with irradiation showed an increase up to 2 days after and a gradual decrease to 10 days (Fig. 2b). There was no clear change in the tissues without irradiation. On the contrary, the conductivity of the tumor region with irradiation showed an increase up to 3 days after and a slight decrease to 10 days (Fig. 2c). The conductivity of the tumor region without irradiation showed a similar contrast up to 3 days after and gradually increased to 10 days. The percentage change of the contralateral region with irradiation increased by 27.2% up to 2 days after and then decreased to 12.4% (Fig. 2d). The percentage change of the contralateral region without irradiation was not significant. Meanwhile, the percentage change of the tumor region with irradiation increased by 61.1% up to 3 days after and then decreased to 52.9% (Fig. 2e). The percentage change of the tumor region without irradiation was not significant until 3 days after irradiation, but increased to 23.2% by 10 days after.Conclusion
MR-based conductivity images effectively showed acute response after irradiation in glial tumors. The high-frequency conductivity images can differentiate each brain tissues including viable tumors, tumor necrosis, and normal brain.Acknowledgements
This research was funded by the National Research Foundation of Korea (NRF) grants funded by the Korea government (No. 2019R1A2C2088573, 2021R1I1A3050277, 2021R1A2C2004299).References
1. Park, Ji Ae, et al. In vivo measurement of brain tissue response after irradiation: comparison of T2 relaxation, apparent diffusion coefficient, and electrical conductivity. IEEE Trans. Med. Imaging 2019;38:2779-2784.
2. Katscher, Ulrich, et al. Magnetic Resonance Electrical Properties Tomography (MREPT). “Electrical Properties of Tissues”. Advances in Experimental Medicine and Biology, 2022, vol. 1380. Springer.
3. Kim, Jin Woong, et al. Image-based evaluation of irradiation effects in brain tissues by measuring absolute electrical conductivity using MRI. Cancers 2021;13:5490.
Figures