3681
Preliminary Whole-Brain Functional Electrical Properties Tomography using Gradient-Echo Echo-Planar Imaging1Department of Medical Physics and Biomedical Engineering, University College London, London, United Kingdom
Synopsis
Keywords: Electromagnetic Tissue Properties, Multimodal, MR-EPT, functional electrical properties tomography, functional conductivity mapping
Motivation: Electrical properties tomography (EPT) can reveal brain tissue conductivity changes during functional activation. Previous attempts have used sequences with low resolution and limited coverage, and required separate acquisitions to generate functional MRI (fMRI) and EPT (fEPT).
Goal(s): To investigate the feasibility of high-resolution whole-brain fEPT and simultaneous fMRI using gradient-echo EPI (GRE-EPI).
Approach: Two healthy volunteers were scanned using GRE-EPI during a visual stimulation paradigm. Conductivity maps calculated using phase-based EPT were analysed for functional activation.
Results: We observed small regions of positive and negative fEPT visual activation, co-localised with fMRI activations. These findings are reproducible across subjects and coil configurations.
Impact: Calculating whole-brain functional Electrical Properties Tomography (fEPT) and BOLD fMRI simultaneously using a high-resolution multi-echo GRE-EPI sequence will allow fMRI studies to reveal functional conductivity changes, opening up a new dimension with potential for new clinical and research applications.
Introduction
Functional magnetic resonance imaging (fMRI) measures functional brain activation via blood-oxygenation-level-dependent (BOLD) signal arising from the balance between diamagnetic oxyhaemoglobin and paramagnetic deoxyhaemoglobin in the brain vasculature1. The brain’s hemodynamic response to activation also leads to changes in tissue electromagnetic properties in activated brain regions2-3. Using a truncated Helmholtz equation, phase-based electrical properties tomography (EPT) can calculate tissue electrical conductivities from the MR transceive phase ($$$\phi_{0}$$$)4. Although $$$\phi_{0}$$$ may also be estimated from sequence used for conventional BOLD fMRI, challenges remain in reconstructing EPT in presence of phase noise5, and simultaneous functional EPT (fEPT) and fMRI has not been reported.Recent attempts have been made to develop EPT-based fMRI, utilising balanced steady-state free precision (bSSFP) or spin-echo (SE-EPI) sequences2-3,6-7. In these studies, 2-6 mm voxels were acquired to boost temporal signal-to-noise ratio (tSNR) and only a single slice or small axial brain section was imaged and reconstructed for fEPT.
As a rapid sequence intensely used for conventional BOLD fMRI, gradient-echo EPI (GRE-EPI) is sensitive to alterations in venous blood and extra-vascular tissue1,3. Therefore, it offers an opportunity to reconstruct high-resolution, whole-brain functional activation maps with good tSNR. Here we present an acquisition and processing pipeline for the first high-resolution whole-brain fEPT using multi-echo (ME) GRE-EPI and demonstrate preliminary results from fEPT and simultaneous fMRI.
Methods
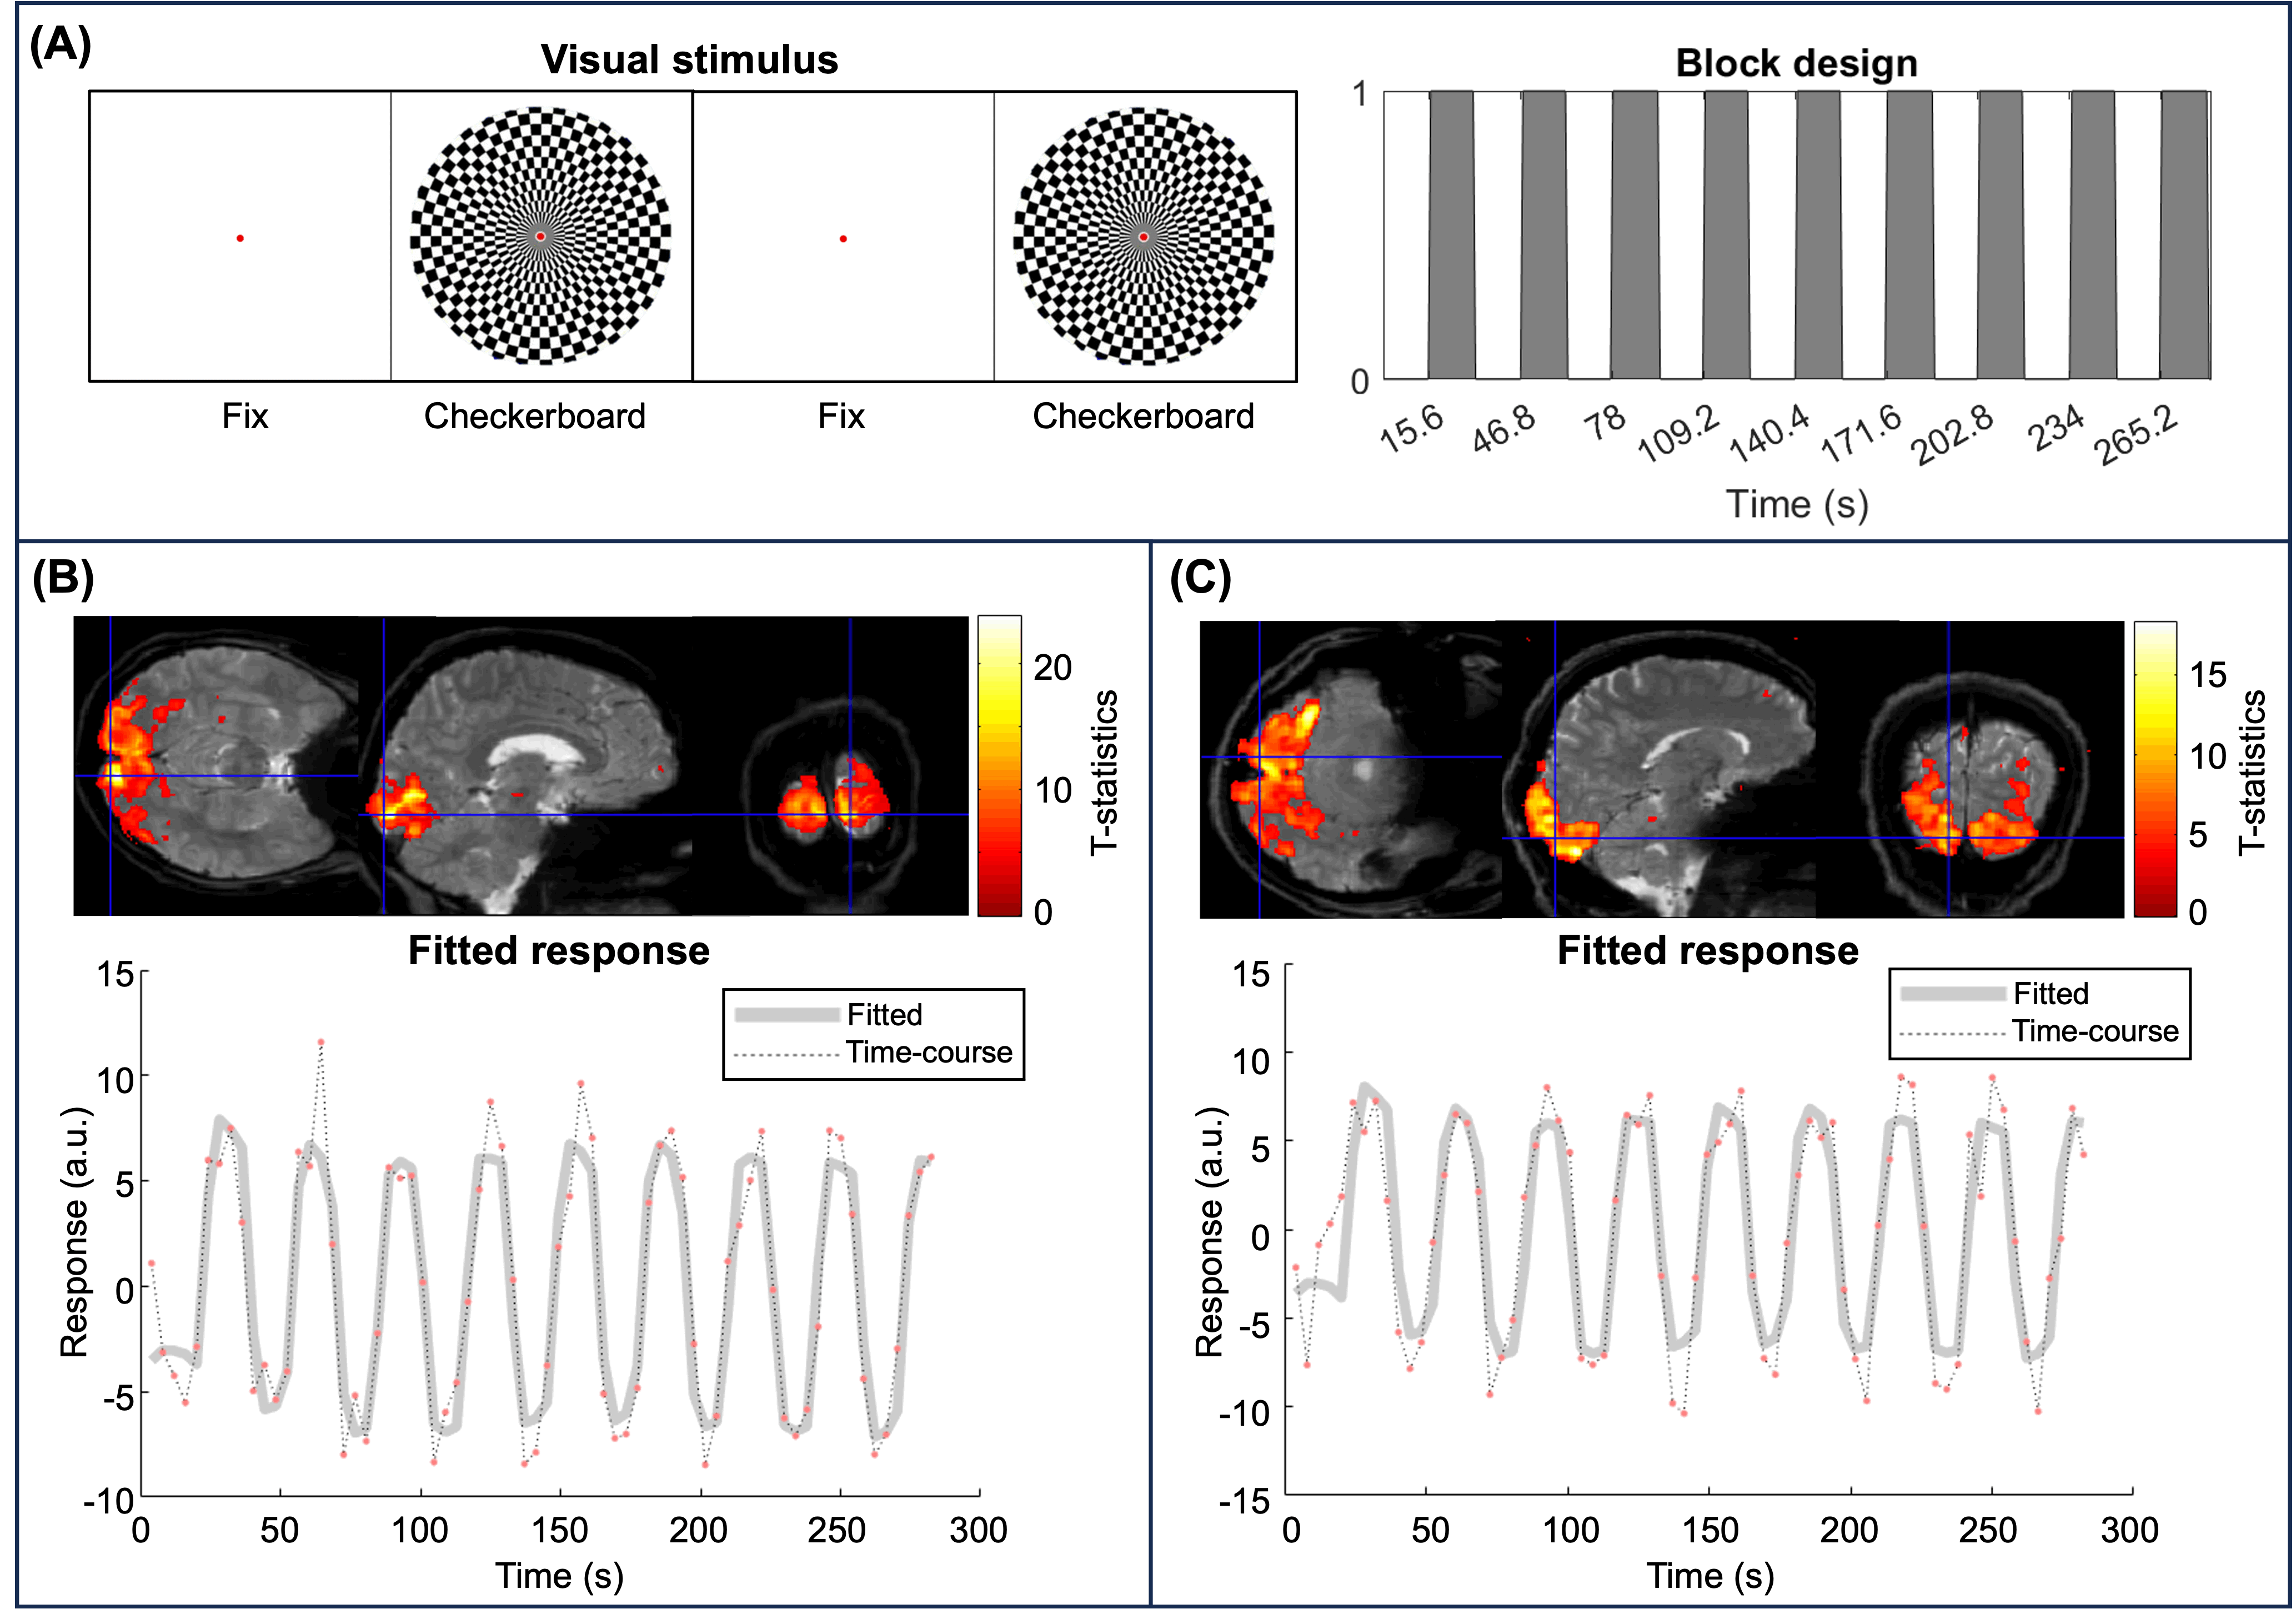
MRI acquisition:A healthy volunteer (HV1) was scanned at 3T (Siemens, Germany) using a 32-channel head coil and a ME 2D GRE-EPI sequence, with GRAPPA=4, MB=3, TR=4034 ms, TEs=15.6, 41.6, 67.6 ms, 1.3 mm isotropic resolution for 70 volumes. To maximise activation, a checkerboard visual stimulus flickering at 8 Hz alternated with a white screen in 15.6 s blocks (Figure 1A). To investigate inter-subject variability and reproducibility of fEPT across two coil configurations, a second HV was imaged with the same sequence using a 64-channel head coil.
EPT reconstruction:
The field map at each TE was first estimated using a non-linear fitting8 of the complex data. After unwrapping9, the field map was used to extrapolate the offset at TE=0 ms for each TE. The combined phase offset ($$$\phi_{0}$$$) was generated from the offsets averaged over TEs and then unwrapped by SEGUE9. The median brain $$$\phi_{0}$$$ within each axial slice was subtracted from $$$\phi_{0}$$$ to correct slice-to-slice phase artefacts10. The magnitude image at TE=41.6 ms was used to segment grey matter (GM), white matter (WM) and cerebrospinal fluid (CSF) with SPM1211. To minimise the effect of phase noise, the conductivity was calculated via a surface integral of the $$$\phi_{0}$$$ gradient, estimated by magnitude-weighted second-order polynomial fitting5, within 3D spherical kernels that were refined by tissue segmentations (MagSeg)12.
Functional analysis:
Functional MRI and fEPT processing were performed using SPM1211. Magnitude images were echo-combined13 before functional analysis. All 70 volumes were co-registered and smoothed with a 4 mm FWHM Gaussian kernel within the brain mask to improve SNR and statistical power14. For fEPT, voxels with non-physiological negative conductivities were excluded during smoothing and model estimation. A general linear model was used and the response to the design matrix (Figure 1A) was modelled by the canonical hemodynamic response function without time and dispersion derivatives. A t-test was employed to detect statistically significant voxel-wise activations with p<0.001 and without family-wise error correction.
Results and Discussion
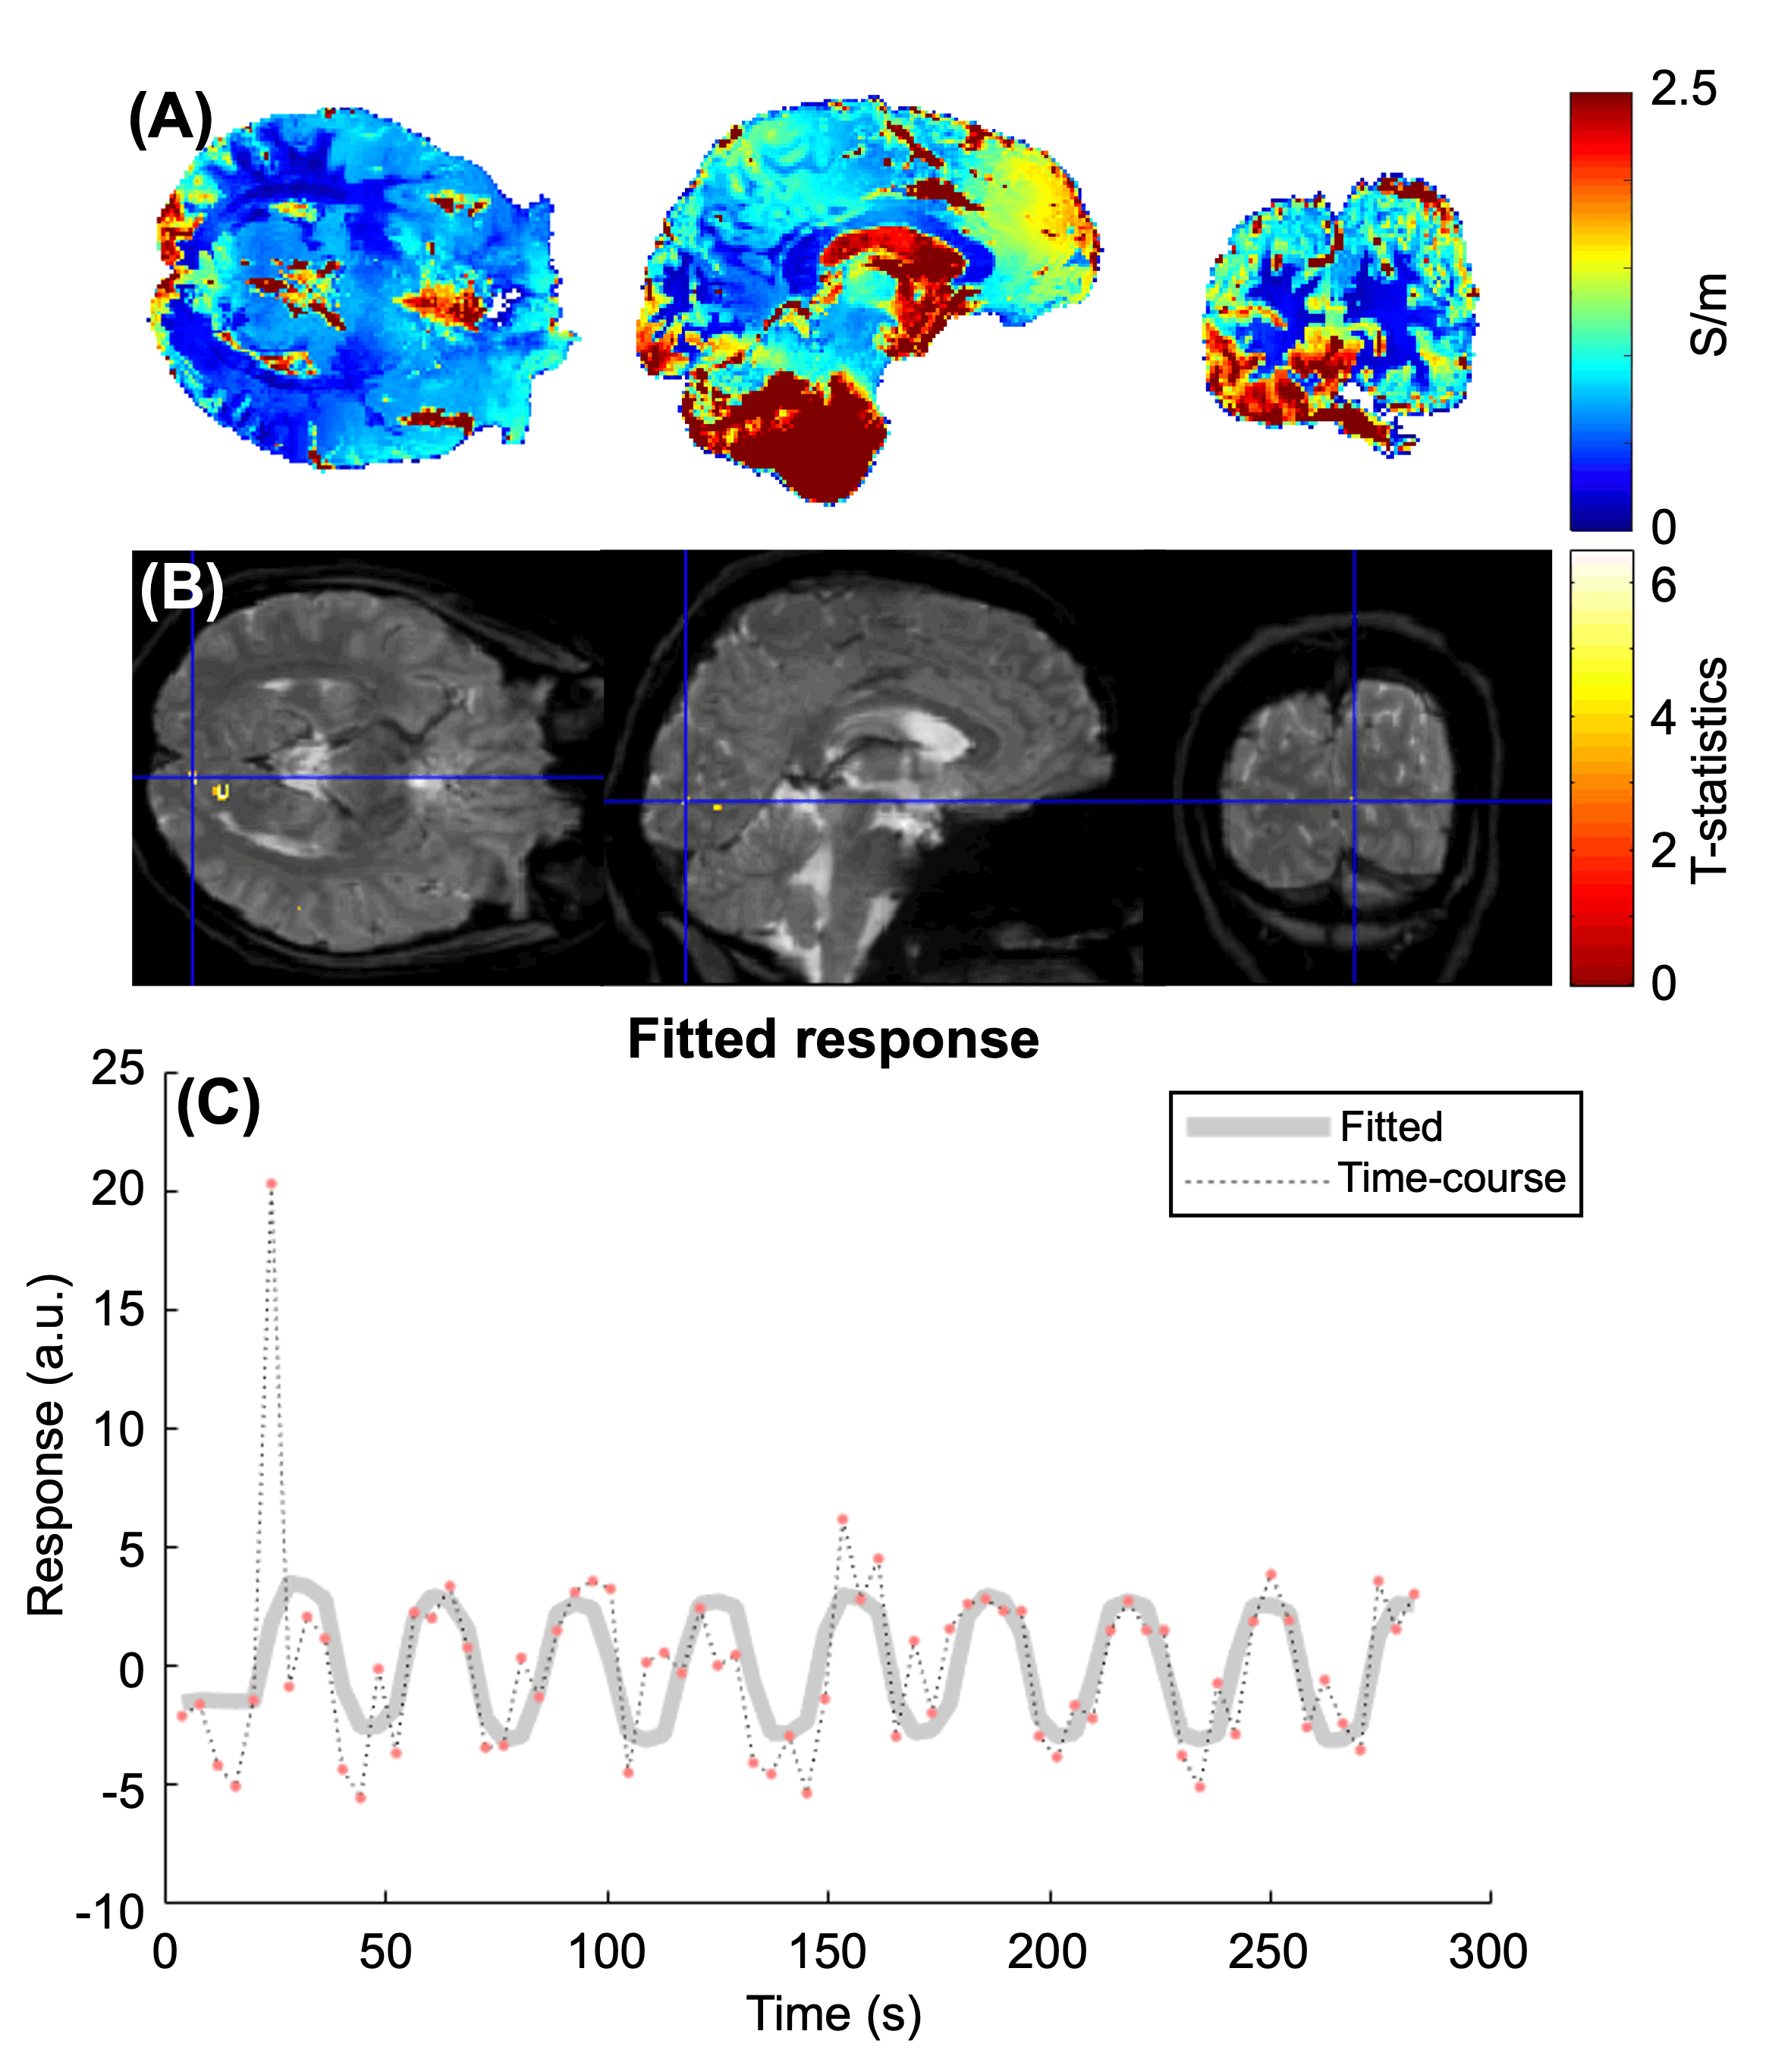
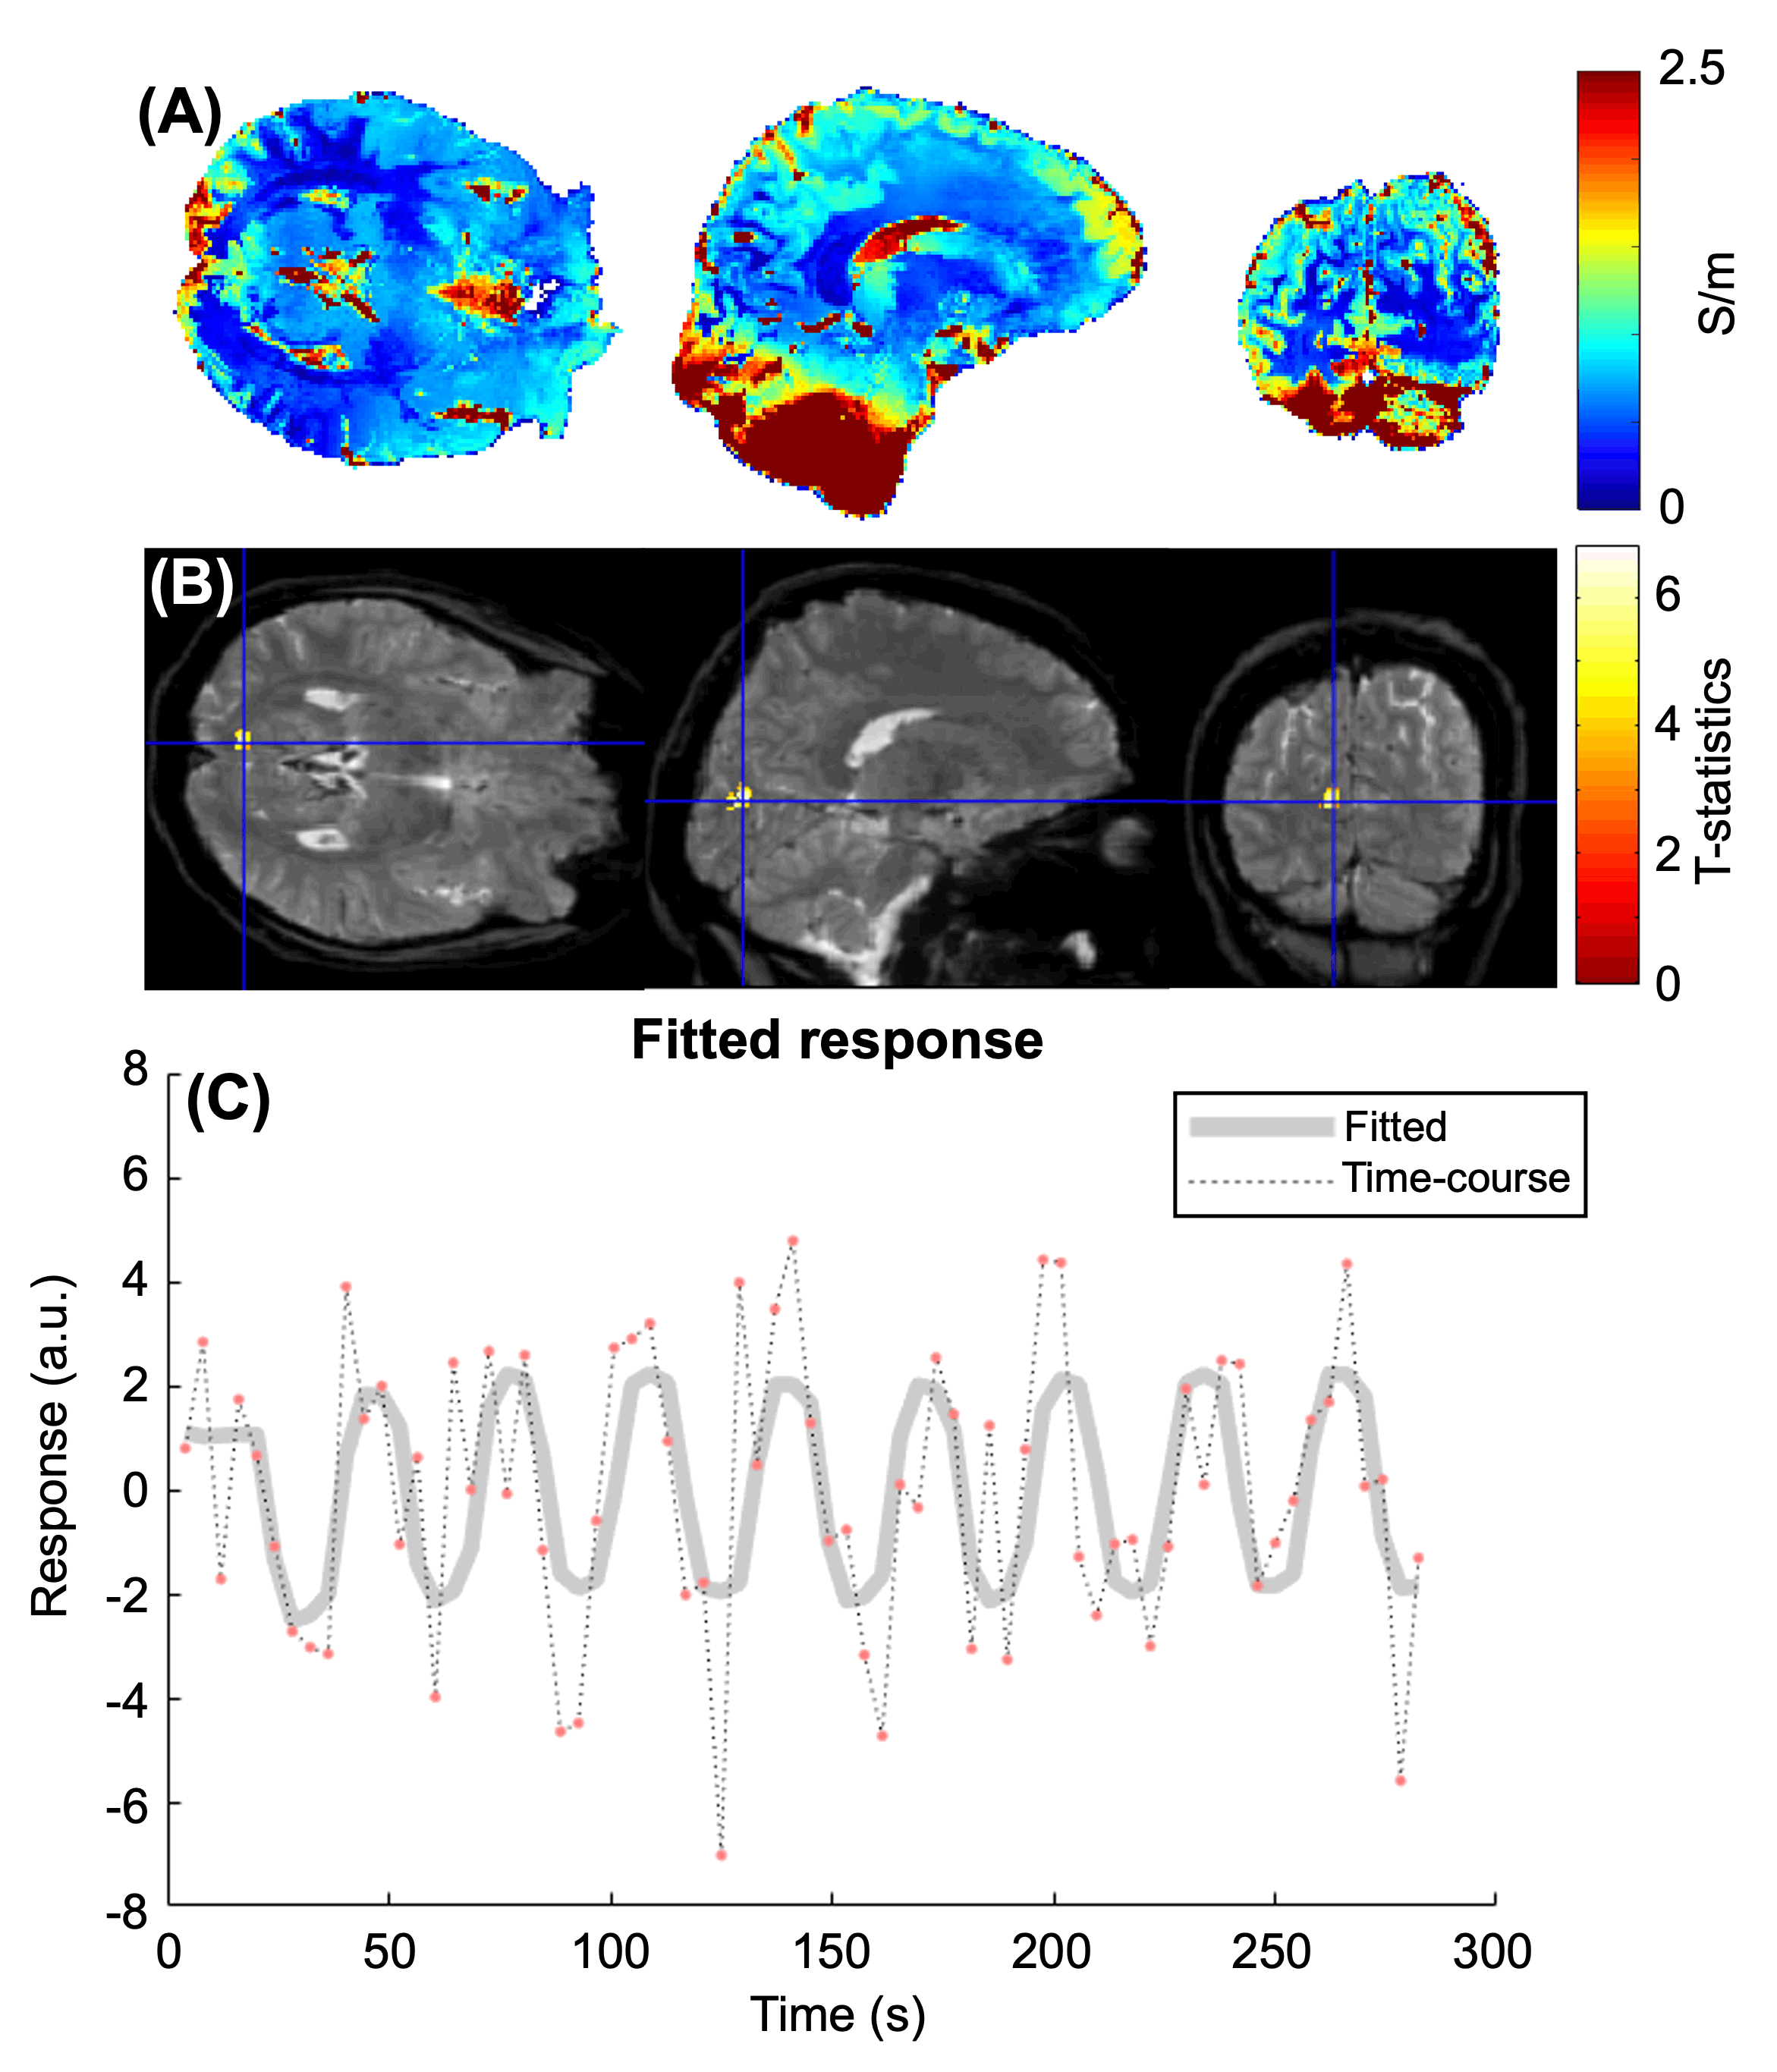
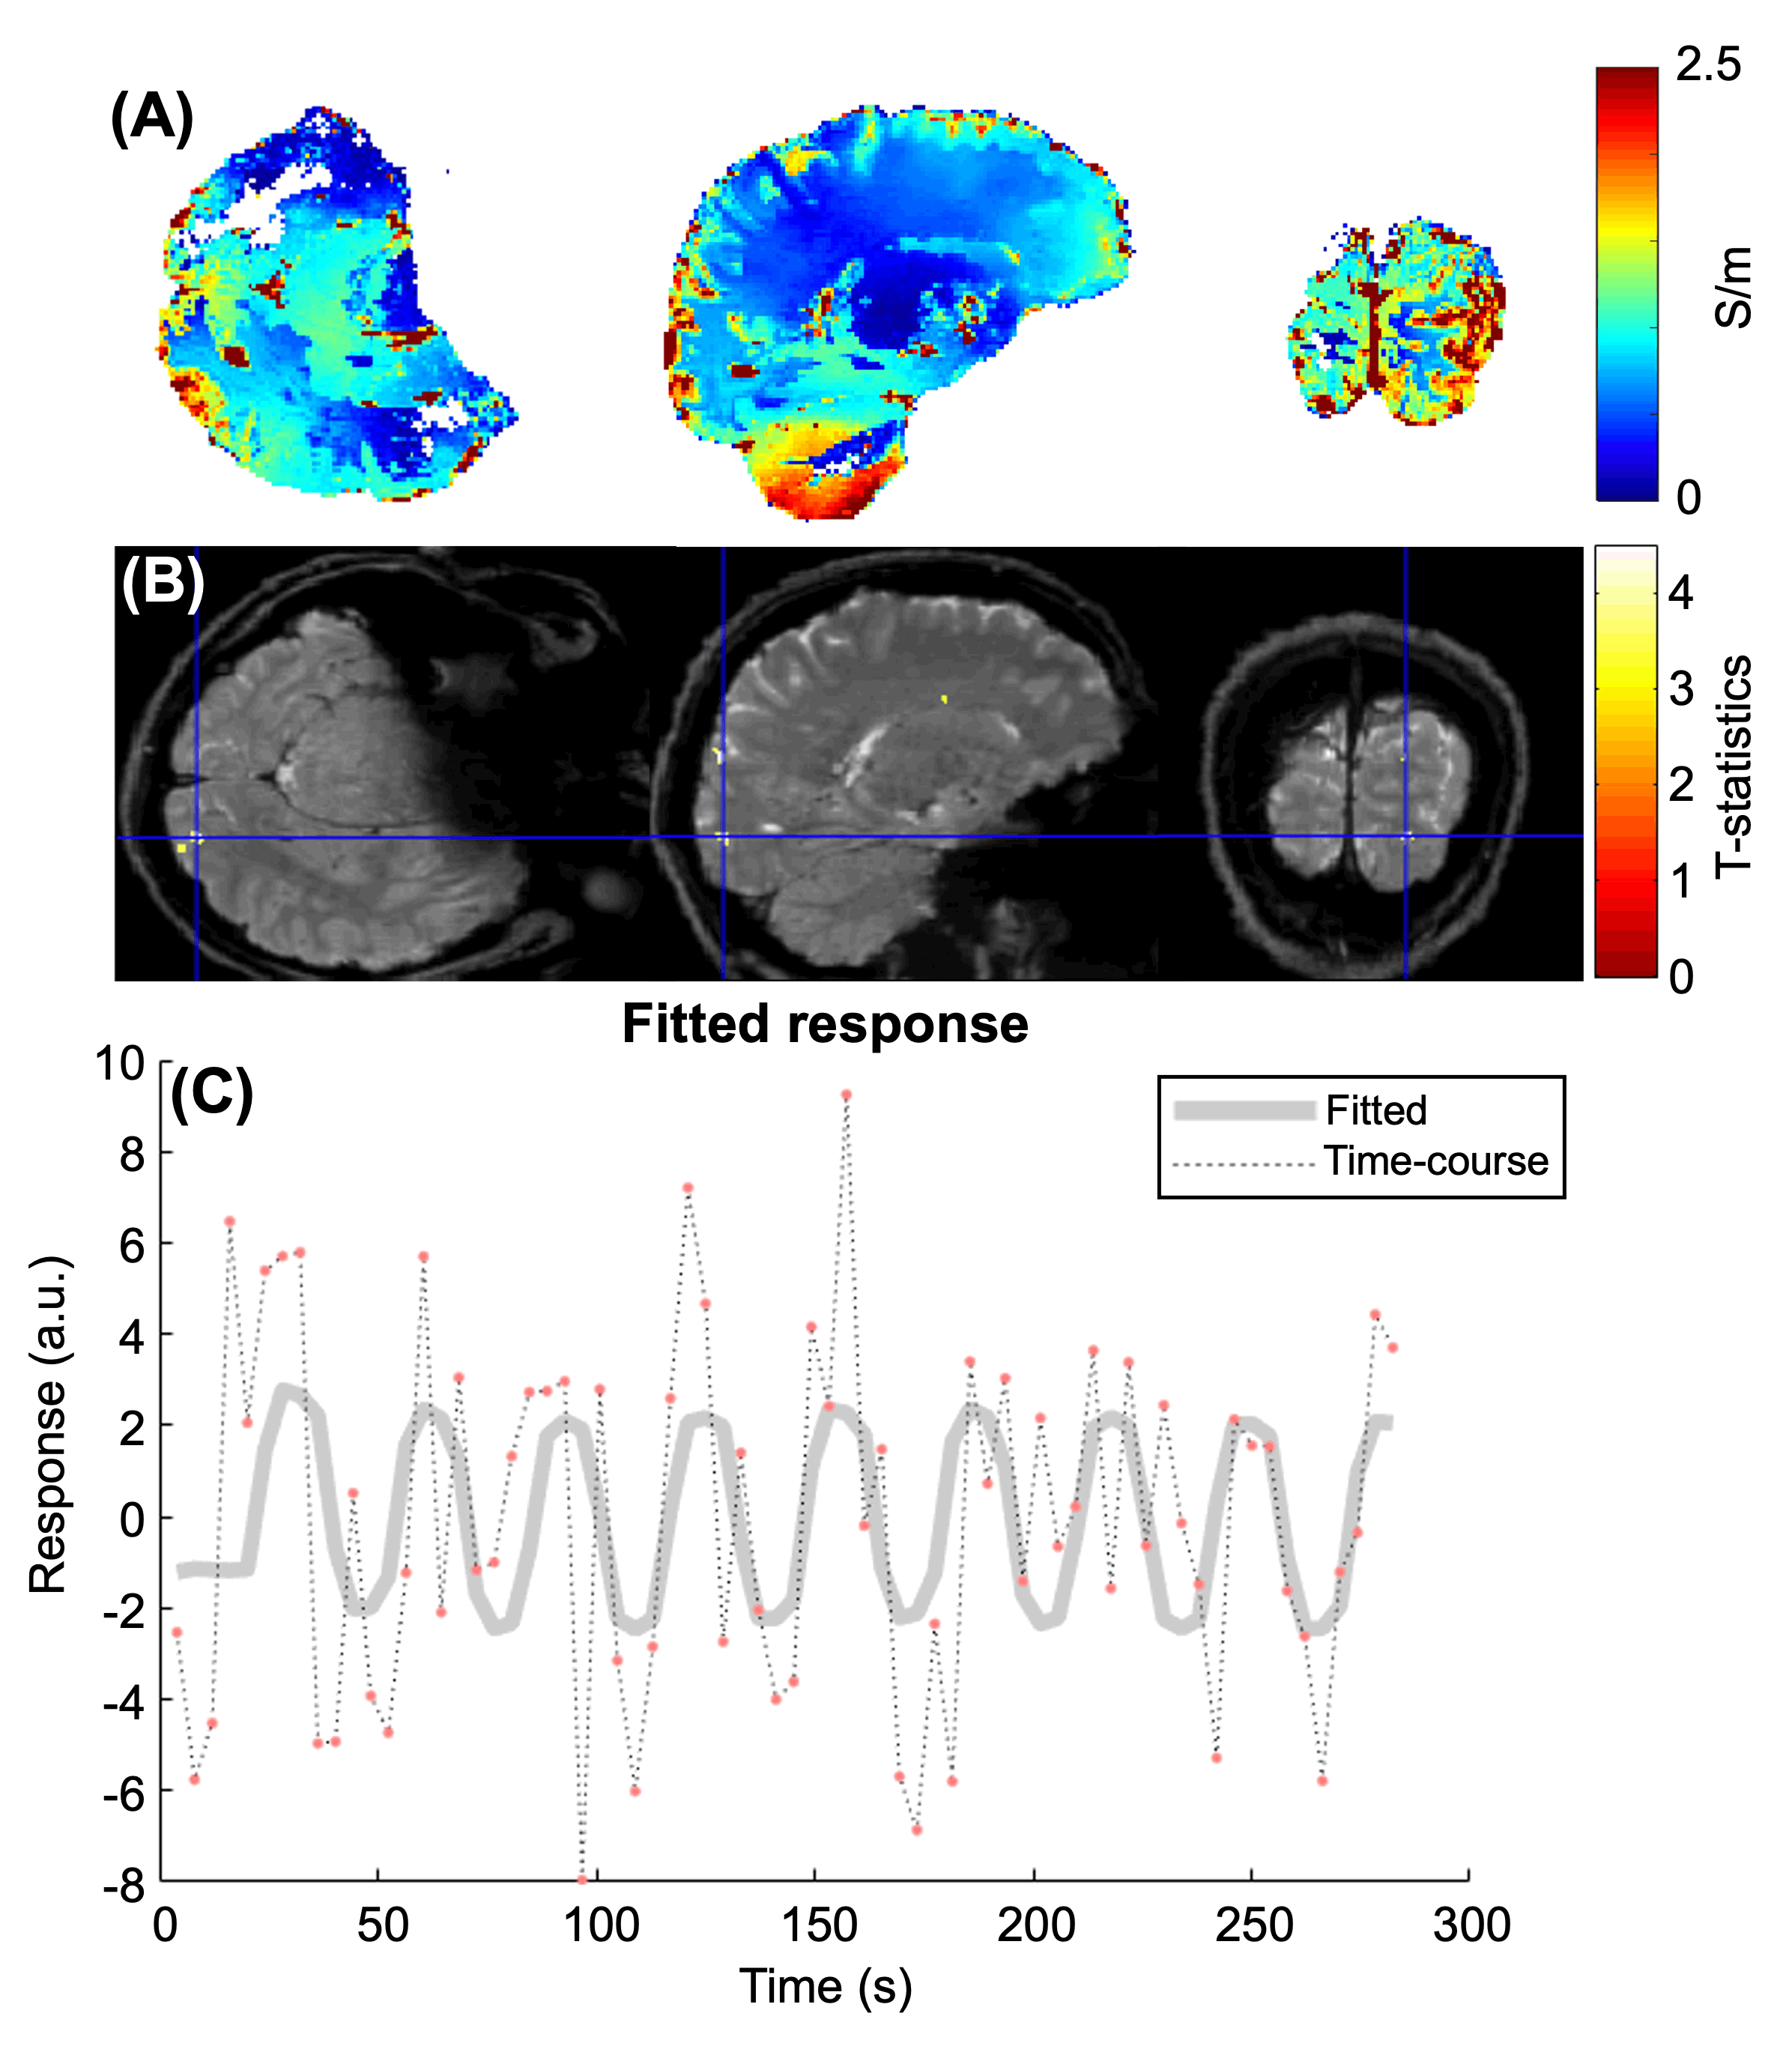
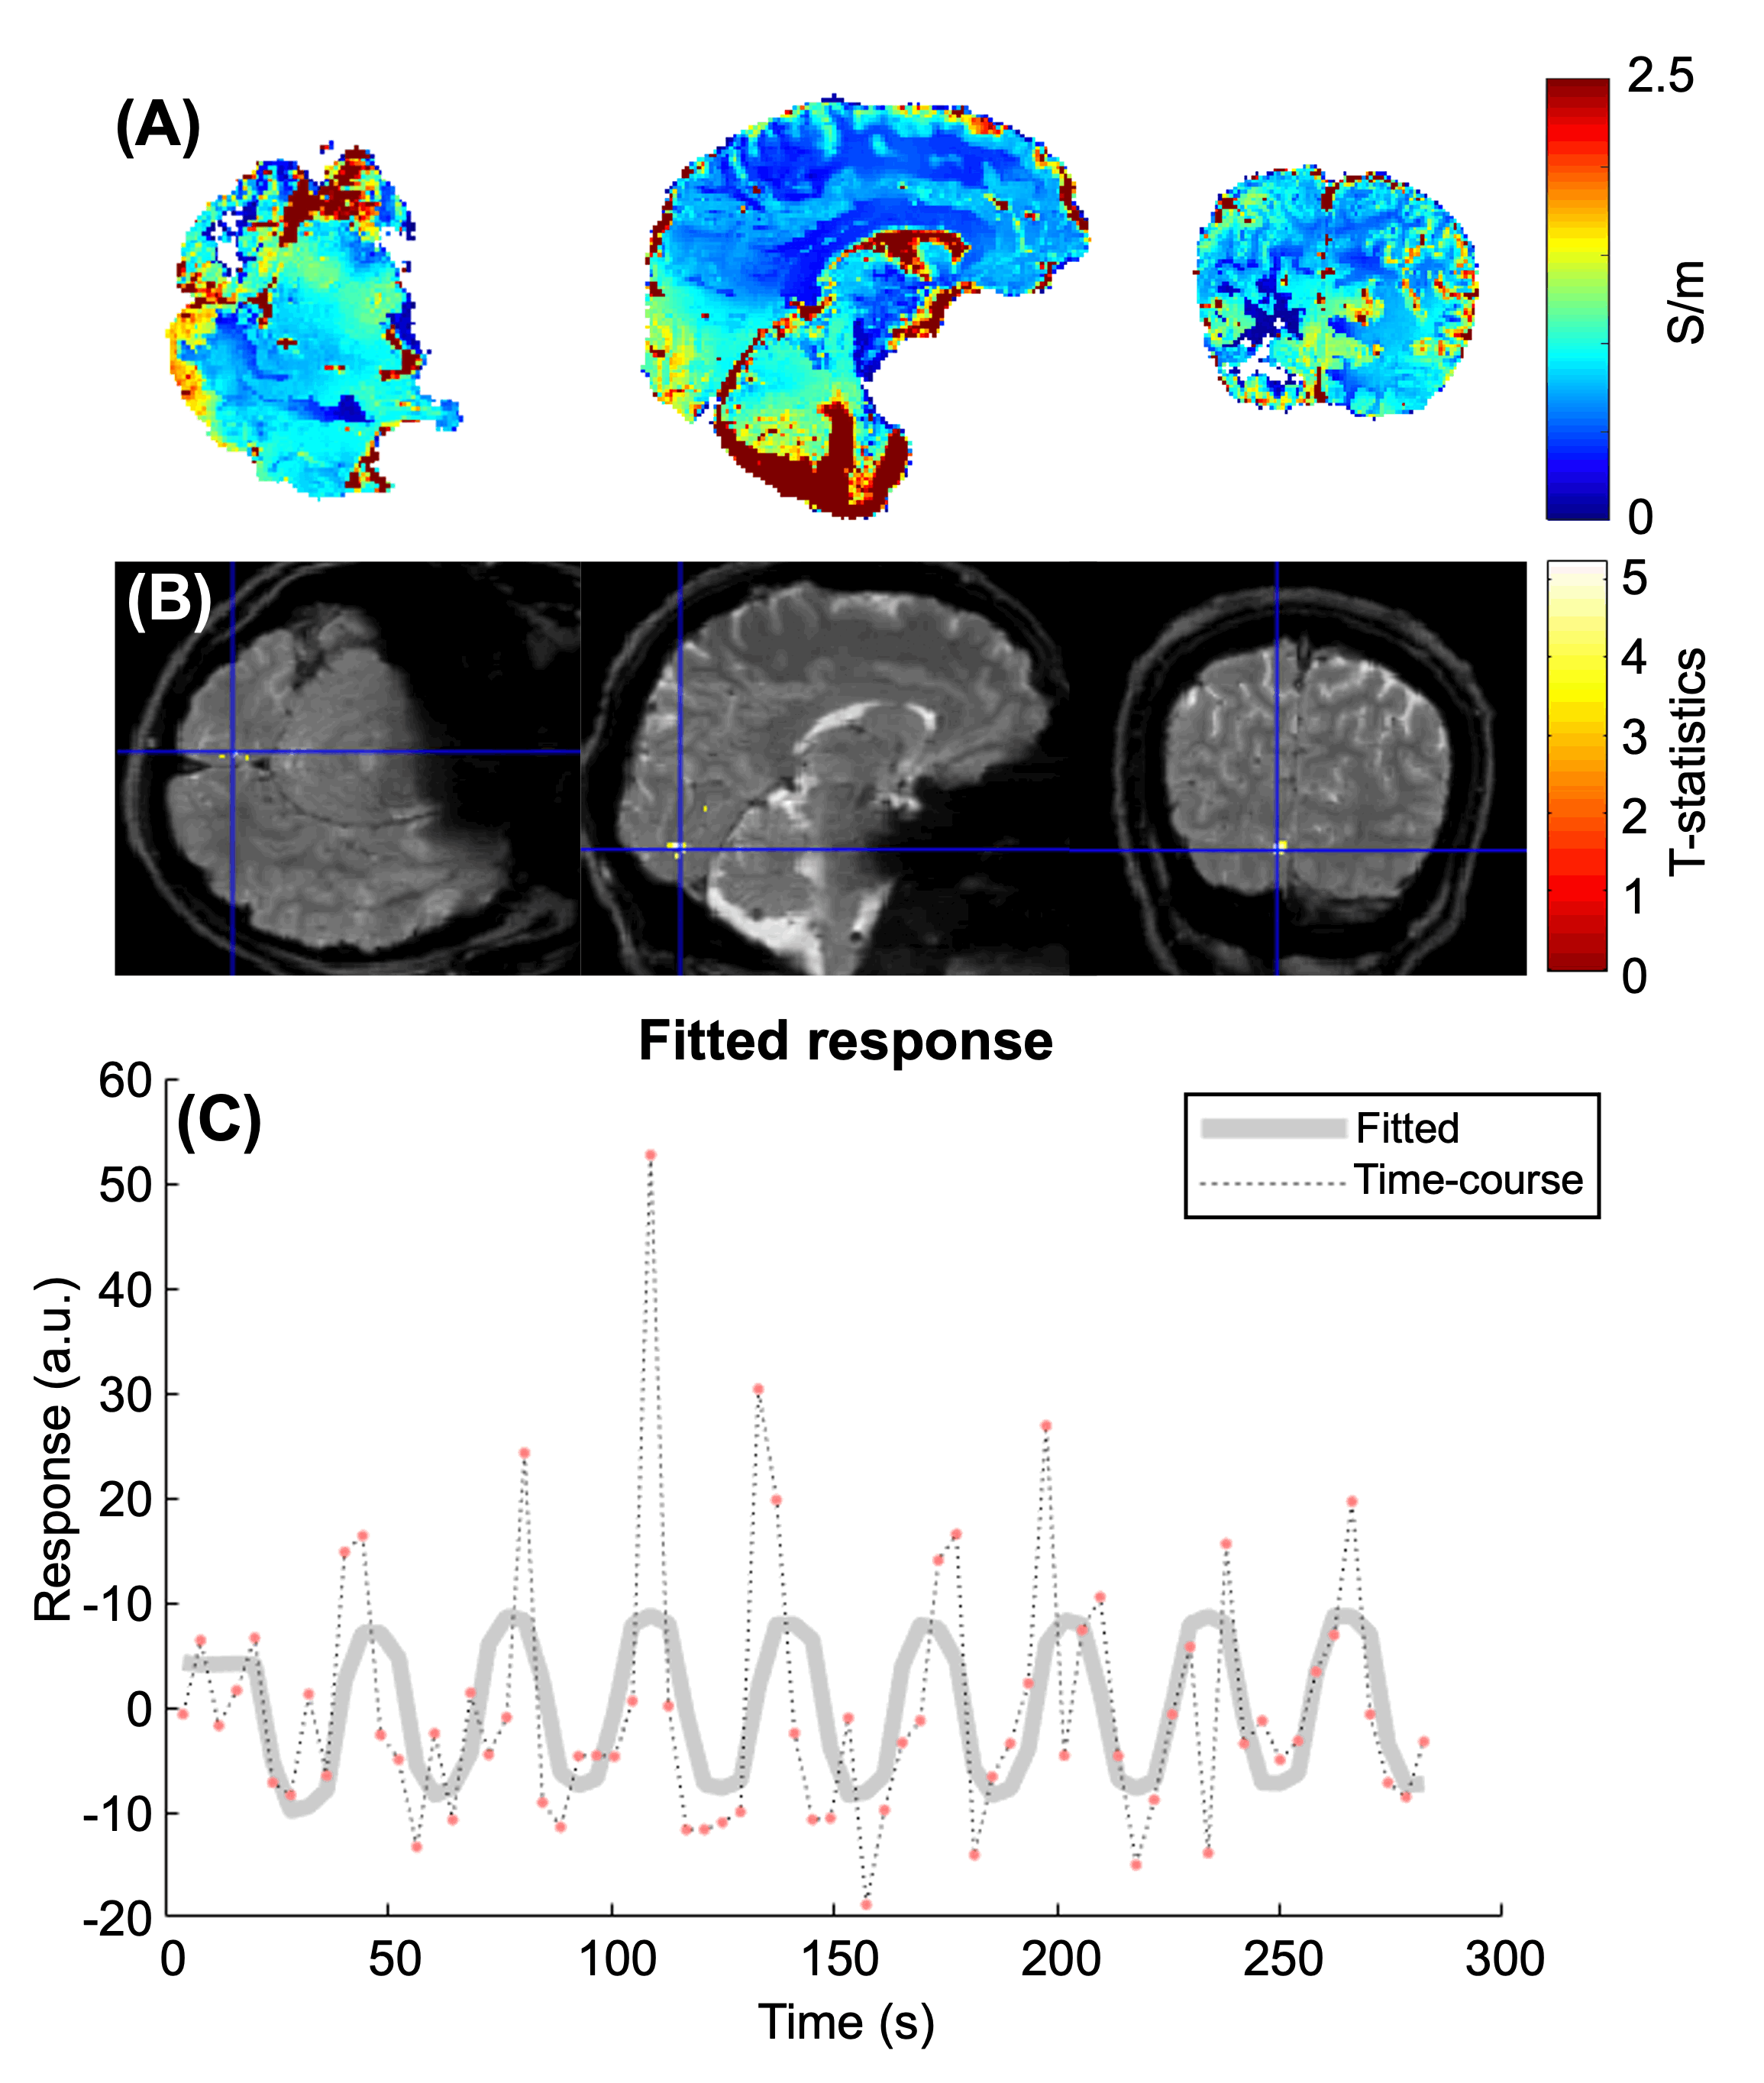
Figure 1B-C shows the BOLD fMRI primary visual cortex activations acquired using 32-channel (HV1) and 64-channel (HV2) head coils. In both HVs, we observed statistically significant fEPT activation (p<0.001) at similar locations within the visual cortex (Figures 2-5). This co-localisation is consistent with previous fEPT studies using SE-EPI3,7. Compared with fMRI, fEPT showed weaker and highly localised activations, perhaps due to the noise-sensitive nature of phase-based EPT5. Noise was observed in the fitted fEPT responses (Panel C in Figures 2-5), suggesting further noise correction may be required to improve statistical power. We observed positive (Figures 2 and 4) as well as negative (Figures 3 and 5) activations at similar locations in both ME-EPI datasets, with slightly stronger and more intensive negative activations.Conclusion
Here, we demonstrated a method to obtain high-resolution whole-brain fEPT for the first time using a multi-echo 2D-EPI sequence. Although these fEPT visual activations are weak, less extensive and noisy compared with conventional BOLD fMRI, this method demonstrates the potential for simultaneous fMRI and fEPT. Further optimisation of the fEPT pipeline is needed, and future analysis of large groups may enable robust physiological interpretations and biophysical models of the fEPT activations.Acknowledgements
Authors JL, JN, OA, PF and KS are supported by European Research Council Consolidator Grant (DiSCo MRI SFN 770939). Author OCK was supported by the EPSRC-funded UCL Centre for Doctoral Training in Intelligent, Integrated Imaging in Healthcare (i4health) (EP/S021930/1).References
[1] M. F. Callaghan and N. Corbin. Advanced Neuro MR Techniques and Applications, Chapter 15. Elsevier, 2021.
[2] M. Helle and U. Katscher. Electrical Properties Tomography based Functional Magnetic Resonance Imaging (EPT-fMRI). Proc. Ann. Meeting ISMRM 2019; 3759.
[3] R. Schmidt. Electrical Conductivity as A Potential Mean to Decouple the Hemodynamic Response from fMRI. Proc. Ann. Meeting ISMRM 2019; 3777.
[4] U. Katscher, and C. A.T. van den Berg. Electric Properties Tomography: Biochemical, Physical and Technical Background, Evaluation and Clinical Applications. NMR Biomed. 2017; 30(8): e3729.
[5] S. K. Lee, et al. Theoretical Investigation of Random Noise-Limited Signal-to-Noise Ratio in MR-Based Electrical Properties Tomography. IEEE Trans. Med. Imaging. 2015; 34(11): 2220-2232.
[6] K. J. Jung, et al. Investigation of Electrical Conductivity Changes during Functional Activity of the Brain via Phase-based MR-EPT: Preliminary Observation. Proc. Ann. Meeting ISMRM 2023; 0922.
[7] G. H. Jahng, et al. High-frequency Conductivity Signal Changes Measured with Functional MREPT during Visual Stimulation. Proc. Ann. Meeting ISMRM 2023; 0923.
[8] B. Kressler, et al., Nonlinear Regularization for per Voxel Estimation of Magnetic Susceptibility Distributions from MRI Field Maps. IEEE Trans. Med. Imaging. 2010; 29(2): 273-281.
[9] A. Karsa, and K. Shmueli. SEGUE: A Speedy rEgion-Growing Algorithm for Unwrapping Estimated Phase. IEEE Trans. Med. Imaging. 2018; 38(6): 1347-1357.
[10] O. Arsenov, et al. Rapid In-Vivo Quantitative Conductivity Mapping in the Human Brain Using a Multi-Echo EPI Sequence. Proc. Ann. Conference BIC-ISMRM 2023; PT4-5.
[11] J. Ashburner, et al. SPM12 Manual. Wellcome Trust Centre for Neuroimaging, London, 2021.
[12] A. Karsa, and K. Shmueli. New Approaches for Simultaneous Noise Suppression and Edge Preservation to Achieve Accurate Quantitative Conductivity Mapping in Noisy Images. Proc. Ann. Meeting ISMRM 2021; 3774.
[13] B. A. Poser, et al. BOLD Contrast Sensitivity Enhancement and Artifact Reduction with Multiecho EPI: Parallel-Acquired Inhomogeneity-Desensitized fMRI. Magn. Reson. Med. 2006; 55(6): 1227–1235.
[14] M. Mikl et al. Effects of Spatial Smoothing on fMRI Group Inferences. Magn. Reson. Imaging. 2008; 26(4): 490–503.
Figures