3680
Water-fat content based electrical properties tomography using Dixon technique: a preliminary study1School of Biomedical Engineering, Anhui Medical University, Hefei, China, 2Center for Biomedical Imaging, University of Science and Technology of China, Hefei, China, 3Department of Anatomy, Anhui Medical University, Hefei, China
Synopsis
Keywords: Electromagnetic Tissue Properties, Electromagnetic Tissue Properties
Motivation: The research is motivated by the limitations of current EPT, either over-sensitive or over-simplified algorithm, prompting the development of a more accurate WF-EPT method.
Goal(s): The study aims to enhance EPT by proposing WF-EPT with Dixon technique, seeking to improve accuracy in EPs mapping for clinical applications.
Approach: We fit measured EPs data to generate the WF-EPs model, and validate our approach via human imaging.
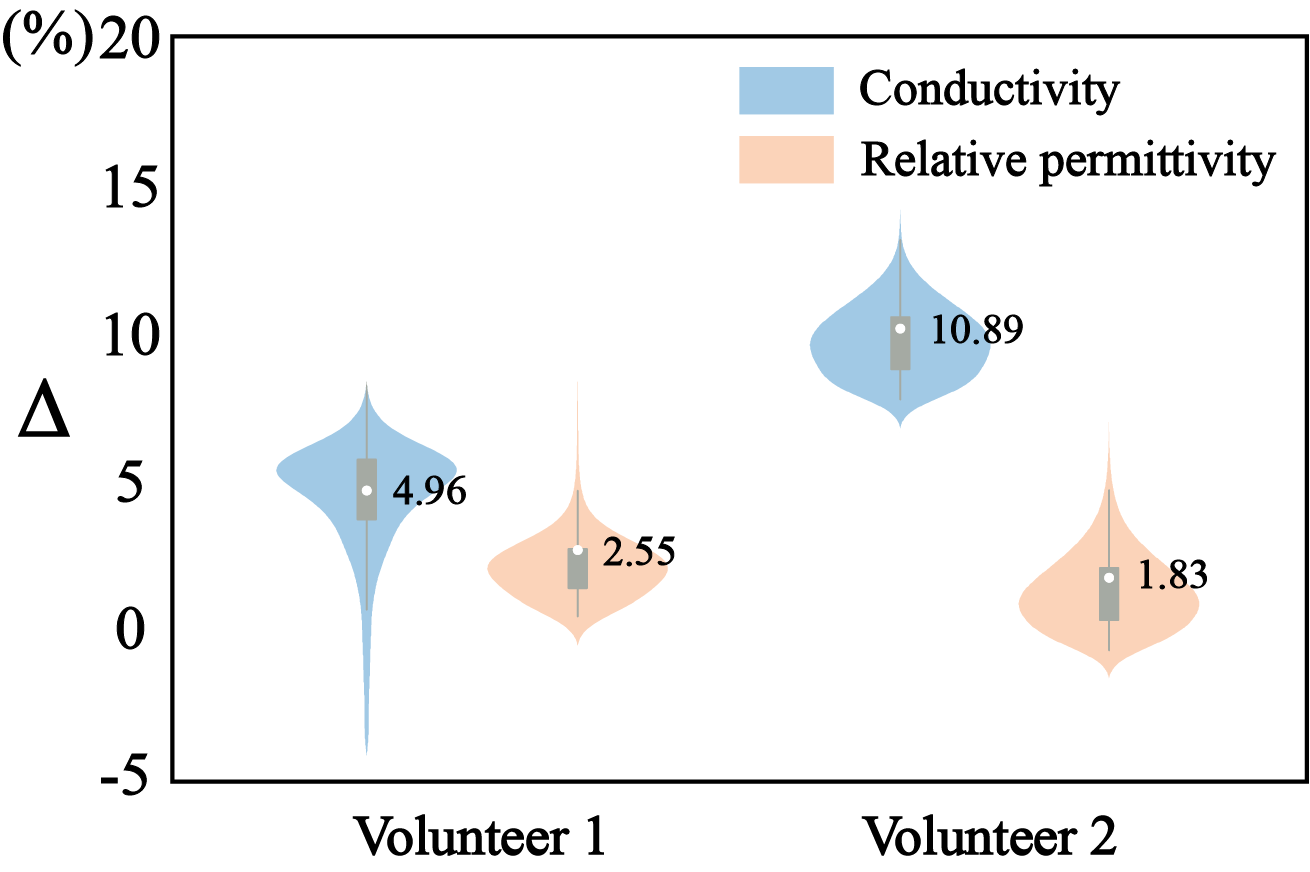
Results: Experiments showed relative errors of conductivity and relative permittivity of human liver were within 10.89% and 2.55% compared to literature values.
Impact: WF-EPT offers new insights for clinical EPT, potentially enhance applications in disease diagnosis and SAR estimation.
Introduction
Electrical properties tomography (EPT) is a non-invasive approach for electrical properties (EPs) mapping [1]. It holds significant potential for disease diagnosis [2] and estimating specific absorption rate (SAR) in ultra-high field MR [3]. However, the existing radiofrequency transmit field-based EPT (B1-EPT) is known to be highly sensitive to noise, preventing its clinical applications [4]. To overcome this limitation, the water content‐based EPT (wEPT) algorithm was developed, which provides improved resolution in EPs maps [5]. However, wEPT only considers the effects of water content on EPs, lacking other components, which would potentially introducing errors in EPs assessment. For accurate EPs mapping, it is crucial to consider other factors rather than only water, such as fat [6]. In this work, we proposed a water-fat content‐based EPT (WF-EPT) approach with Dixon technique, which commonly employed in upper abdominal MRI protocols [7]. The proposed method improves the accuracy of EPs mapping by considering both water and fat content, meanwhile also benefiting from the use of a conventional sequence, thereby facilitating its clinical applications.Methods
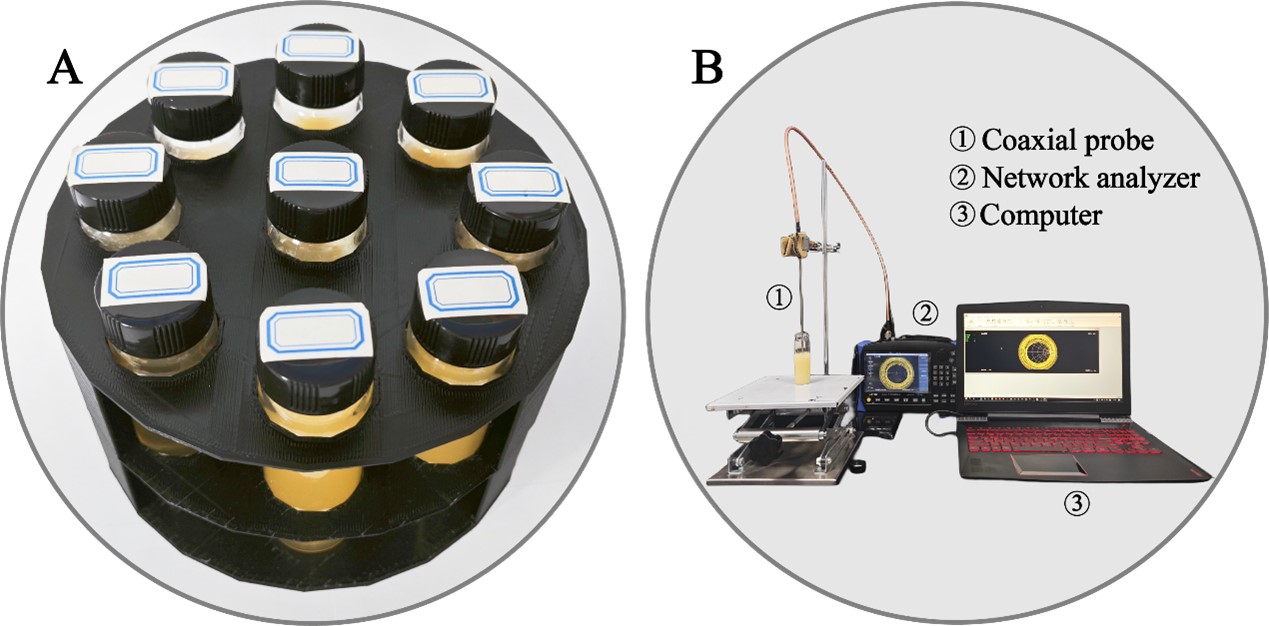
To establish the numerical relationship between fat-water and EPs (i.e. WF-EPs model), nine groups of human liver tissue phantoms with various water and fat contents was fabricated, as illustrated in Figure 1. We measured the EPs of each phantom using the open-ended coaxial prober method [8]. Following that, WF-EPs fitted model was generated by support vector machines. During the fitting process, we used the relative water content (Rw) and relative fat content (Rf) as input data. These were derived from the ratios W/Wmean and F/Fmean, where W and Wmean represent the preset water content in phantoms and the average value in healthy liver, respectively; F and Fmean represent corresponding amounts of fat. We conducted abdominal WF-EPT imaging on two volunteers using Dixon sequence at 3T. The scanning parameters: TE = 2.9 ms, TR = 140 ms, slice thickness = 8 mm, matrix size = 521×521, flip angle = 15°, and acquisition time = 18 s. The region of liver tissue was carefully segmented through 3D slicer software. To eliminate the influence of scanning parameters, we normalized water-only and fat-only signals from the Dixon images by dividing the average signal in the liver region, respectively. These normalized values were imported the well-fitted WF-EPs model to extract EPs. To evaluate the performance of WF-EPT, we calculated the relative error between our results and the literature EPs, which were defined as follows:$$\mathrm{\Delta}\sigma=\ |\sigma_m-\sigma_t\ |/\sigma_t\ast100\%$$
$$\mathrm{\Delta}\varepsilon=\ |\varepsilon_m-\varepsilon_t\ |/\varepsilon_t\ast100\%$$
Results
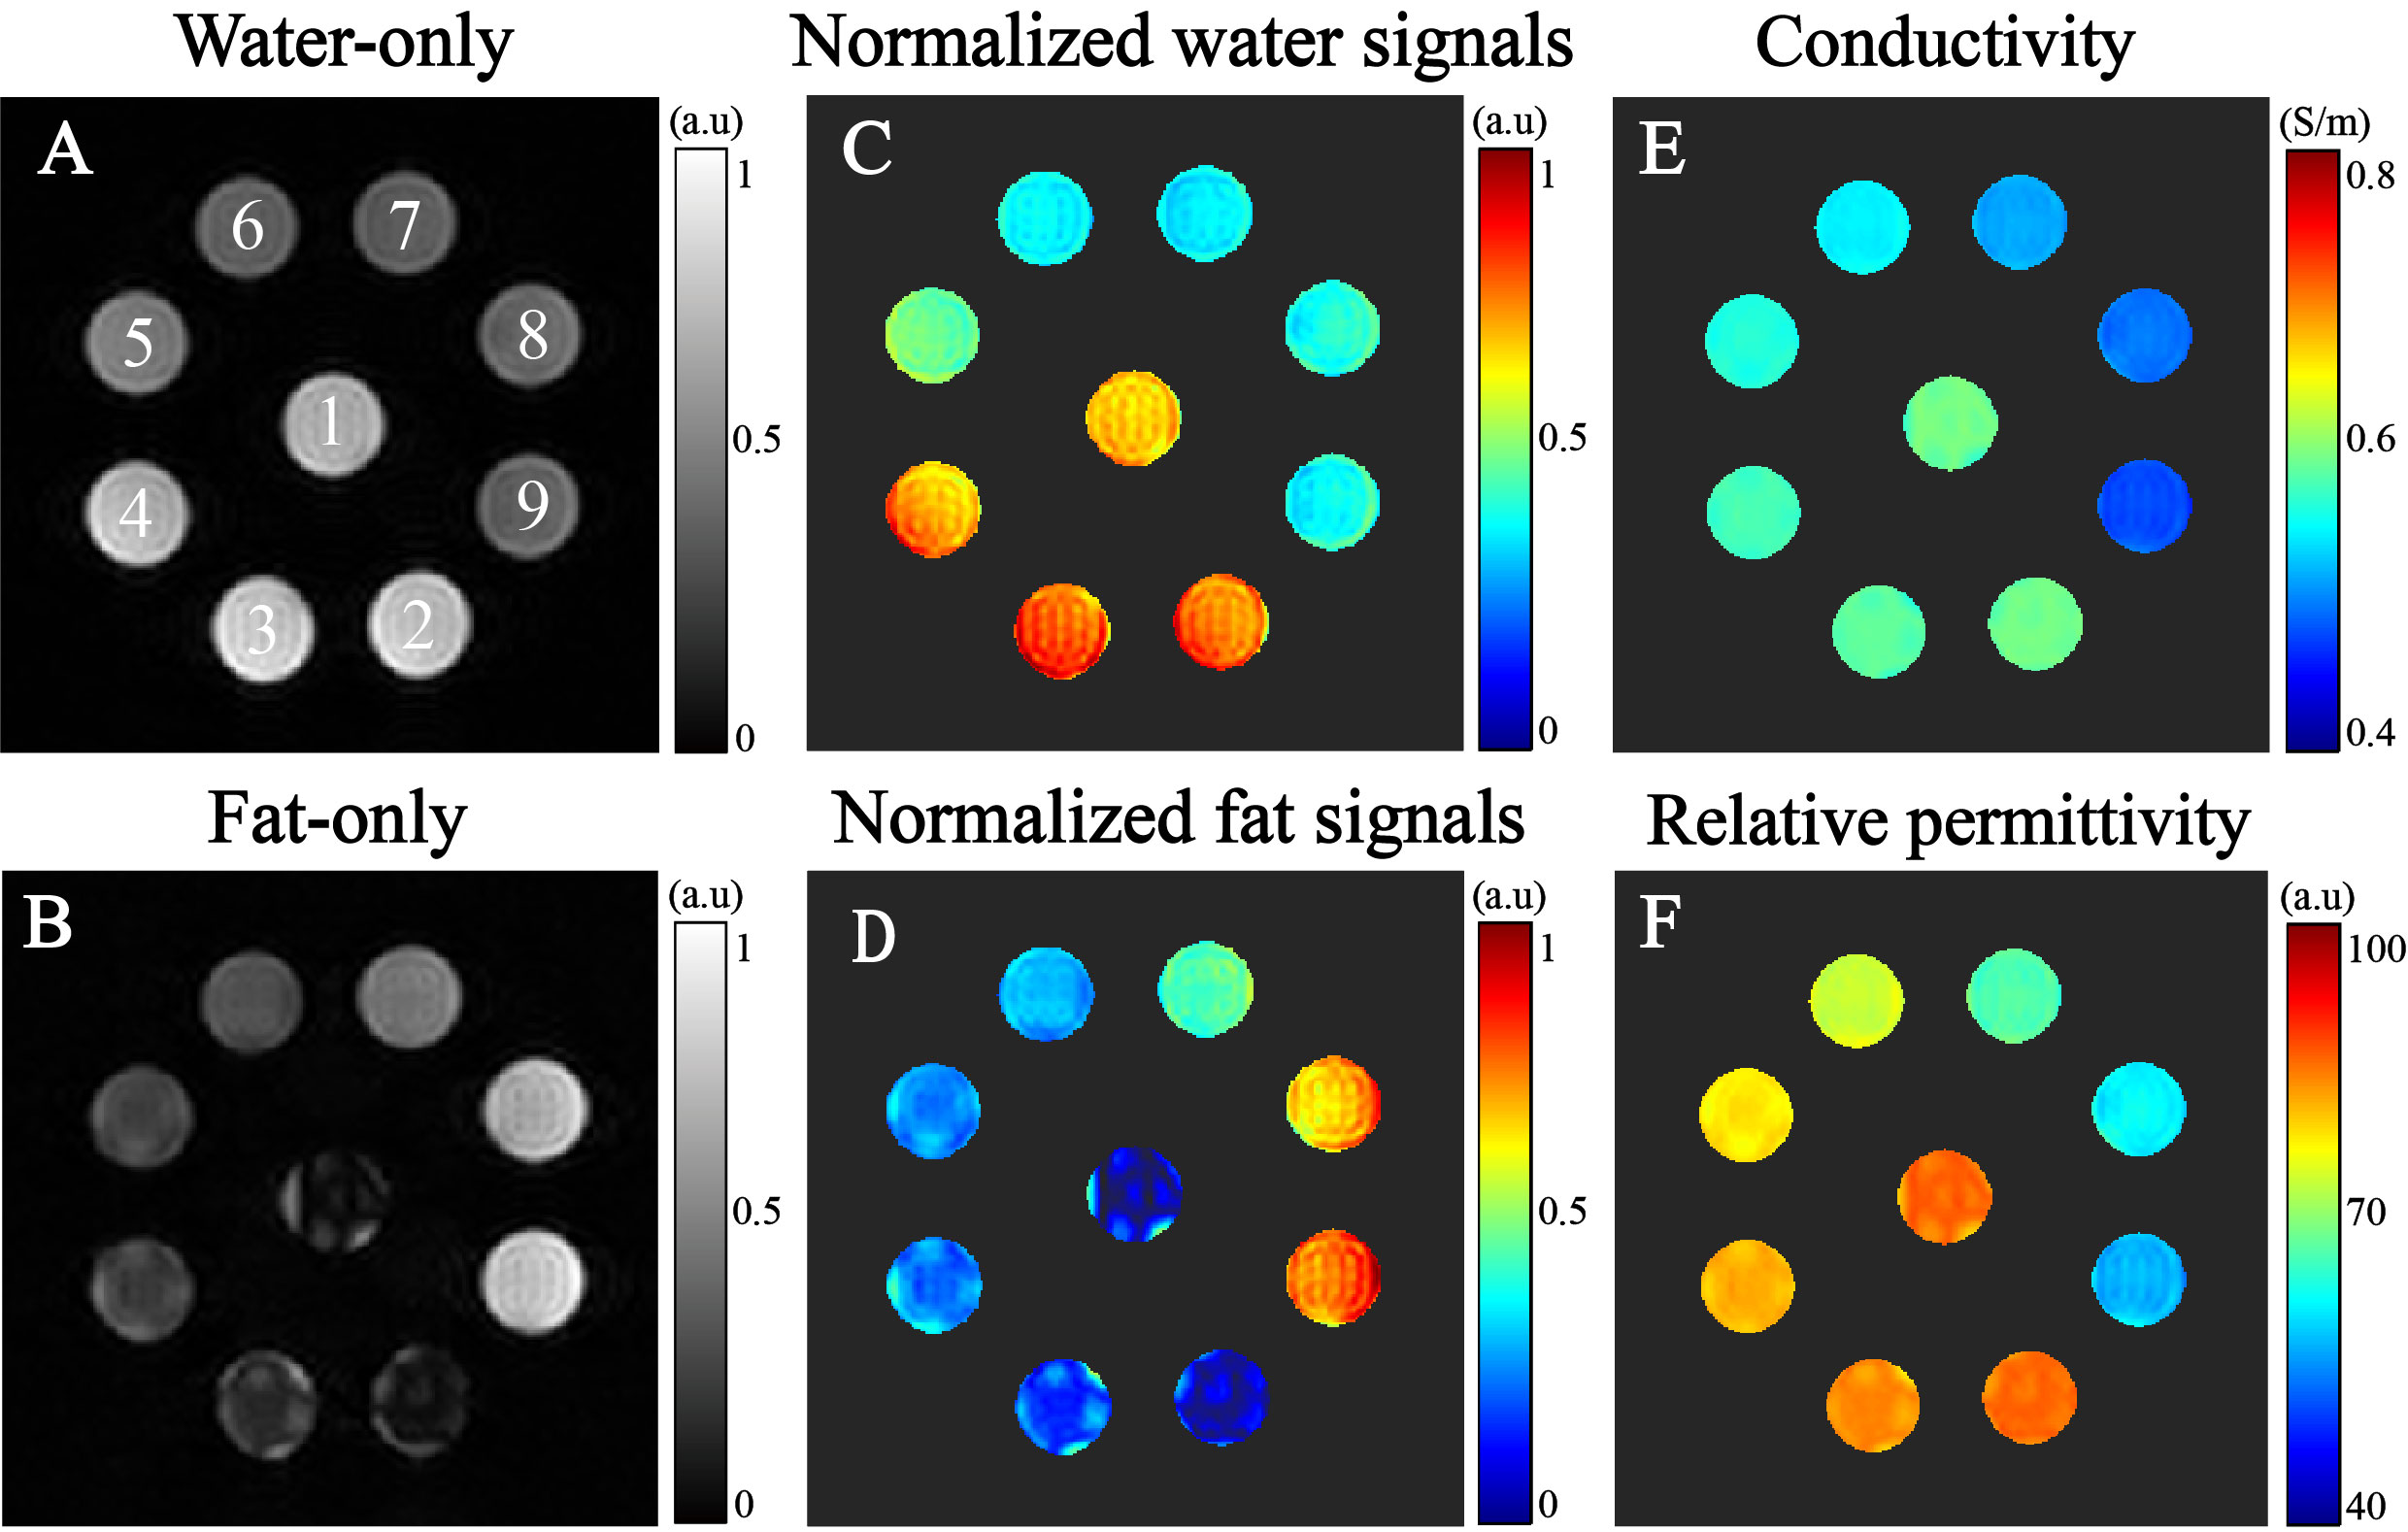
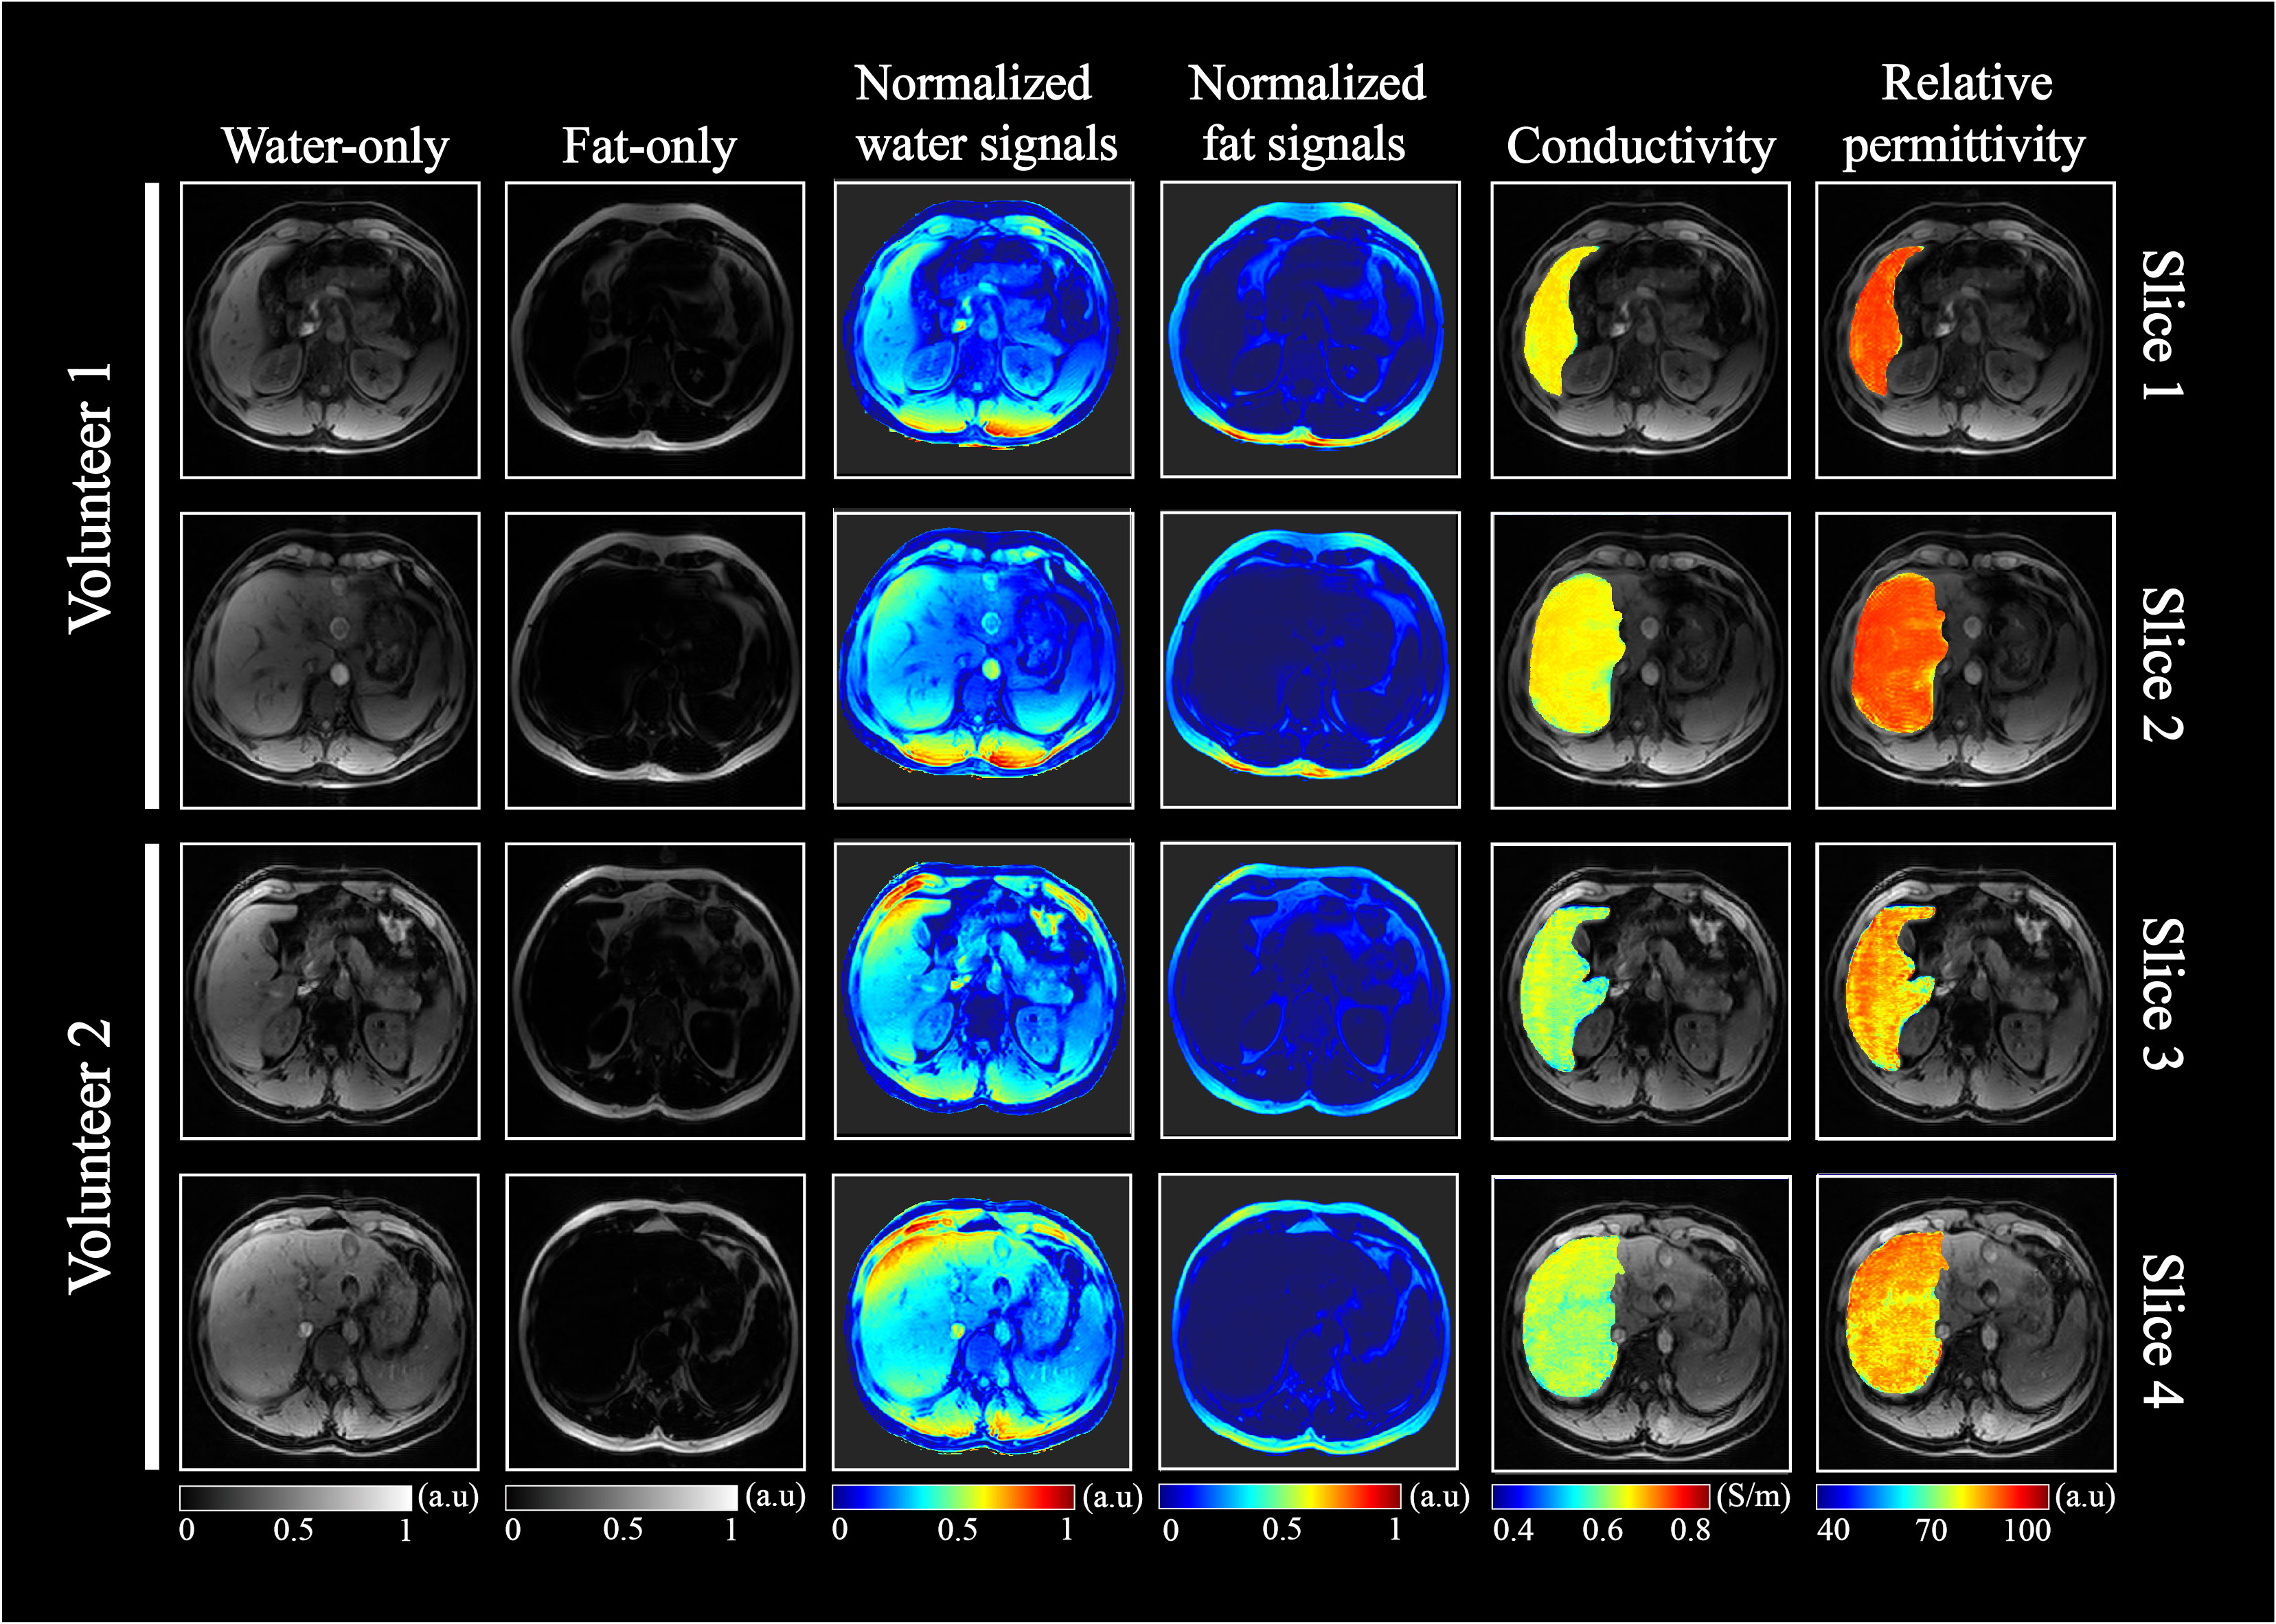
The phantom imaging results are shown in Figure 2. The relative errors of reconstructed EPs are lower than 13.0% and 8.1% for conductivity and permittivity, respectively. The results of human imaging display in Figure 3, including water-only and fat-only signal, normalized signal images and extracted EPs maps. Figure 4 illustrates the bias analysis of the liver tissue EPs, the results showed that the relative errors between literature values [9] and measured EPs by proposed method were all less than 10.89%.Discussion/Conclusion
This study demonstrated the feasibility of deriving EPs maps from water-fat content. We developed the WF-EPs model fitted by EPs data acquired from liver phantoms with varying water-fat contents. This model can be effectively integrated with the Dixon water-fat quantification technique to enable clinical EPs measurements. Human imaging experiment showed, when compared to literature values, the mean relative errors in tissue conductivity and relative permittivity of human liver, were within 10.89% and 2.55%, respectively. These findings underscore the high reliability of the proposed WF-EPT method for clinical applications, and hope this study can offer valuable insights that may contribute to the further development of EPT.Acknowledgements
This work is supported by the National Natural Science Foundation of China (Grant No. 62271007, 82102742) and the Postgraduate Innovation Research and Practice Program of Anhui Medical University (YJS20230041). The authors thank the Center for Scientific Research of School of Biomedical Engineering, Anhui Medical University for valuable help in our experiment.References
[1] Leijsen R, Brink W, van den Berg C, et al. Electrical properties tomography: A methodological review[J]. Diagnostics, 2021, 11(2): 176. [2] Ke X Y, Hou W, Huang Q, et al. Advances in electrical impedance tomography-based brain imaging[J]. Military Medical Research, 2022, 9(1): 1-22. [3] Zhang X, Schmitter S, Van de Moortele P F, et al. From Complex B1 Mapping to Local SAR Estimation for Human Brain MR Imaging Using Multi-Channel Transceiver Coil at 7T[J]. IEEE transactions on medical imaging, 2013, 32(6): 1058-1067. [4] Liu J, Wang Y, Katscher U, et al. Electrical properties tomography based on B1 maps in MRI: principles, applications, and challenges[J]. IEEE Transactions on Biomedical Engineering, 2017, 64(11): 2515-2530. [5] Michel E, Hernandez D, Lee S Y. Electrical conductivity and permittivity maps of brain tissues derived from water content based on T1‐weighted acquisition[J]. Magnetic resonance in medicine, 2017, 77(3): 1094-1103. [6] Miklavcic D, Pavselj N, Hart F X. Electric properties of tissues[J]. Wiley encyclopedia of biomedical engineering, 2006. [7] Tian D, Sun Y, Guo J, et al. 3.0 T unenhanced Dixon water-fat separation whole-heart coronary magnetic resonance angiography: compressed-sensing sensitivity encoding imaging versus conventional 2D sensitivity encoding imaging[J]. The International Journal of Cardiovascular Imaging, 2023, 39(9): 1775-1784. [8] Joof S, Aydinalp C, Dilman I, et al. A Guideline for Complex Permittivity Retrieval of Tissue-Mimicking Phantoms From Open-Ended Coaxial Probe Response With Deep Learning[J]. IEEE Transactions on Microwave Theory and Techniques, 2022, 70(11): 5105-5115. [9] Deng G, Cai L, Feng J, et al. Reliable Method for Fabricating Tissue‐Mimicking Materials With Designated Relative Permittivity and Conductivity at 128 MHz[J]. Bioelectromagnetic, 2021, 42(1): 86-94.Figures