3679
Complex B1+ field predictions to evaluate Electrical Properties Tomography reconstructions.1Department of Radiotherapy, Division of Imaging and Oncology, University Medical Center Utrecht, Utrecht, Netherlands, 2Computational Imaging Group for MR Therapy and Diagnostics, University Medical Center Utrecht, Utrecht, Netherlands, 3Department of Electrical and Electronic Engineering, Yonsei University, Seoul, Korea, Republic of
Synopsis
Keywords: Electromagnetic Tissue Properties, Electromagnetic Tissue Properties, Conductivity, EPT
Motivation: Electrical properties (EPs) are reconstructed from complex B1+ maps. In-vivo reconstructed EPs values presented in literature show large variations, reducing the confidence in the quality/accuracy of the reconstruction methods.
Goal(s): To develop a method to compute complex B1+ fields from EPs maps, which can the verify accuracy of EPs reconstructions.
Approach: Complex B1+ maps are predicted using a finite difference-based approach. The difference between the predicted and measured fields is used as surrogate error of the estimated input EPs.
Results: The method shows accurate complex B1+ field reconstructions in 2 minutes and the ability to localize errors in the input EPs maps.
Impact: Complex B1+ fields are predicted using tissue electrical properties maps as input. This method provides a way to assess the quality/accuracy of in-vivo electrical properties reconstructions, providing a means to gain confidence in the reconstructed electrical properties values.
Introduction
In MR-based Electrical Properties Tomography (EPT), Electrical Properties (EPs, conductivity σ and relative permittivity εr) are reconstructed from complex radiofrequency B1+ fields.Physics-based MR-EPT reconstructions suffer from noise and boundary errors leading to large variations in in-vivo EPs reconstructions1,2. Deep learning methods are more robust, but suffer from generalization problems for input data not present in training (e.g. pathologies)3. These problems lead to low confidence in the reconstructed EPs maps, problematic for clinical translation4.
We present a physics-based method to compute complex B1+ maps from given (reconstructed) EPs maps. The error between the measured and predicted, complex B1+ maps, is here used as surrogate of the accuracy/quality of the EPs maps given as input. We demonstrate this for simulated and measured data.
Theory
The EPs are related to the complex B1+ field ($$$B_1^+=|B_1^+|e^{i\phi^+}$$$ with |B1+|=magnitude and ф+=transmit phase) by5:$$-\nabla^2B_1^+=\omega^2\mu_0\varepsilon_cB_1^+-\bigg(\frac{\partial{B_1^+}}{\partial{x}}-i\frac{\partial{B_1^+}}{\partial{y}}\bigg)(g_x+ig_y)-\frac{\partial{B_1^+}}{\partial{z}}g_z$$
where ω=Larmor frequency, µ0=vacuum permeability, $$$\varepsilon_c=\varepsilon_0\varepsilon_r-i\frac{\sigma}{\omega}$$$ (complex permittivity), and $$$g_{x,y,z}=\frac{\partial}{\partial{x,y,z}}\ln{(\varepsilon_c)}$$$. By splitting this equation in real/imaginary parts, and approximating the derivative operators with central finite difference schemes, the |B1+| and ф+ in a voxel are expressed as function of |B1+| and ф+ of neighboring voxels and their EPs6. Then, by imposing Dirichlet boundary conditions based on the measured B1+ fields (Figure 1A), |B1+| and ф+ are estimated using the iterative Jacobi method (Figure 1B)7.
The difference Dφ/DB between the ground truth (measured) and the predicted B1+ fields ($$$D_B=|\hat{B_1^+}|-|B_1^+|$$$; $$$D_\phi=\hat{\phi^+}-\phi^+$$$) can be used to evaluate the quality/accuracy of the input EPs (reconstructed with EPT methods).
Dφ/DB does not immediately reflect local errors in the estimated EPs maps. However, given the relation between B1+ fields and the EPs, the second order derivative of Dφ/DB can be used as surrogate error map to localize errors in the input EPs maps:
$$L_B=S(\nabla^2(D_B))$$
$$L_\phi=S(\nabla^2(D_\phi))$$
where S is a smoothing (Gaussian) function. Lφ/LB thus represents the discrepancy between the estimated and actual EPs, reflected in |B1+| and ф+.
Methods
The method was tested on simulated B1+ field data (Sim4Life, Zurich MedTech, Switzerland), using a validated quadrature birdcage coil setup8, and measured data on a cylindrical phantom.Experiment 1: The B1+ field was reconstructed using correct (ground-truth) EPs as input, on a spherical phantom with two compartments having different EPs in noiseless and noisy (SNR100) cases (setup: Figure 2). This was compared to the simulated, ground-truth B1+ field to demonstrate the validity of the proposed method.
Experiment 2: We tested the impact of: 1) global under- and over-estimation of the input conductivity; 2) erroneous reconstruction of the inner compartment size; 3) presence of an anomaly in the input conductivity map.
Experiment 3: Using a brain model with tumor8, we tested the reconstruction error: 1) when correct EPs are used in input (Figure 4A); and 2) when the input EPs did not include the tumor (Figure 4B), simulating a case of erroneous MR-EPT reconstruction.
Experiment 4: We tested the method on MRI data (3 T, Philips, Ingenia) using a cylindrical phantom (see Figure 5 for sequence details and input EPs).
Results and Discussion
Figure 2 shows the accuracy of the method and its robustness to noisy B1+ data (noise in Dφ/DB only arises from noisy input B1+). Higher differences arise at the boundary due to small model imperfections, which will be addressed in future work. The predictions take ~2 minutes for a volume of 256x256x80 voxels of which ~1 million are contained within the reconstructed geometry.Figure 3 shows that, compared to the reconstruction using the correct EPs as input (A), the presence of a global offset (B) leads to a higher global Dφ. Changing the inner compartment size (C) shows a Dφ offset in the inner compartment. The presence of an anomaly (D) shows a higher Dφ around the anomaly. Overall, Lφ clearly reflects these variations in the input conductivity.
Predicting B1+ in the brain results in higher Dφ/DB compared to the spherical phantom (Figure 4A), mainly originating from the CSF boundaries. Figure 4B clearly shows a higher Dφ and Lφ when the tumor is not provided in input
Figure 5 shows the applicability of the methodology to measured data, with comparable errors as observed in simulations. The error maps suggest ground-truth EPs are slightly lower.
Future study will address the impact of using the transceive phase instead of the transmit phase.
Conclusion
We developed a physics-based method for B1+ predictions from EPs maps reconstructed using MR-EPT. The difference between the measured and predicted |B1+| and ф+ can be used as surrogate for the accuracy/quality of the EPs maps, adding confidence to in-vivo MR-EPT reconstructions, where ground truth is not available.Acknowledgements
This work received funding from the Netherlands Organization for Scientific Research (NWO; VENI grant no. 18078), the Artificial Intelligence working group of the EWUU alliance; and the ISMRM research exchange program.References
[1] Leijsen, R., Brink, W., van den Berg, C., Webb, A., & Remis, R. (2021). Electrical properties tomography: A methodological review. Diagnostics, 11(2), 176.[2] Mandija, S., Petrov, P. I., Vink, J. J., Neggers, S. F., & van den Berg, C. A. (2021). Brain tissue conductivity measurements with MR-electrical properties tomography: an in vivo study. Brain topography, 34, 56-63.
[3] Mandija, S., Meliadò, E. F., Huttinga, N. R., Luijten, P. R., & van den Berg, C. A. (2019). Opening a new window on MR-based electrical properties tomography with deep learning. Scientific reports, 9(1), 8895.
[4] Tha, K. K., Katscher, U., Yamaguchi, S., et. al. (2018). Noninvasive electrical conductivity measurement by MRI: a test of its validity and the electrical conductivity characteristics of glioma. European radiology, 28, 348-355.
[5] Liu, Jiaen, et al. "Electrical properties tomography based on $ B_ {{1}} $ maps in MRI: principles, applications, and challenges." IEEE Transactions on Biomedical Engineering 64.11 (2017): 2515-2530.
[6] Wang, Yicun, et al. "Mapping electrical properties heterogeneity of tumor using boundary informed electrical properties tomography (BIEPT) at 7T." Magnetic resonance in medicine 81.1 (2019): 393-409.
[7] Andrilli, S., & Hecker, D. (2022). Elementary linear algebra. Academic Press.
[8] Meerbothe TG, Meliado EF, Stijnman PRS, van den Berg CAT, Mandija S. A Database for MR-based Electrical Properties Tomography with in silico brain data – ADEPT, Magn Reson Med. 2023; 1-10. doi: 10.1002/mrm.29904
[9] Yarnykh VL. Actual flip-angle imaging in the pulsed steady state: a method for rapid three-dimensional mapping of the transmitted radiofrequency field. Magnetic Resonance in Medicine: 2007. doi: 10.1002/mrm.21120
[10] Hampe N, Katscher U, van den Berg CAT, Tha KK, Mandija S. Deep learning brain conductivity mapping using a patch-based 3D U-net. arXiv preprint. 2019. doi: 10.48550/arXiv.1908.04118.
Figures
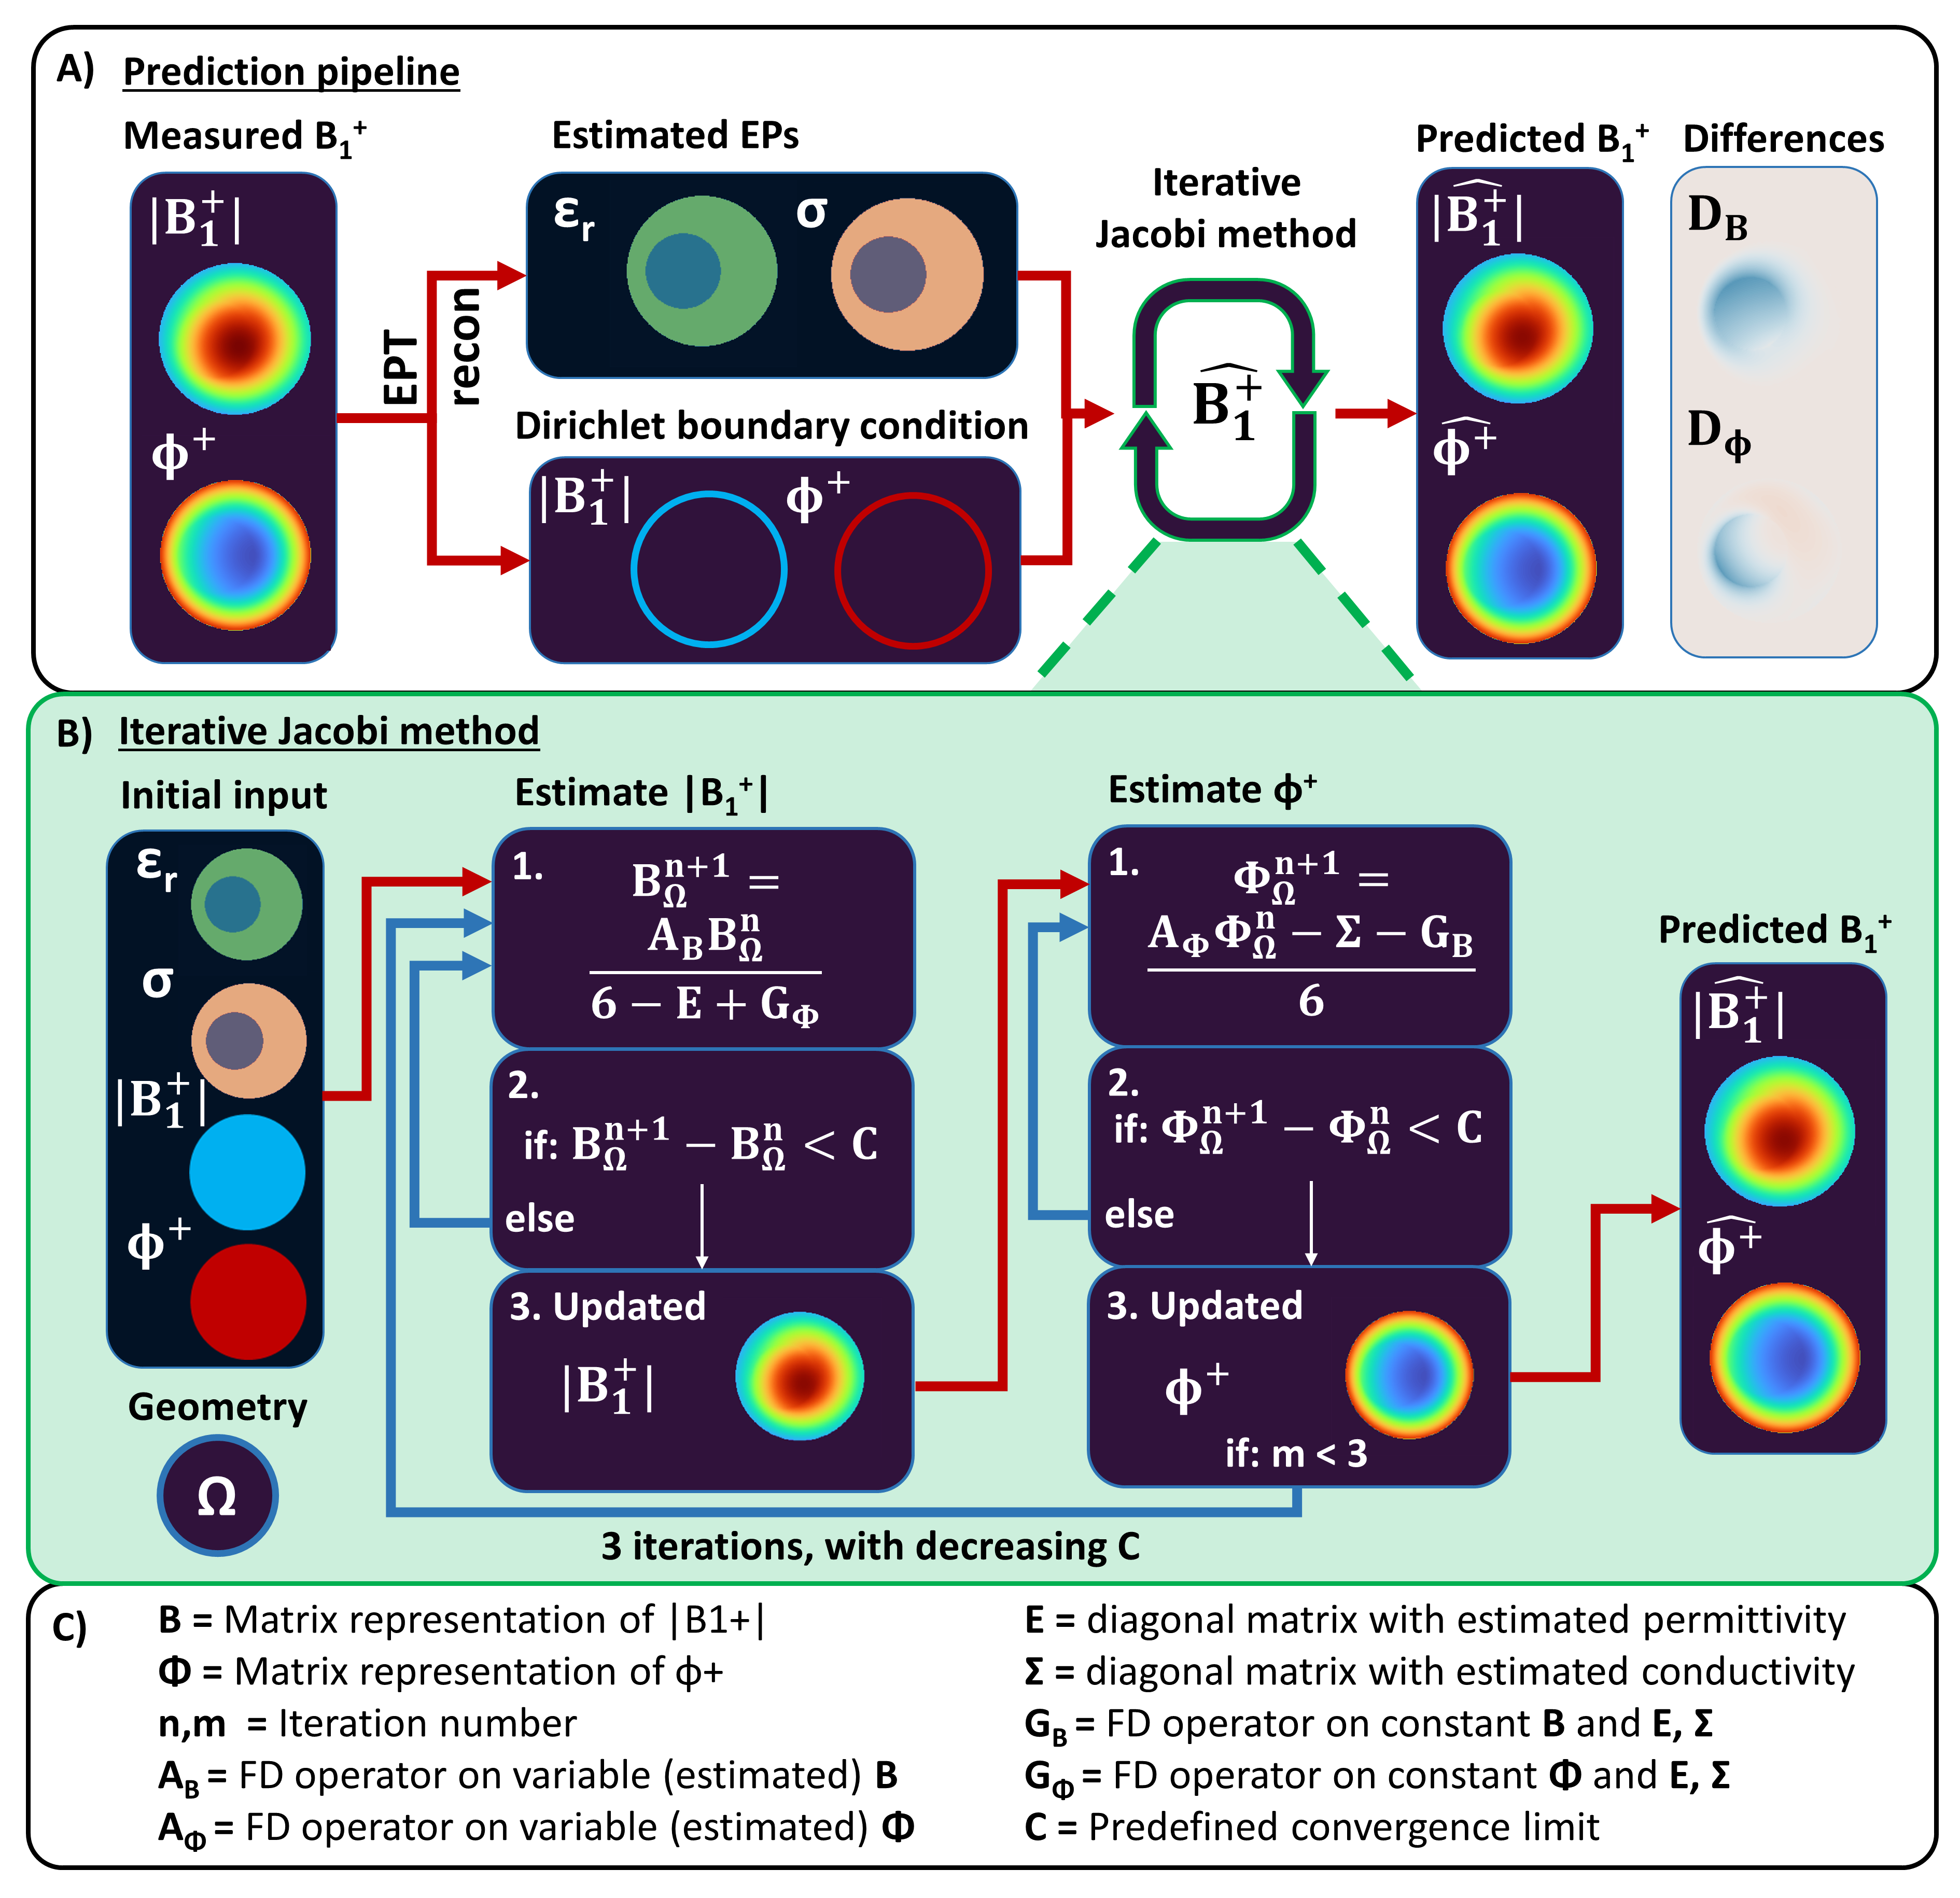
Figure 1: A) Overview of the reconstruction method. B) Overview of iterative Jacobi method used to predict the complex B1+ field. With initial input of EPs and constant initialization of B1+, |B1+| and ф+ are iteratively estimated. Red line depicts sequential predictions on |B1+| and ф+, blue lines depict the iterative process. C) Overview of the used symbols.
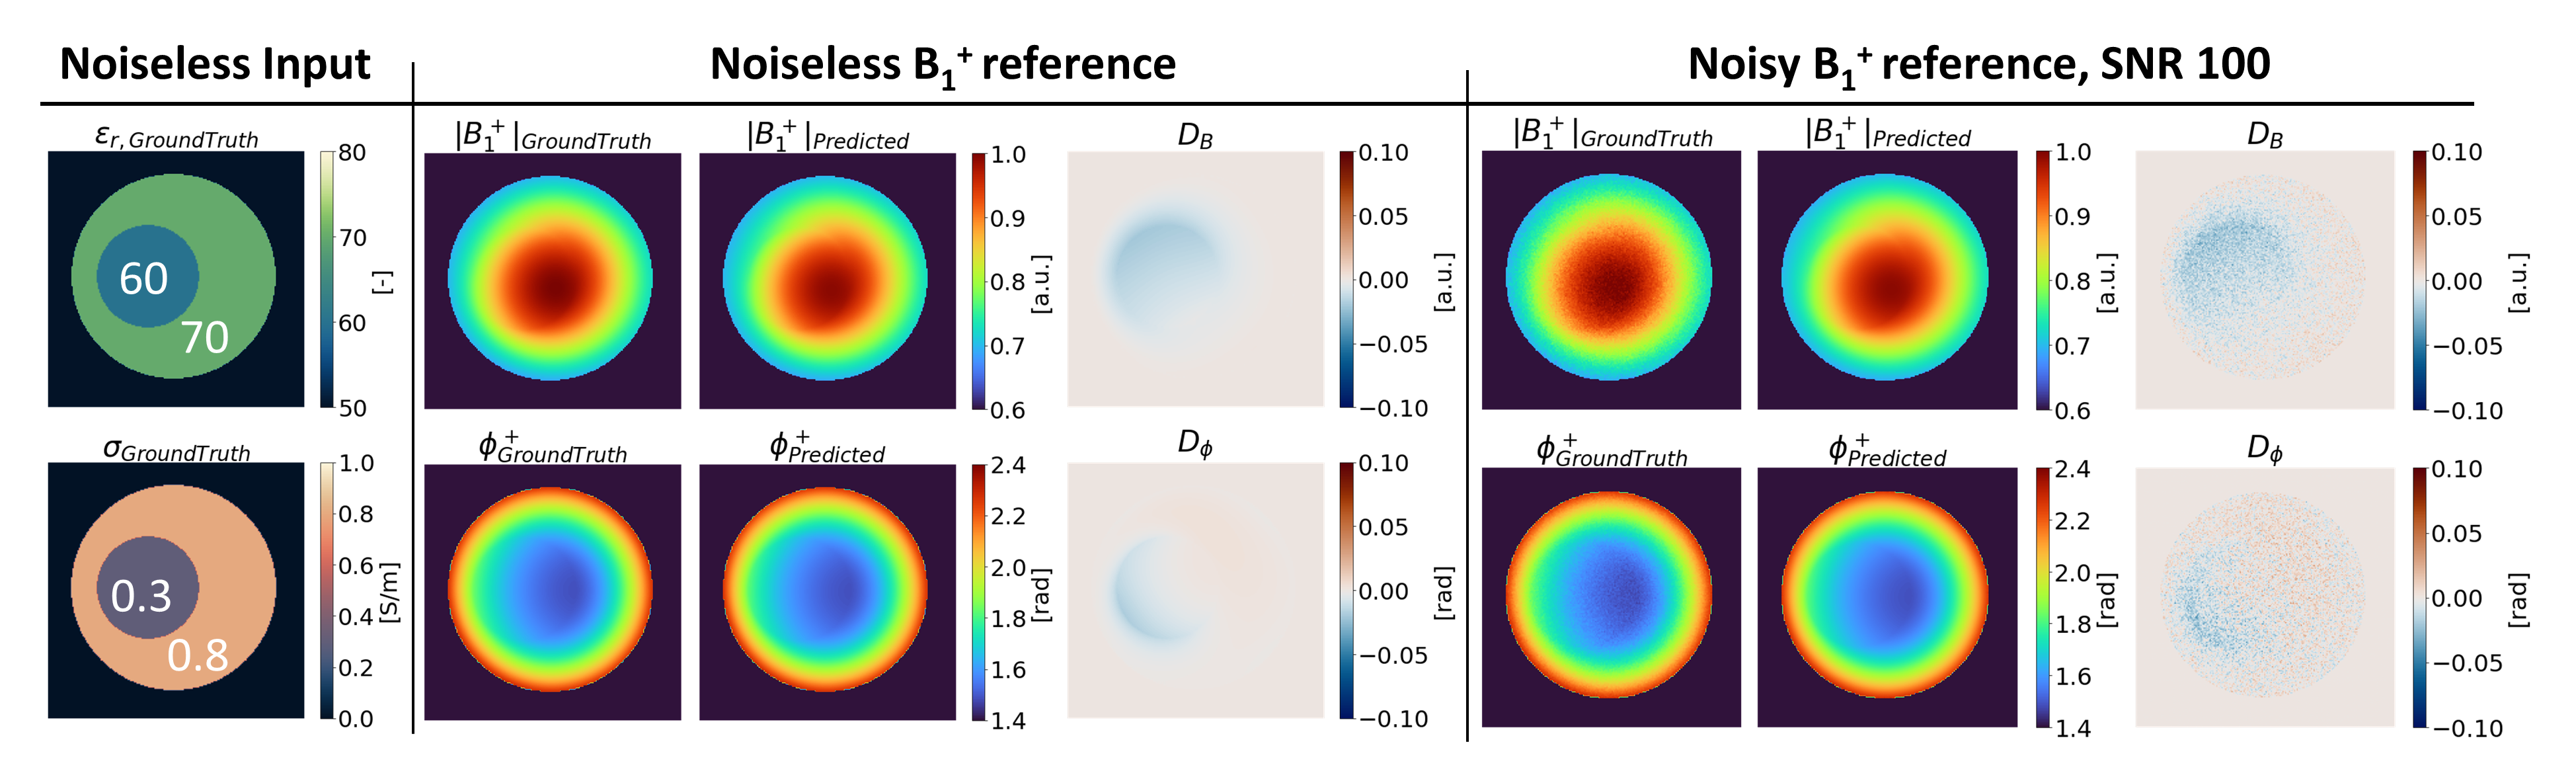
Figure 2: Predicted B1+ map for a spherical phantom with two compartments, both without and with noise in the reference B1+ maps. Correct (ground–truth) EPs are used as input.
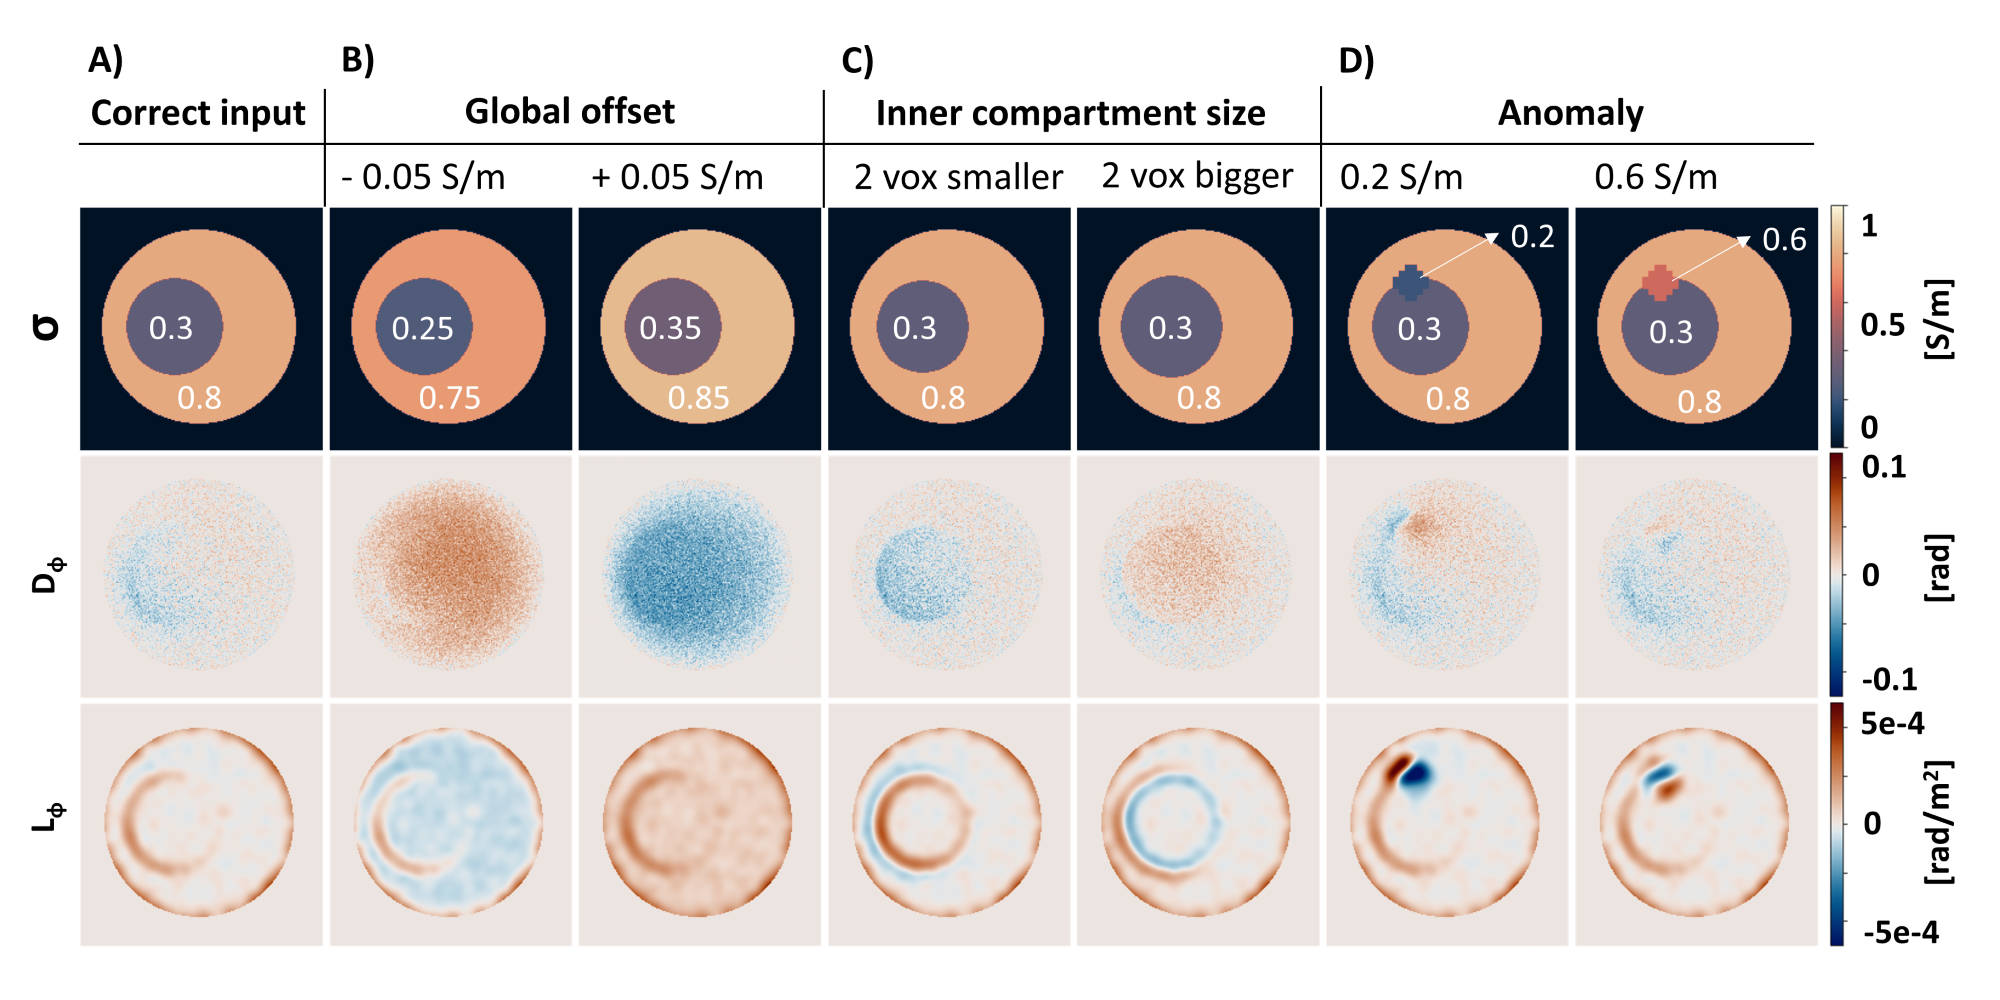
Figure 3: Demonstration of how small input errors in conductivity maps propagate in the Dφ and Lφ maps . A) Dφ and Lφ computed from ф+ predictions using the correct conductivity in input, used as a reference. B) Effect of a global offset in conductivity maps. C) Effect of erroneous reconstructions of the size of the inner compartment (+/- 2 voxels). D) Effect of anomalies in the conductivity map.
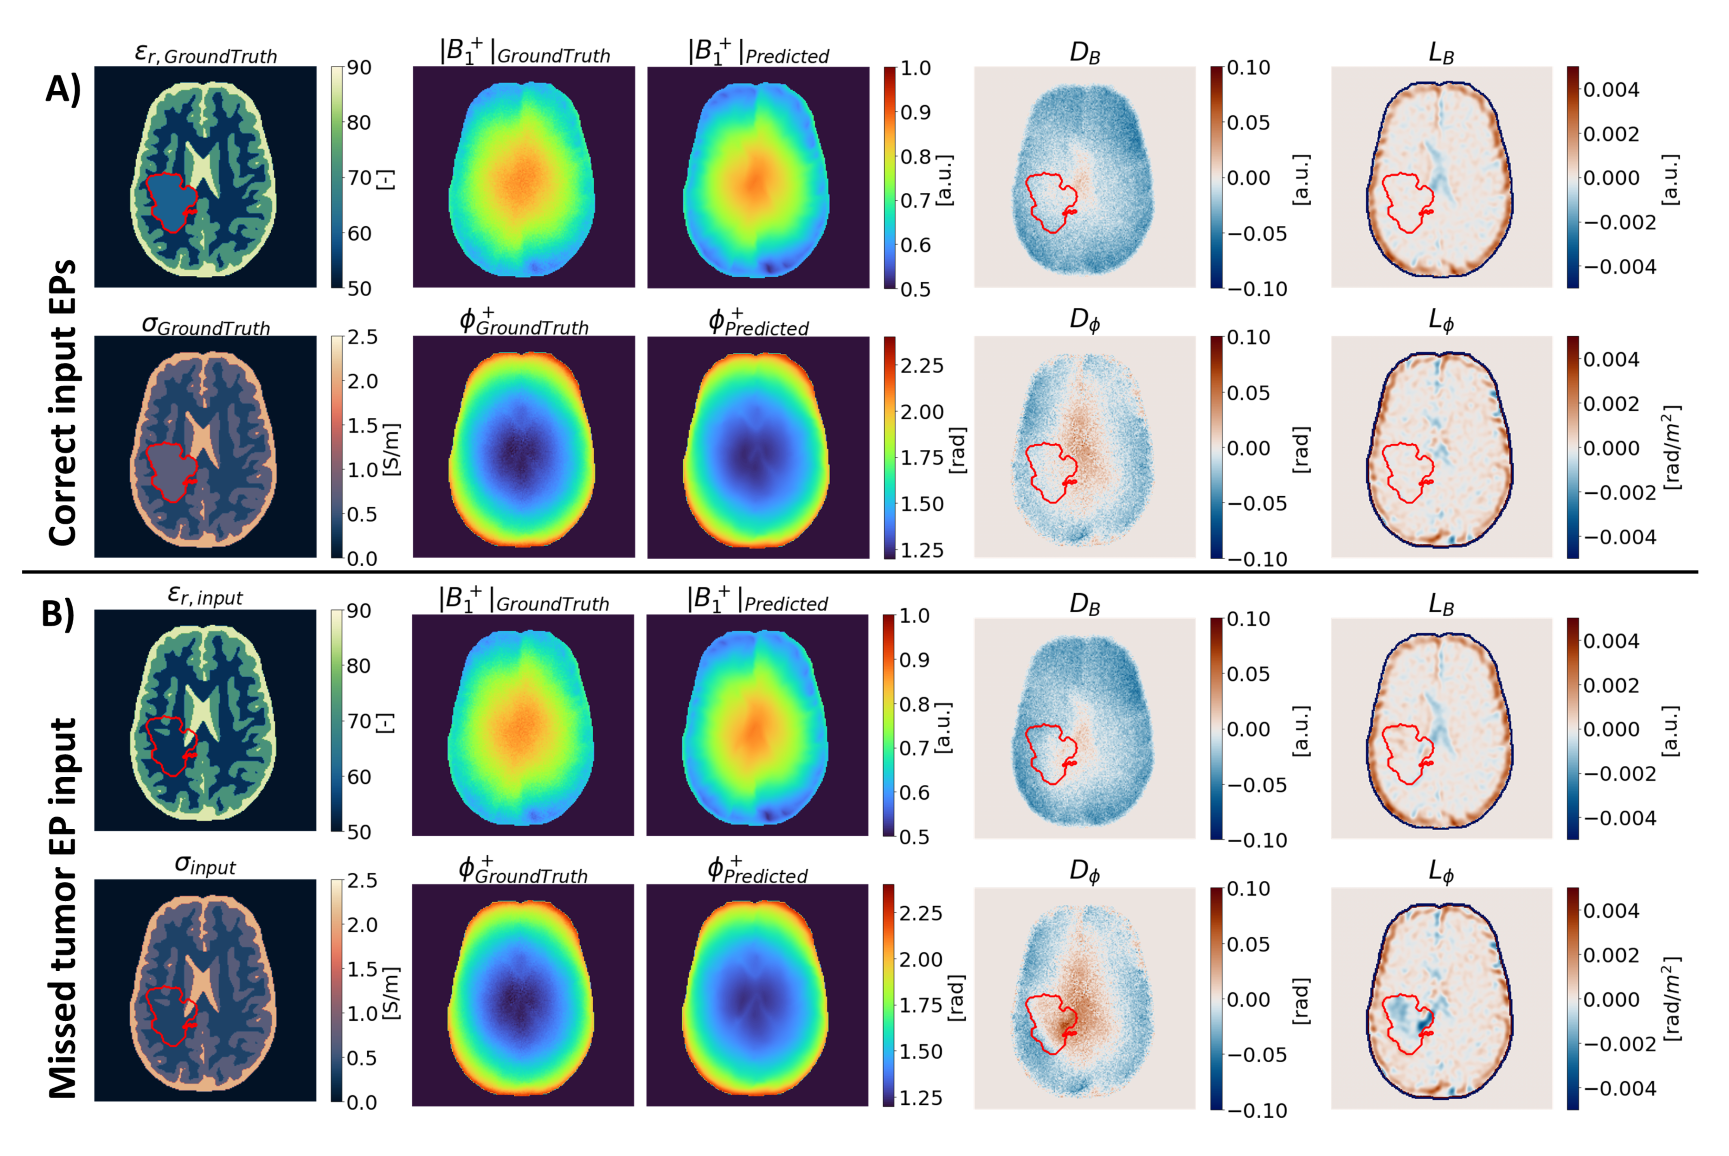
Figure 4: Example of the predicted B1+ map for a brain model with SNR 100 and a tumor. In A), the correct tumor EPs are used in input. In B), the tumor was removed in the input EPs maps, simulating the case of an erroneous MR-EPT reconstruction. Higher errors both in Dφ/DB and Lφ/LB are observed, especially distinguishable in the tumor region for Lφ error map.
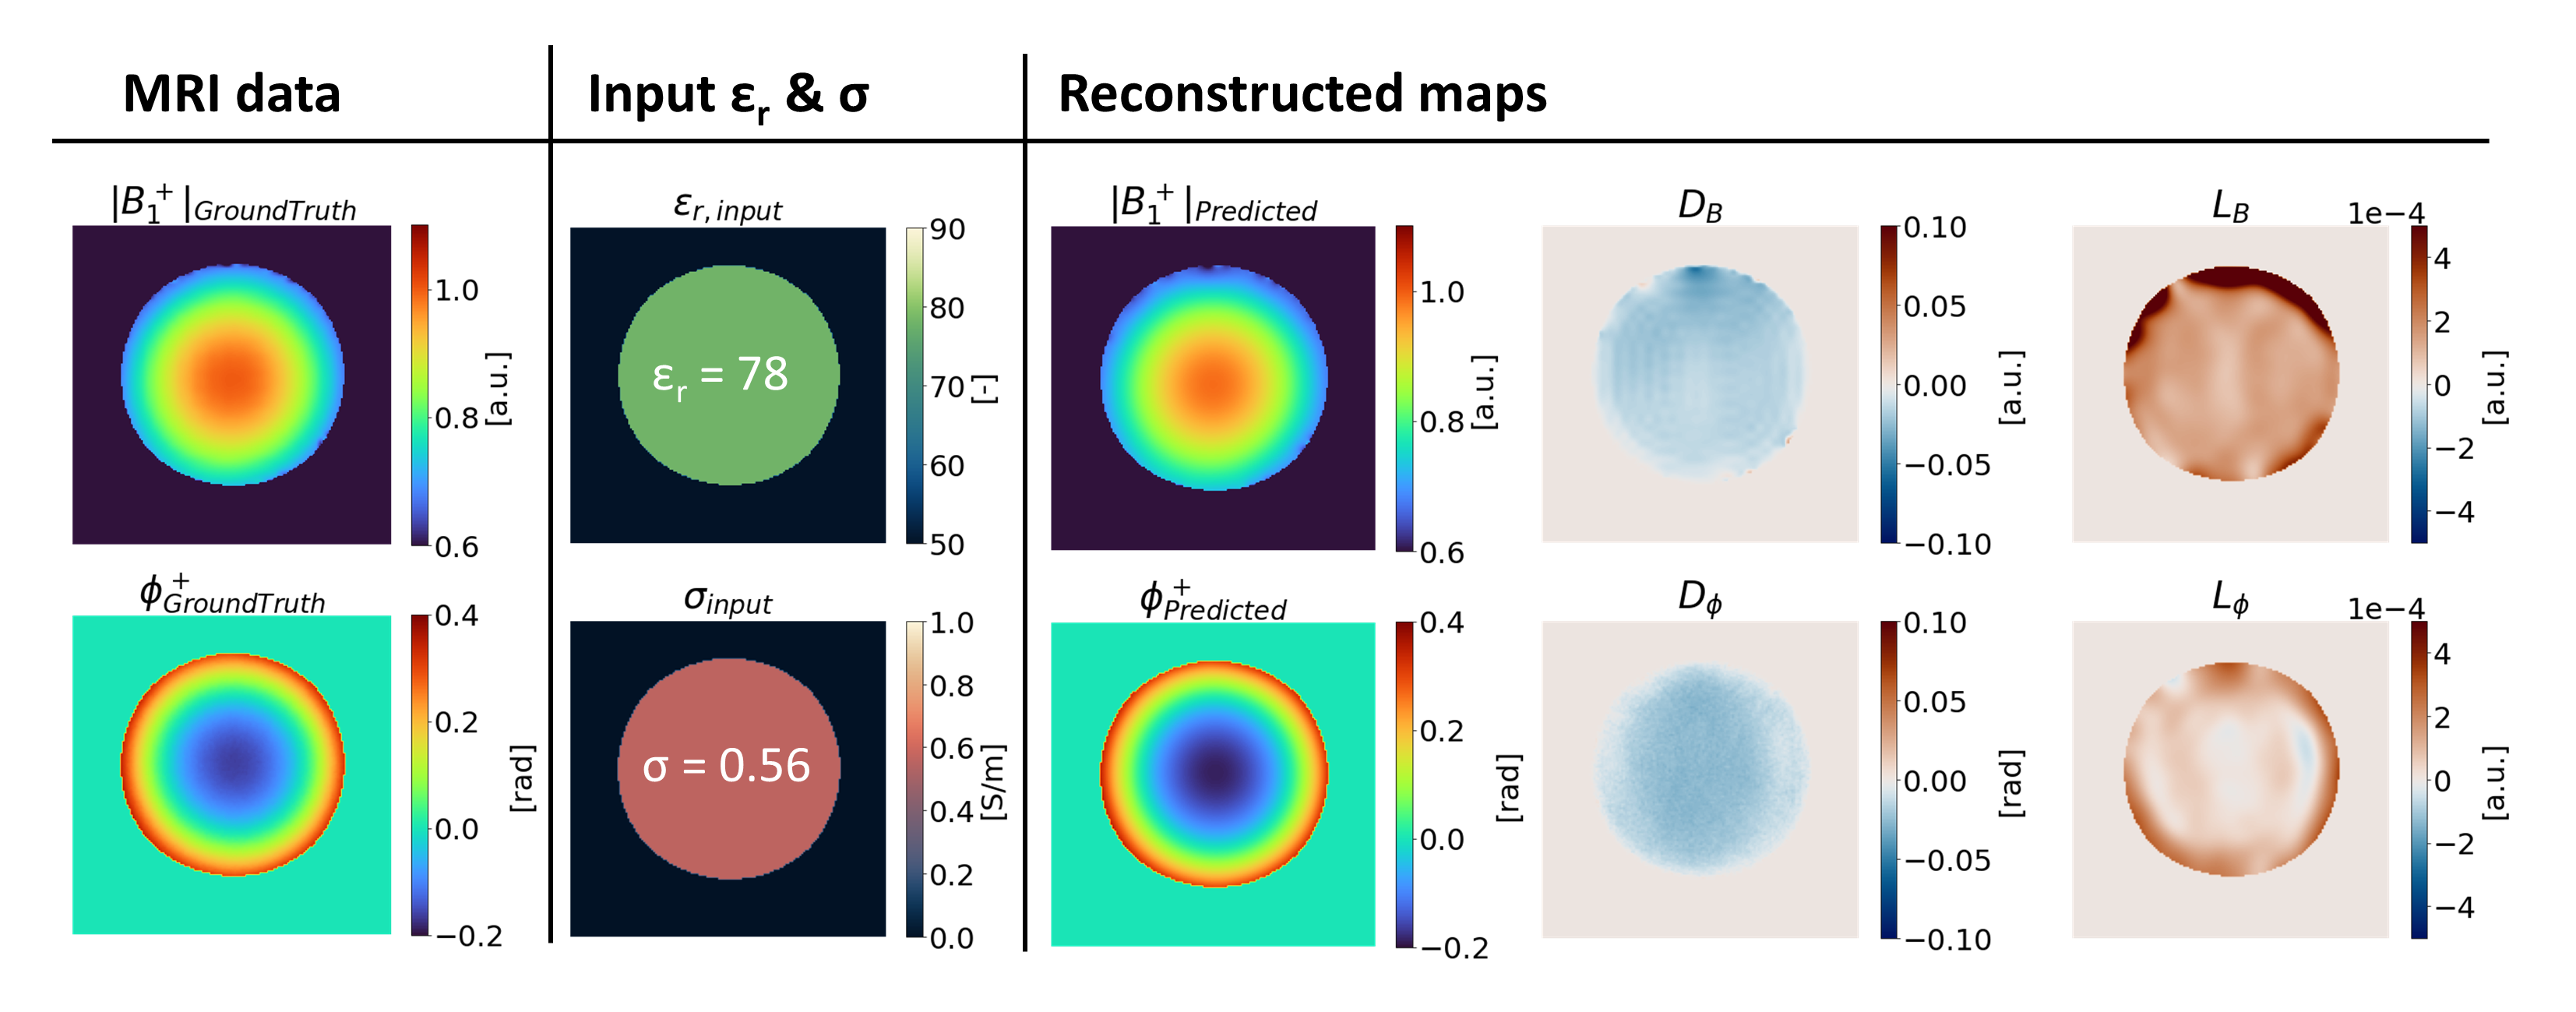
Figure 5: Predicted B1+ maps and error maps from MRI measurements on a cylindrical phantom. |B1+| was acquired using AFI9, resolution: 4X4X3 mm3; transceive phase was acquired using 3D bSSFP10, resolution: 1 mm3 isotropic. The conductivity value used in input (0.56 S/m) was obtained from 3D Helmholtz-EPT1. The theoretical conductivity value from phantom preparations was 0.6 S/m. For permittivity, the permittivity value of water was used.