3678
Ethanol reduces brain tissue electrical conductivity1Neuroscience Research Australia, Sydney, Australia, 2School of Psychology, The University of New South Wales, Sydney, Australia
Synopsis
Keywords: Electromagnetic Tissue Properties, Brain
Motivation: Ethanol is a sedative which reduces brain metabolism and activity. We hypothesise that brain tissue conductivity is related to brain activity and tested to see if ethanol ingestion reduces tissue conductivity.
Goal(s): To demonstrate a relationship between baseline brain activity and tissue conductivity.
Approach: Using MREPT, data were acquired from 41 participants before and after ingestion of vodka and the resultant electrical conductivity maps were compared.
Results: Spatially similar decreased electrical conductivity was seen in most participants. The spectrum of response was unrelated to the amount of alcohol consumed or to breath alcohol reading. No increased conductivity was seen.
Impact: The results support the hypothesis that tissue conductivity is related to brain activity. This suggests that changes in electrical conductivity may be used as a surrogate for baseline brain activity which could be a useful biomarker of injury or degeneration.
Introduction
Alcohol (EtOH) is an agonist at GABA(A) α2β3δ receptors where it is known to greatly decrease brain metabolic activity1. “Resting” brain tissue electrical conductivity, measured using MREPT2-5, may be related to baseline brain activity. Here, we measured brain electrical activity before and after consumption of sufficient vodka to increase breath alcohol concentrations to 0.07g/210 L to see if conductivity was decreased by EtOH.Methods
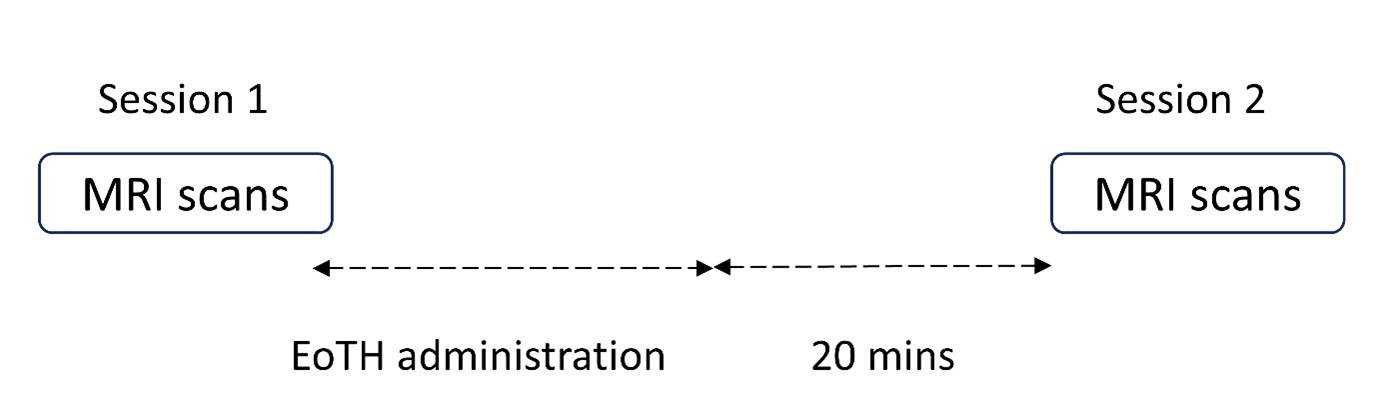
Data acquisitionsThis work was approved by the University of New South Wales human research ethics committee, and informed consent was obtained from all participants. 41 healthy young participants (Age 19.4±1.7; 15 females, 26 males) who were assessed as social drinkers were scanned immediately before and ~20 minutes after cessation of alcohol consumption (Figure 1), using balanced fast field echo (bFFE: TR/TE = 2.52/1.26 ms, nonselective RF pulses, flip angle 25°, resolution 1 mm isotropic, sagittal slices) and 3D T1-weighted turbo field echo (TFE: TR/TE = 7.10/3.38ms, resolution 1×1×1 mm3, sagittal slices, FOV 240×240 mm2, flip angle 8°). All images were acquired at 3T using a 32-channel digital head coil (Ingenia CX, Philips, Best, The Netherlands). RF shimming calibrated with B1+ mapping using full-coverage 2D DREAM was applied prior to bFFE scans.
Data analysis
In this study, phased-based MREPT was adopted as $$$\sigma=\triangledown^{2}\phi_{\pm}/2\mu_{0}\omega$$$, where σ is conductivity, $$$\phi_{\pm}$$$ denotes the transceive phase, μ0 is the magnetic permeability of free space, ω is angular frequency (Larmor frequency) and $$$\triangledown^{2}$$$ is the Laplacian operator. T1-weighted TFE images were co-registered and segmented into white matter, gray matter and CSF using FSL to alleviate boundary artifacts in the calculation. Within each tissue type, an average parabolic phase fitting method was used to reduce artifacts amplified in the Laplacian6,7, and the second derivatives of the fitted phase were taken to calculate conductivity.
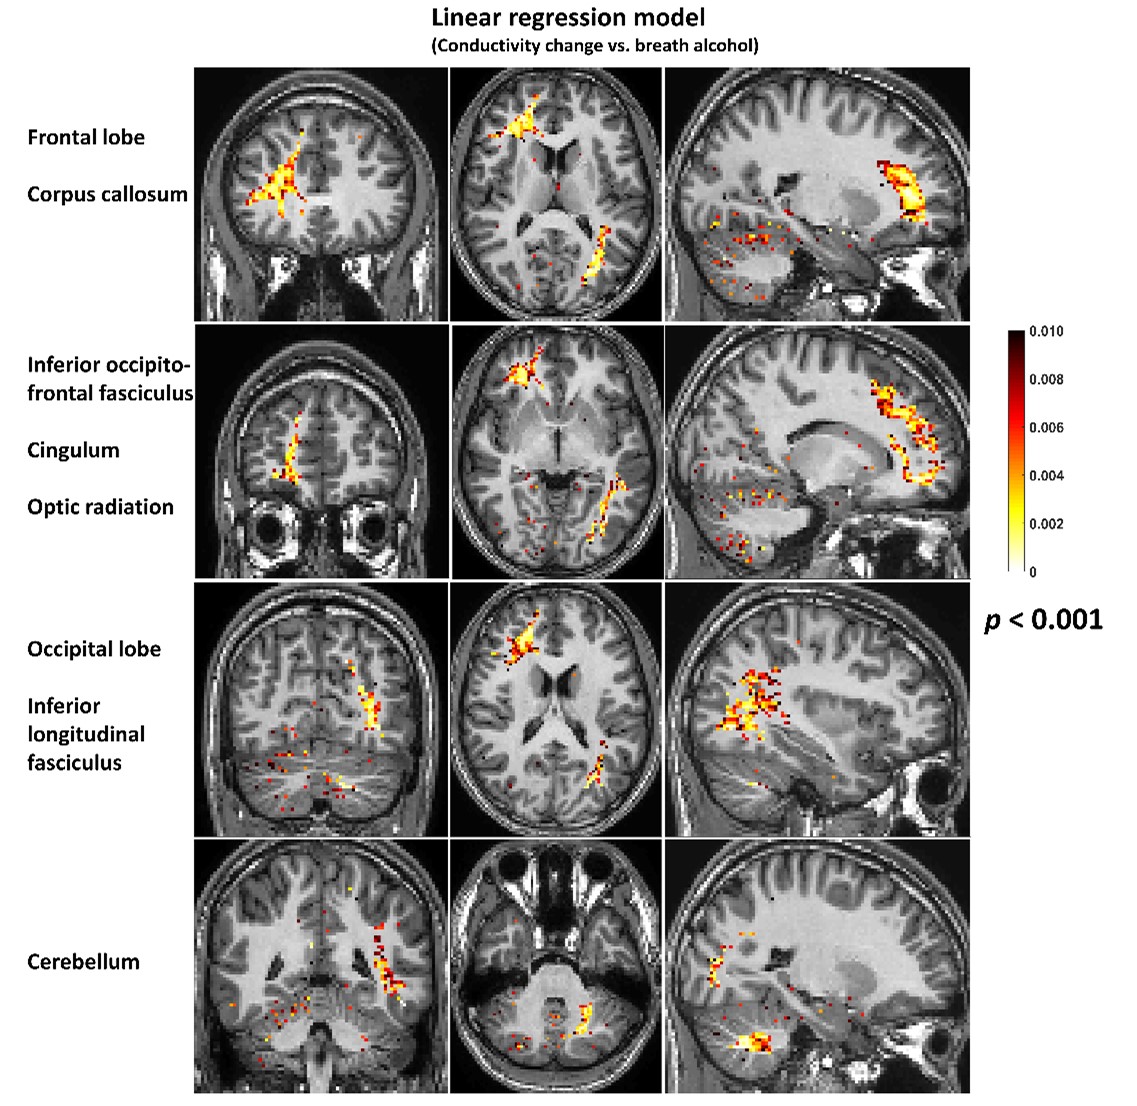
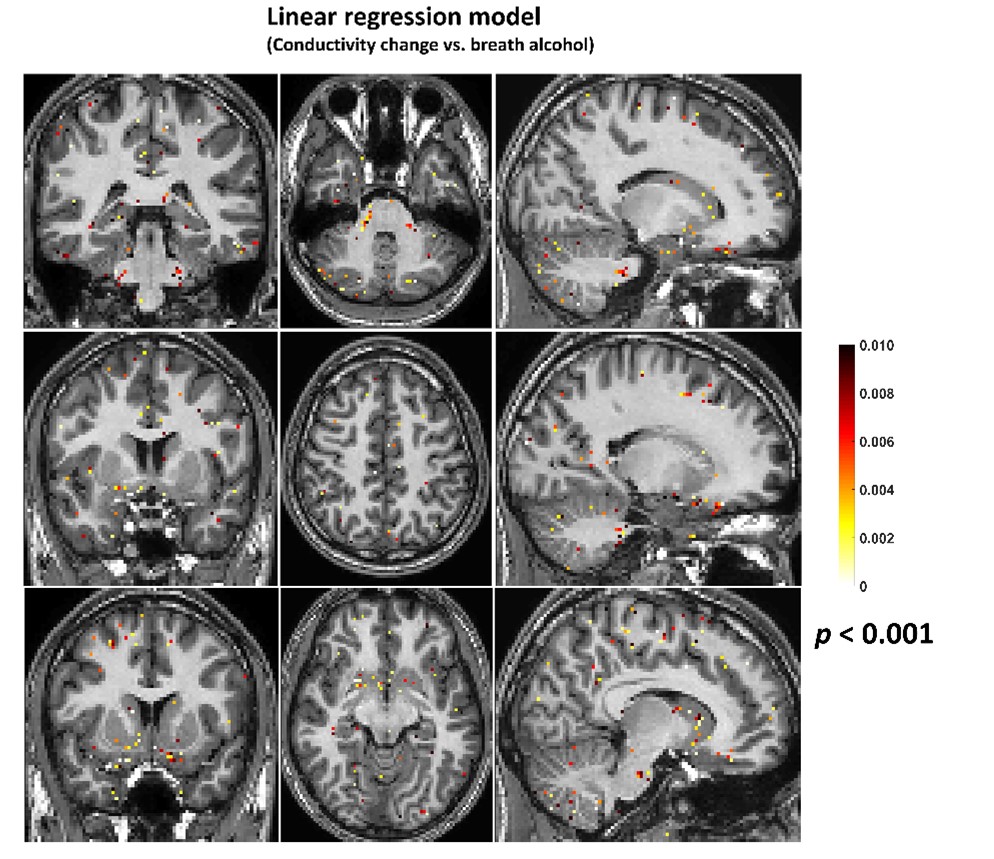
The conductivity maps of each participant from both sessions were normalized into MNI space (voxel size 2 mm isotropic) using SPM 12, and the differential conductivity map of each participant was obtained by subtracting the normalized conductivity map of the post alcohol session from that of pre. The 41 participants were categorized into three groups based on their maximum conductivity change (22 Strong responders: Δσmax > 0.1 S/m; 9 weak responders: 0.02 S/m < Δσmax < 0.1 S/m; 10 non-responders: Δσmax < 0.02 S/m). The differential conductivity maps of strong and weak responders and their breath alcohol content measurements were analyzed using linear regression to determine if conductivity change was significantly related to breath alcohol content. Brain regions where p < 0.001 were presented.
Further analysis
A principal components model was used to test associations between EtOH (strong, weak or non-responders) classification, breath alcohol, gender, dose of alcohol and score on the AUDIT (Alcohol Use Disorders Identification Test8).
Results
Decreased conductivity values following EtOH administration were observed in multiple brain regions, while no increase of conductivity was found. Figure 2 shows brain regions from the strong responders group where conductivity change was significantly decreased, mainly including the frontal lobe, occipital lobe and cerebellum, while Figure 3 shows those from the weak respondents group, where the spatial pattern of decrease was limited in the cerebellum and frontal lobe.No association was found between any of the metadata tested and EtOH classification.
Discussion
As expected, administration of EtOH reduced brain conductivity in a region dependent manner with the pattern of decrease being generally similar across all responding participants. EtOH is known to reduce brain uptake of FDG, which is related to the cerebral consumption of glucose; frontal lobe is known to be particularly impacted although the literature reports variable responses at lower concentrations of alcohol (< 0.089). The primary target of EtOH is the GABA(A) α2β3δ receptor which plays a role in extrasynaptic control of tonic inhibition, the degree of which is also related to concentrations of GABA10 all of which may result in some variation in the pattern of response to EtOH.MREPT is of sufficient precision to detect alterations in steady-state brain activity7 indicating that it could be a useful tool in drug research.
Acknowledgements
The authors acknowledge the facilities and scientific and technical assistance of the National Imaging Facility, a National Collaborative Research Infrastructure Strategy (NCRIS) capability, at the NeuRA Imaging, NeuRA, UNSW Node and are grateful to Dr Iain Ball and Mr Brendan Moran for expert technical assistance and Dr Peter Humburg for statistical advice.References
1. Rae CD, Davidson JE, Maher AD, et al. Ethanol, not detectably metabolized in brain, significantly reduces brain metabolism, probably via action at specific GABA (A) receptors and has measureable metabolic effects at very low concentrations. J Neurochem. 2014 Apr;129(2):304-14.
2. Haacke EM, Petropoulos LS, Nilges EW, et al. Extracting of conductivity and permittivity using magnetic resonance imaging. Phys. Med. Biol. 1991;36(6):723-734.
3. Wen H. Noninvasive quantitative mapping of conductivity and dielectric properties distributions using RF wave propagation effects in high-field MRI. Physics of medical imaging international society for optics and photonics. 2003; 5030:471-478.
4. Katscher U, Voigt T, Findeklee C, et al. Determination of electric conductivity and local SAR via B1 mapping. IEEE T. Med. Imaging. 2009;28(9):1365-1374.
5. Voigt T, Katscher U, Doessel O. Quantitative conductivity and permittivity imaging of the human brain using electric properties tomography. Magn. Reson. Med. 2011;66(2):456-466.
6. Katscher U, Djamshidi K, Voigt T, et al. Estimation of breast tumor conductivity using parabolic phase fitting. 20th Annual Meeting of Internal Society of Magnetic Resonance in Medicine. 2012;3482.
7. Cao J, Ball I, Humburg P, et al. Repeatability of brain phase-based magnetic resonance electric properties tomography methods and effect of compressed SENSE and RF shimming. Phys Eng Sci Med. 2023 Jun;46(2):753-66.
8. Saunders JB, Aasland OG, Babor TF, et al. Development of the alcohol use disorders identification test (AUDIT): WHO collaborative project on early detection of persons with harmful alcohol consumption‐II. Addiction. 1993 Jun;88(6):791-804.
9. de Wit H, Metz J, Cooper M. Effects of ethanol, diazepam and amphetamines on cerebral metabolic rate: PET studies using FDG. InProblems of Drug Dependence 1990 Proceeding of the 52nd Annual Scientific Meeting 1990;61.
10. Nasrallah FA, Balcar VJ, Rae CD. Activity‐dependent γ‐aminobutyric acid release controls brain cortical tissue slice metabolism. J Neurosci Res. 2011 Dec;89(12):1935-45.
Figures