3676
A metric to access the noise error propagation in phase-based MR-EPT reconstruction1Department of Electrical and Electronic Engineering, Yonsei University, Seoul, Korea, Republic of, 2Department of Radiotherapy, Division of Imaging and Oncology, UMC Utrecht, Utrecht, Netherlands, 3Computational Imaging Group for MR Diagnostics and Therapy, UMC Utrecht, Utrecht, Netherlands
Synopsis
Keywords: Electromagnetic Tissue Properties, Electromagnetic Tissue Properties, Metric
Motivation: To devise a metric to assess the extent of noise amplification in MR-EPT reconstruction algorithms.
Goal(s): We explore the correlation between the proposed metric and noise amplification for phase-based conductivity reconstructions.
Approach: This study conducted experiments using a concentric cylindrical simulated phantom with uniform electrical properties. Additionally, the proposed metric was applied to in-vivo data.
Results: This metric serves as an indicator of the reliability of the reconstructed conductivity maps. the size of the Laplacian kernel and the chosen weighting method significantly impact the metric.
Impact: This work reveals that the power of a designed MR-EPT reconstruction kernel acts as a noise error propagation factor in the MR-EPT conductivity reconstruction. Consequently, this map can offer insights into the reliability of reconstructed conductivity map.
Introduction
Phase-based MR-EPT (electrical properties tomography) is a non-invasive method to extract tissue conductivity values from measured radiofrequency phase maps1. However, this method is highly susceptible to noise due to the computation of Laplacian operators in the form of finite difference kernels to reconstruct conductivity values2,3,4. To minimize the noise amplification, many studies empirically adjusted the kernel size, shape, and weights (derived from the magnitude image or tissue segmentation)5,6. Currently, the impact of these parameters on conductivity reconstructions is not clear.The aim of this study is to devise a mathematical model that assesses the noise propagation for a given kernel thus providing information about the trustworthiness of the reconstructed conductivity maps.
Theory
Conductivity maps ($$$ \widetilde{\sigma} $$$) are reconstructed from measurements of the radiofrequency transceive phase ($$$\phi^{tr}$$$), which contain both noise ($$$n$$$) and imaging artifacts ($$$\phi_{a}$$$):$$ \widetilde{\sigma}=\triangledown^{2}(\phi^{tr}+n+\phi_{a})=\sigma+c\triangledown^{2}n+c\triangledown^{2}\phi_{a} [1] $$
$$$c=\frac{1}{2\omega \mu_{0}}$$$ with $$$\mu_{0}$$$=vacuum permeability and $$$\omega$$$=Larmor frequency.
Here, we focus on the noise propagation into conductivity reconstructions. Consequently, for accurate conductivity reconstruction, minimizing the $$$\triangledown^{2}n$$$ term would be essential, which can be expressed as:
$$\triangledown^{2}n\propto \langle std(n)\rangle_{L}=std(\sum_ \left(v\in roi\right) n_v F_v ) [2]$$
Where $$$\langle\cdot\rangle_L$$$ is the type of Laplacian kernel used for conductivity reconstructions, while the Laplacian kernel is function of the image resolution ($$$res$$$), the applied weights ($$$w$$$) to each voxel inside the kernel (often derived from tissue magnitude or segmentation), and the kernel size ($$$L_v$$$). $$$v$$$ is a predefined ROI with random noise at any given voxel. Since the noise is voxel-independent, $$$std(\sum_ \left(v\in roi\right) n_v F_v)=\sqrt{\sum_v(std(n_v))^2 F_v^2}$$$ , then eq.2 can be written as:
$$\triangledown^{2}n\propto std(n)\cdot\sqrt{\sum_v (res\cdot L_v w_v)^2} [3]$$
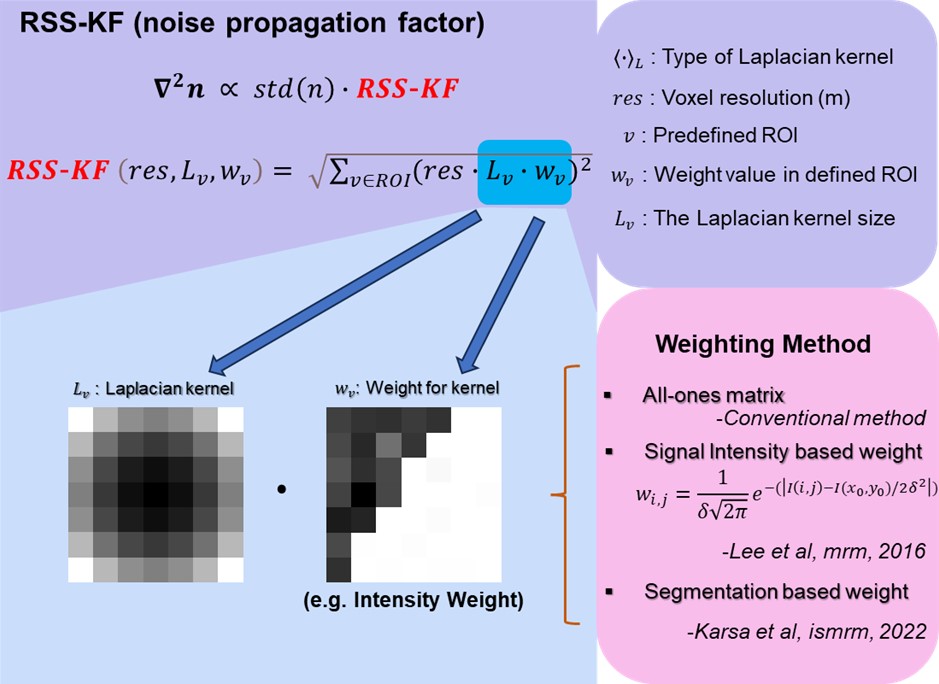
In Eq.3, the term on the right side is indicative of the factors contributing to the noise propagation. In this term, we call RSS-KF (root-sum-of-squares-kernel-factors) the part related to the kernel structure, i.e.$$$ \sqrt{\sum_v (res\cdot L_v w_v)^2}$$$ . A visualization of this is reported in Figure 1.
We therefore assess the noise propagation for a given kernel through the RSS-KF metric.
Method
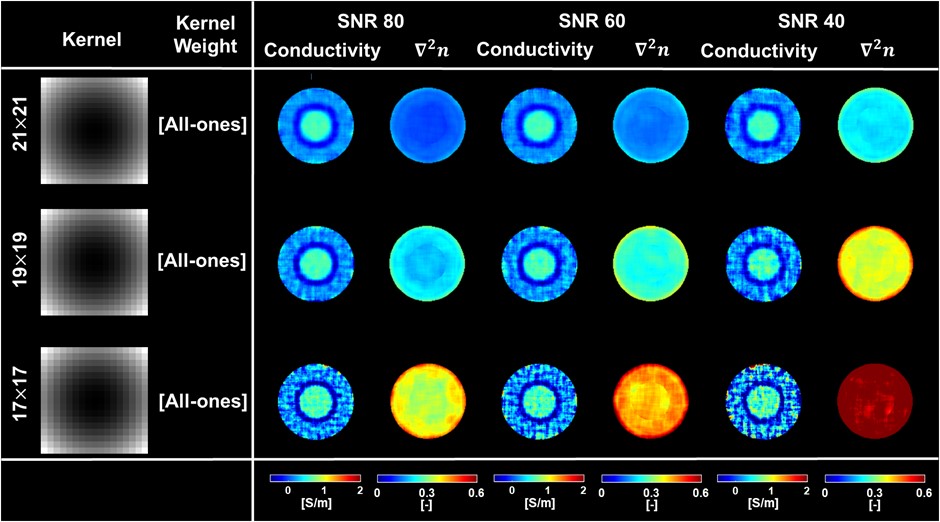
Phantom simulations: A concentric phantom was modelled with inner and outer radii of 25 mm and 50 mm, respectively. The inner and outer regions were set with different conductivity values (0.61 and 0.17 S/m, respectively). The antenna elements of a transmit coil (128MHz) were modelled as ideal line sources, which generate 2D complex $$$B_1^+$$$maps following the Bessel boundary-matching method7. Gaussian noise was added leading to SNR levels of 40, 60 and 80.For varying SNR levels and kernel sizes, the RSS-KF was then calculated to compare the noise propagation for each combination of SNR level and kernel size.
In-vivo measurements: A 2D TSE sequence was acquired one healthy volunteer using a 3 T MRI scanner (MAGNETOM Vida, Siemens Healthineers) with a 16-channel head coil: TR/TE=4500/77ms, image resolution=0.5×0.5 mm2, slice thickness=3mm. The acquired phase was used for conductivity reconstructions as of eq.1 and to compute the RSS-KF map.
Results and discussion
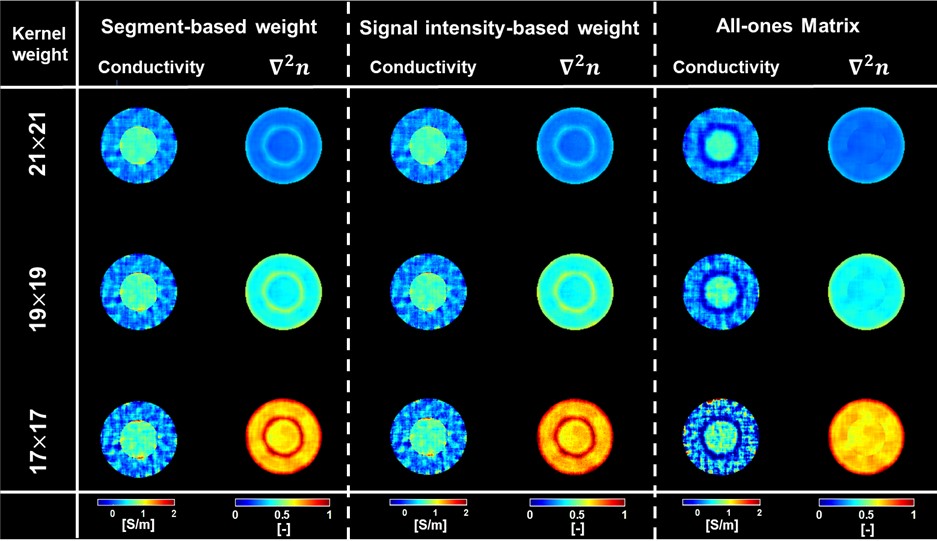
Figure 2 displays the proposed RSS-KF metric for different SNR levels and kernel sizes but same kernel weights. As the kernel size increases, the RSS-KF decreases. Hence, for data with low SNR, large kernel size can help minimizing the noise propagation at the cost of larger errors at boundaries.Figure 3 presents the impact of using different kernel weights on the RSS-KF. Segmentation or signal intensity-based weighting act to exclude areas of different tissues from the one of the voxels to be reconstructed, which is equivalent to reduce the kernel size in boundary areas. While this approach helps decreasing boundary errors, it concurrently poses a higher risk of increased noise propagation.
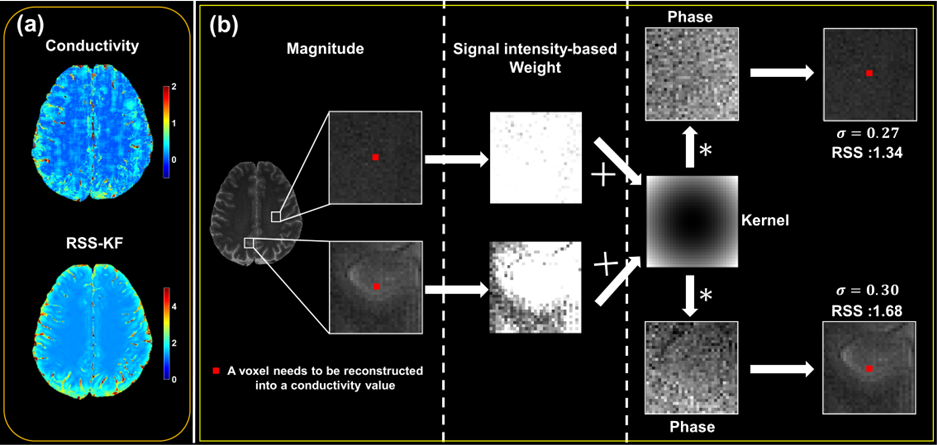
Figure 4 illustrates the application of the proposed metric to in-vivo data, utilizing a signal intensity-based weighting method as example. In Figure 4(b), two different signal intensity-based weights applied to the same kernel are shown, reflecting the impact of different tissue structures inside the patch(without and with boundaries). The conductivity value of the center voxel is then reconstructed together with the corresponding RSS-KF value which is higher for the patch contain different tissues.
This can be therefore used as a voxel-based surrogate of the confidence for in-vivo conductivity reconstructions. As shown in the overall RSS-KF map, regions such as CSF display a lower confidence level due to the impact of boundaries.
Conclusion
We introduced a metric that quantifies voxel-wise the impact of noise propagation in phase-based conductivity reconstruction. This may be used as a surrogate for confidence level, which is crucial for in vivo reconstructions where knowledge of ground truth conductivity is not available. Future studies will focus on the inclusion of boundary errors into such confidence metric for conductivity reconstructions.Acknowledgements
(1). This work received funding from the Netherlands Organization for Scientific Research (NWO; VENI grant no. 18078).
(2). This work has been supported by Y-BASE R&E Institute, a Brain Korea 21 four program, Yonsei University.
References
[1] Kim, J. H., Kim, S. Y., Cui, C., Ji, H., Yoen, H., Cho, N., & Kim, D. H. (2023). Problem Solving MRI to Reduce False‐Positive Biopsy Related to Breast US: Conductivity vs. DWI vs. Abbreviated Contrast‐Enhanced MRI. Journal of Magnetic Resonance Imaging.
[2] S.-K. Lee, S. Bulumulla, and I. Hancu, "Theoretical investigation of random noise-limited signal-to-noise ratio in MR-based electrical properties tomography," IEEE transactions on medical imaging, vol. 34, no. 11, pp. 2220-2232, 2015.
[3] Mandija, S., Sbrizzi, A., Katscher, U., Luijten, P. R., & van den Berg, C. A. (2018). Error analysis of helmholtz‐based MR‐electrical properties tomography. Magnetic resonance in medicine, 80(1), 90-100.
[4] J. Shin, J. Lee, M.-O. Kim, N. Choi, J. K. Seo, and D.-H. Kim, "Quantitative conductivity estimation error due to statistical noise in complex B1+ map," Journal of the Korean Society of Magnetic Resonance in Medicine, vol. 18, no. 4, pp. 303-313, 2014.
[5] Karsa, A., & Shmueli, K. New Approaches for Simultaneous Noise Suppression and Edge Preservation to Achieve Accurate Quantitative Conductivity Mapping in Noisy Images. ISMRM 29th Annual Meeting, 15-20 May 2021.
[6] J. Lee, J. Shin, and D. H. Kim, "MR‐based conductivity imaging using multiple receiver coils," Magnetic resonance in medicine, vol. 76, no. 2, pp. 530-539, 2016.
[7] B. van den Bergen, C. C. Stolk, J. B. van den Berg, J. J. Lagendijk, and C. A. Van den Berg, "Ultra fast electromagnetic field computations for RF multi-transmit techniques in high field MRI," Physics in Medicine & Biology, vol. 54, no. 5, p. 1253, 2009.
Figures