3671
Fatty acid characterization of vertebral body marrow using MR Z-spectral imaging at 3 T1Paul C. Lauterbur Research Center for Biomedical Imaging, Shenzhen Institute of Advanced Technology, Chinese Academy of Sciences, Shenzhen, China, 2Department of Medical Imaging, Peking University Shenzhen Hospital, Shenzhen, China
Synopsis
Keywords: Fat & Fat/Water Separation, Contrast Mechanisms
Motivation: MR Z-spectral imaging (ZSI) offers a new way to generate fat spectrum. However, its feasibility for fatty acid characterization remains to be elucidated.
Goal(s): This study designed a ZSI protocol and investigated its capability in fat measurement.
Approach: The designed ZSI protocol was tested on a fat-water phantom and vertebral body marrows in healthy volunteers and osteoporosis patients at 3 T.
Results: ZSI-measured fat fraction (FF) significantly correlated with oil volumes in the phantom. Moreover, osteoporosis patients exhibited significantly higher normalized fat peak amplitudes and FF than healthy volunteers, indicating the ability of ZSI in revealing fatty acid differences under different pathological states.
Impact: The designed ZSI protocol was feasible for fatty acid characterization. Significant differences of fatty acid metrics were detected between osteoporosis patients and healthy volunteers, suggesting the potentials of the designed ZSI protocol in facilitating fat-related disease diagnosis and evaluation.
Introduction
Bone marrow fat is involved in many bone-related and non-osseous diseases [1, 2]. MR spectroscopy and chemical shift encoding-based water-fat MRI have been intensively employed to monitor bone marrow alterations in pathological states [3]. However, these techniques either suffer from relatively low spatiotemporal resolution and complicated postprocessing strategies [4] or are prone to errors from phase wrapping, field inhomogeneity, T2* bias, etc. [5, 6]. Recently, a Z-spectrum imaging (ZSI) technique was proposed, which applies RF irradiation pulses sweeping over a range of frequencies to directly saturate signals at their resonance frequencies [7, 8]. The method is insensitive to phase artifacts and field inhomogeneity, offering a novel way for fat fraction (FF) quantification and brown adipose tissue detection [7, 8]. However, only the intense fat peak from bulk methylene protons was accounted for fat measurement with other fat signals usually ignored, making the feasibility of ZSI for fatty acid characterization remains unclear.Materials and methods
MRI study: An agar-based fat-water phantom consisting of six 20-mL vials with oil volumes of 0, 5%, 10%, 20%, 30%, and 40% was constructed. The local Institutional Review Board approved the human study. Fourteen healthy volunteers and twelve osteoporosis patients with T-score<-2.5 were prospectively enrolled. Written informed consents were obtained from all participants. MRI scans were conducted on a 3 T scanner (uMR790, Shanghai UIH, China). ZSI images were acquired using a single-shot FSE on a single slice (TR/saturation time/TE=1600 ms/100 ms/39 ms, B1=0.25 μT, frequency offsets from -5 to 2 ppm with intervals of 0.05 ppm), including an unsaturated scan. Parameters for phantom experiments included: matrix size=96×96, in-plane resolution=1.6×1.6 mm2, slice thickness=10 mm, and NEX=1. For the human study, ZSI data was acquired on a transverse slice at the L4 vertebral body (spatial resolution=2.4×2.4×8 mm3, FOV=270-325 × 194-230 mm2 adjusted according to the body size of participants, and NEX=1). The imaging time was 3.8 minutes.Data analysis: The acquired saturated scans (S) were normalized by the control scan without RF saturation (S0) as Z=S/S0, interpolated by smoothing splines, and corrected B0 field inhomogeneity by shifting the water peak to 0 ppm. Multiple Gaussian-Lorentzian sum functions were employed to resolve water and four fat signals with frequency offsets at -3.8, -3.4, -2.7, and -1.9 ppm [9]. The fitting goodness of R2 and fitting residue were measured to evaluate the fitting performance. Amplitudes of fat peaks were normalized to that of the water peak. FF=Afat/(Afat+Awater), where Awater and Afat are peak amplitudes of water and total fat signals, respectively. Normalized fat peak amplitudes and FF were measured in the L4 vertebral body and averaged across all subjects in each group.
Results
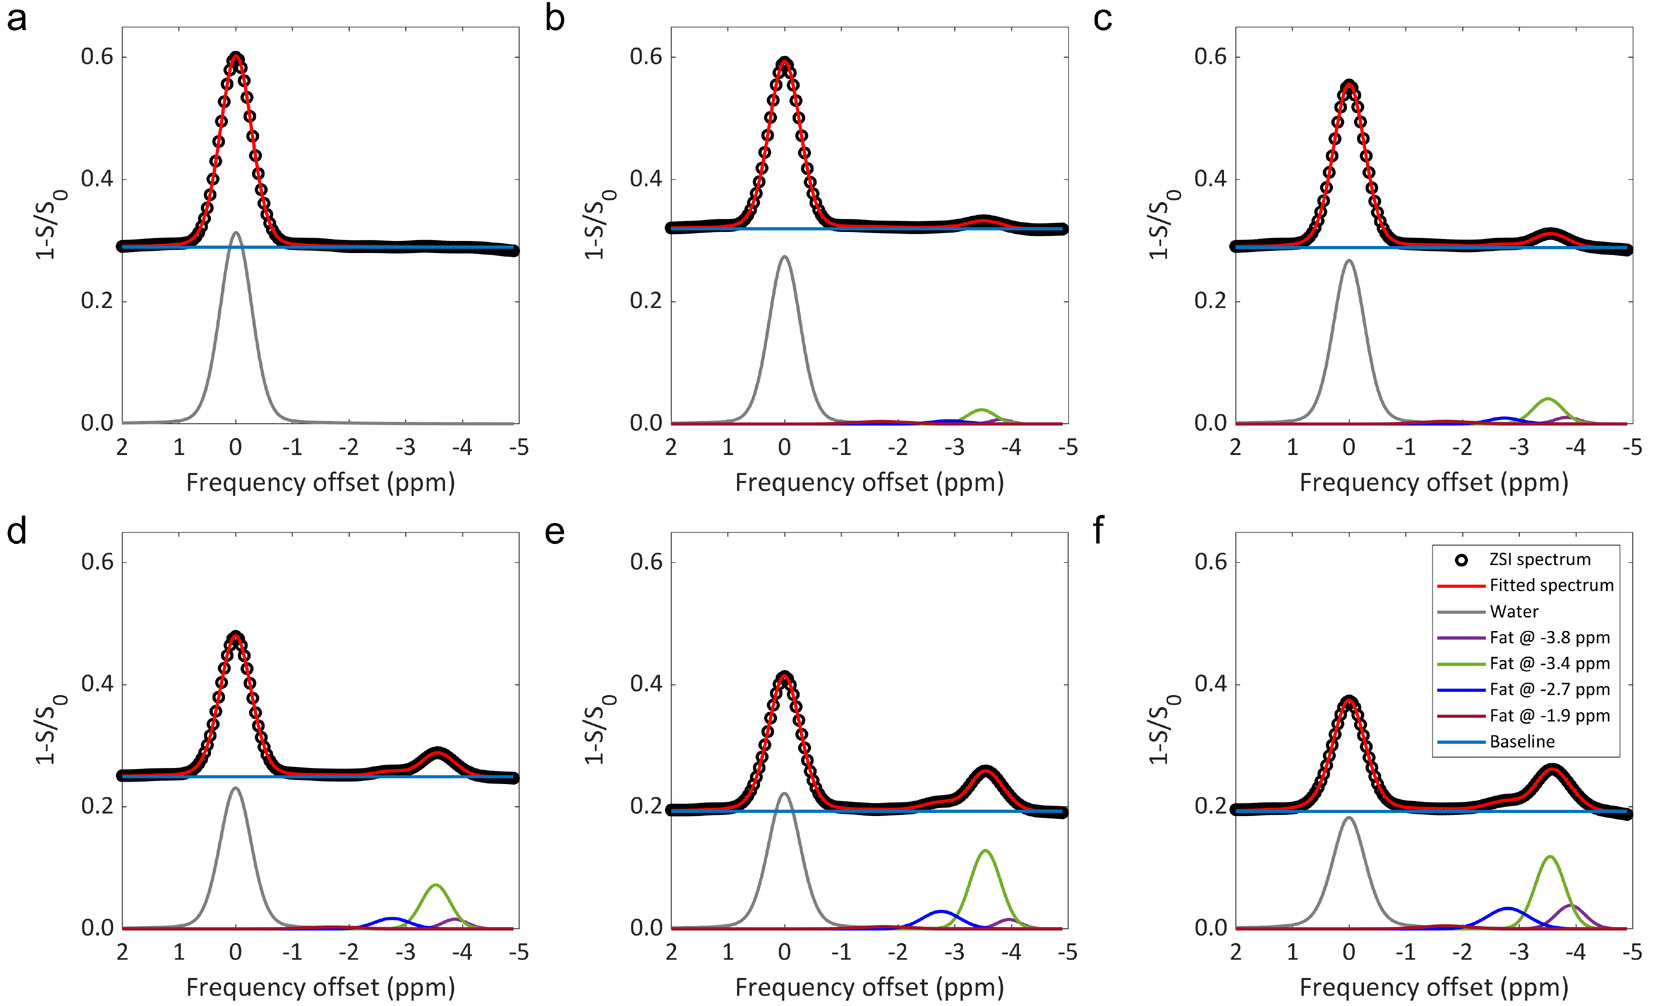
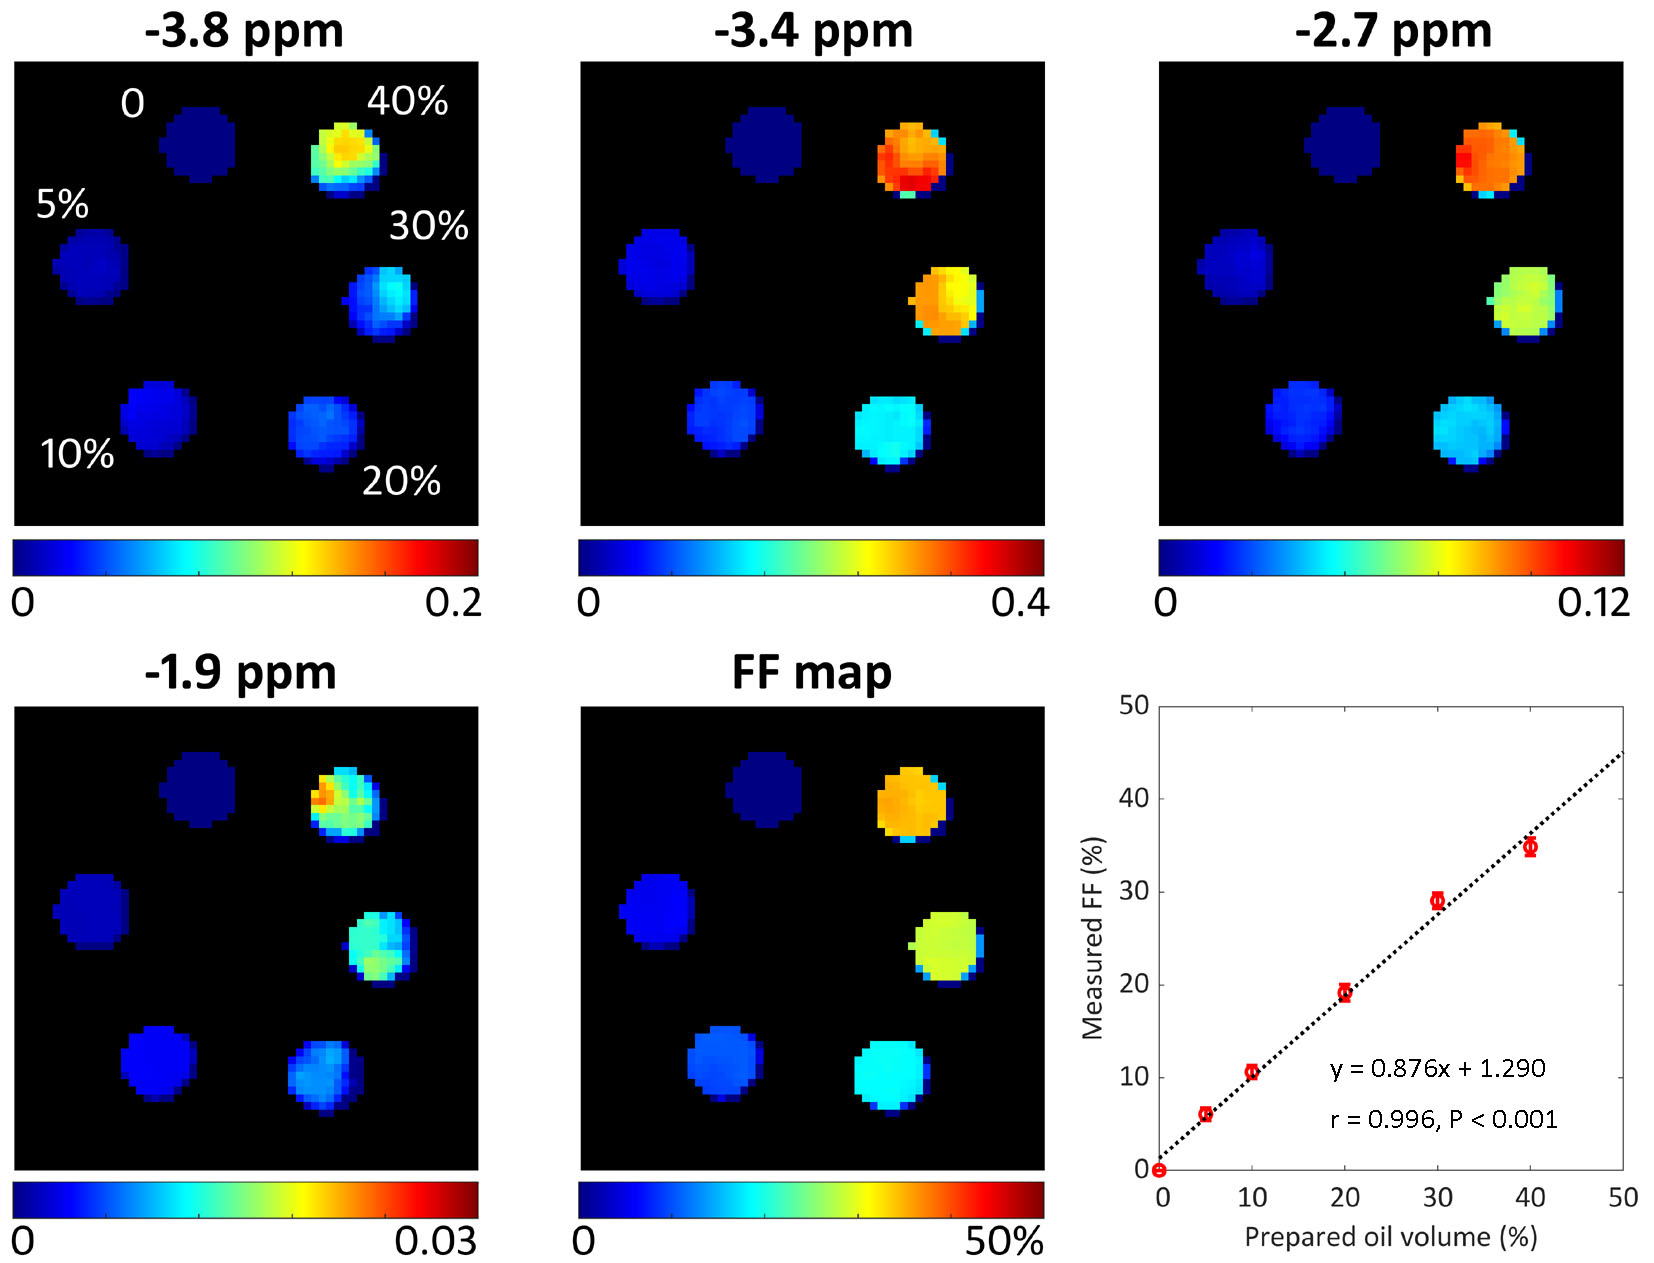
Figure 1 shows the Z spectra of the six fat-water vials with different oil volumes. Z spectra were well fitted with an average fitting goodness of R2>0.99 and residues<0.1%. The water peak amplitude decreased, and fat peak amplitudes increased with oil volumes.Figure 2 displays maps of normalized fat peak amplitudes at frequency offsets of -3.8, -3.4, -2.7, and -1.9 ppm, respectively. The normalized fat peak amplitudes increased with oil volumes. Moreover, FF measured with the ZSI method significantly correlated with prepared oil volumes (r=0.996, P<0.001).
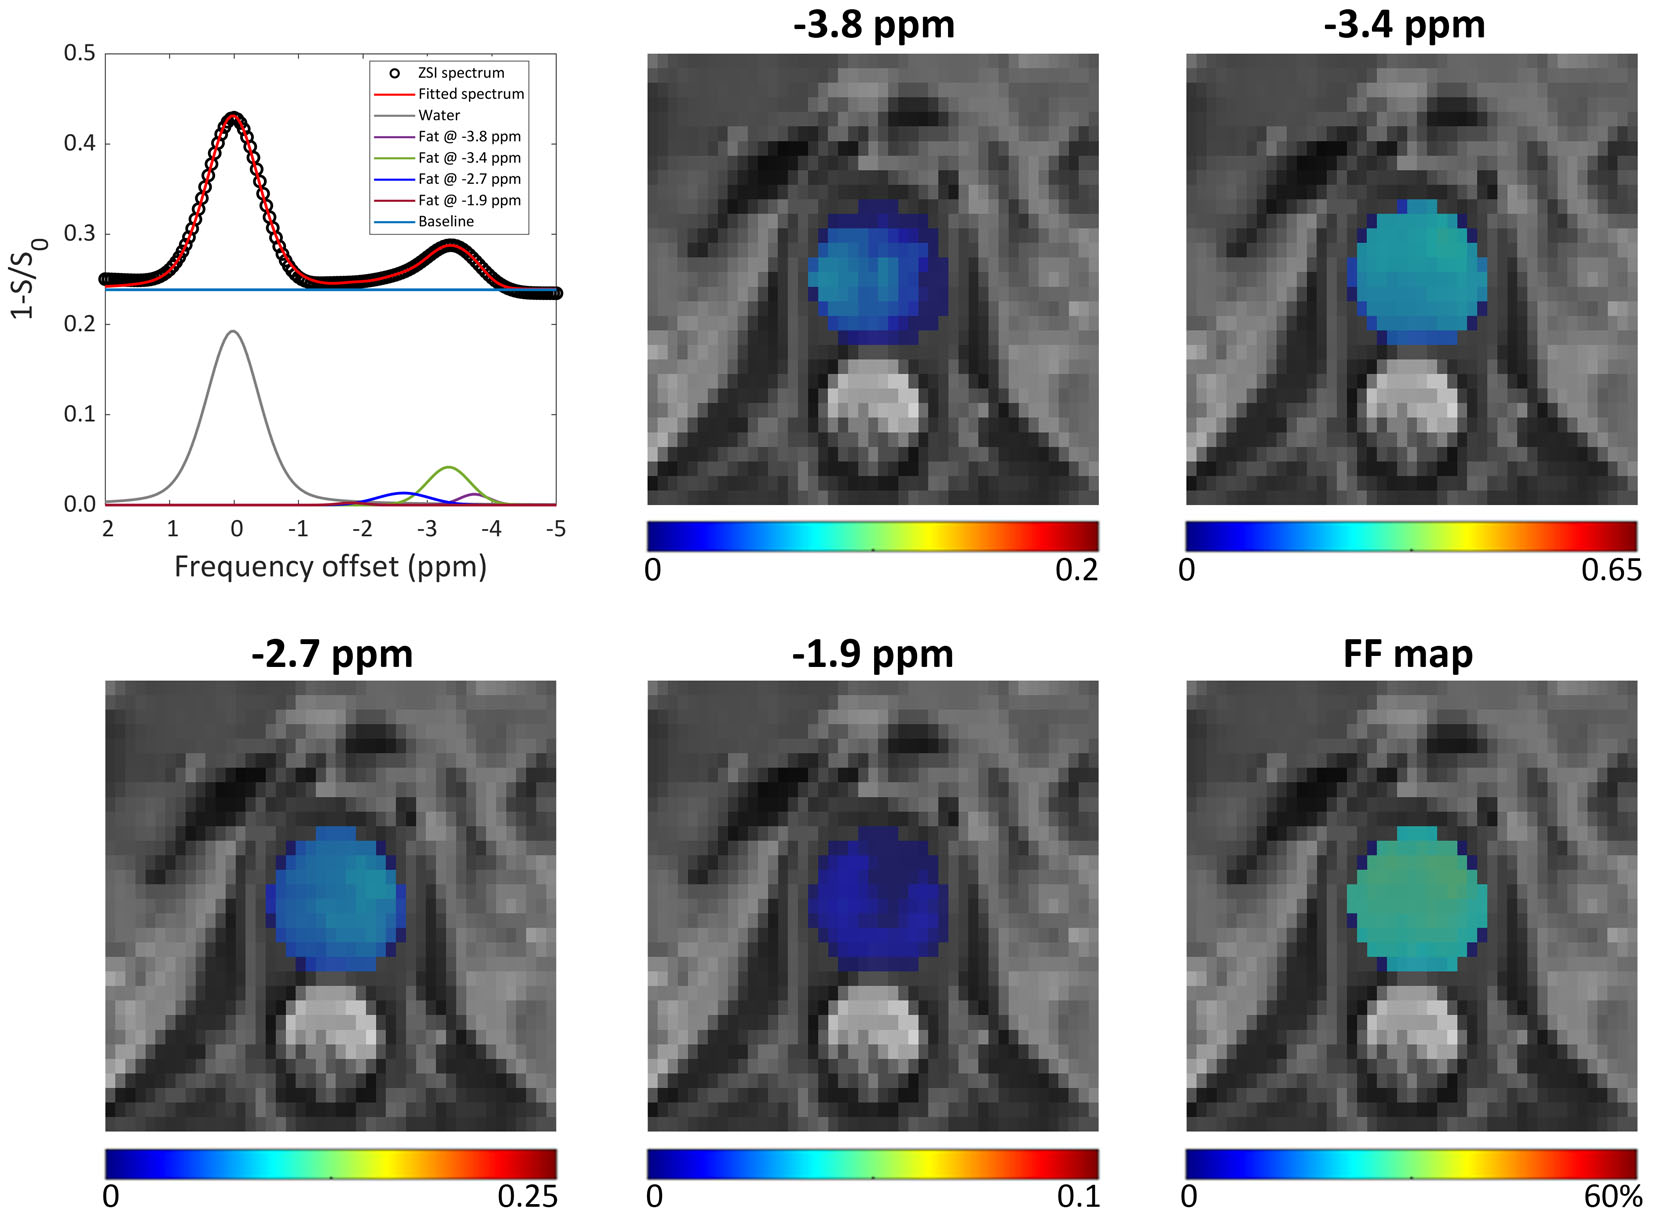
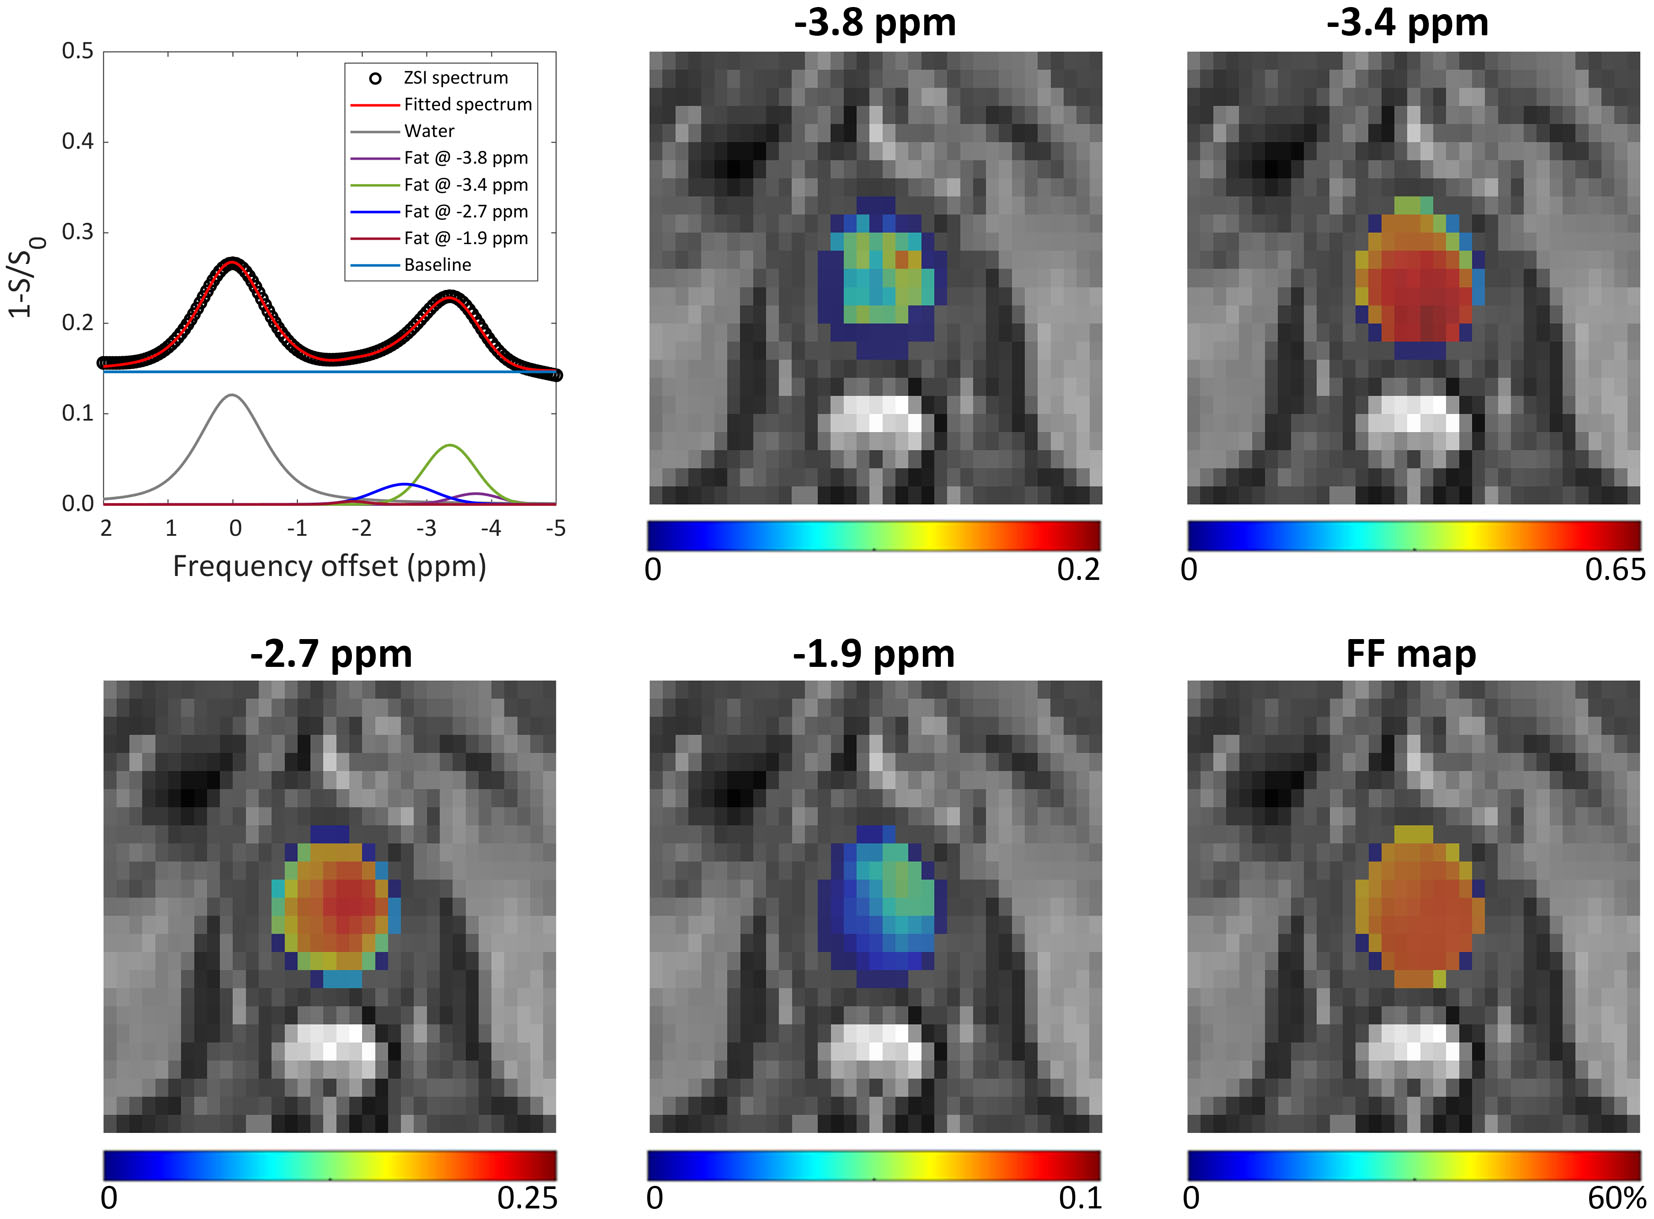
Figures 3 and 4 show multiparametric images from a representative healthy volunteer and an osteoporosis patient, including Z spectra of L4 vertebral body marrows with resolved water and fat signals and respective normalized fat peak amplitude maps. Compared to the healthy volunteer, the osteoporosis patient exhibited conspicuously elevated fat signals and reduced water signals in vertebral body marrows, resulting in noticeable hyperintense in the normalized fat peak amplitude and FF maps.
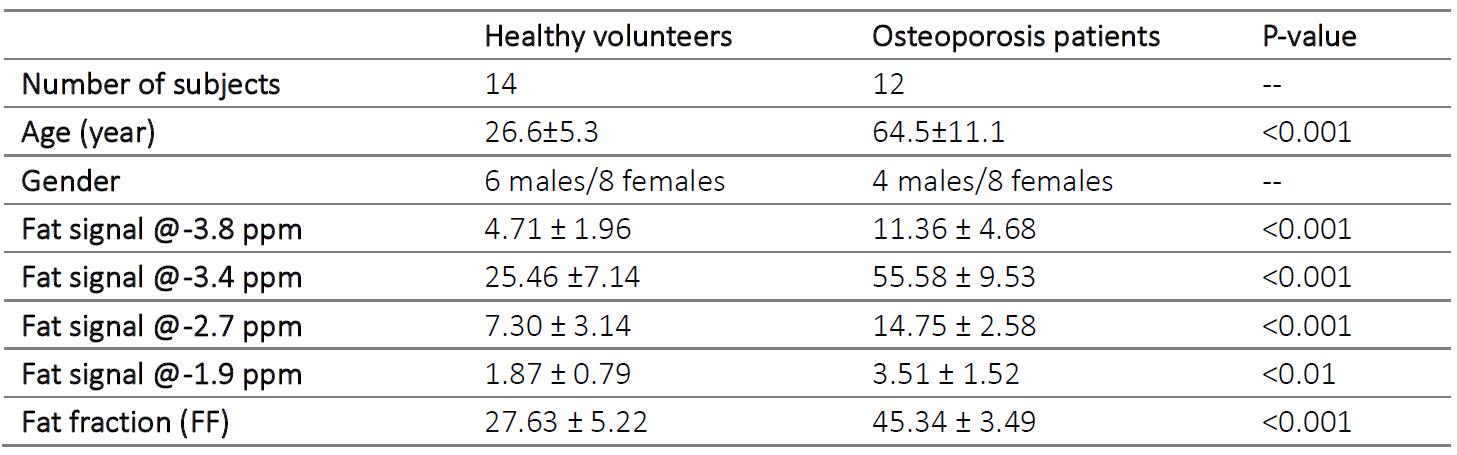
Table 1 summarizes the demographic information of the participants and quantitatively compares fatty acid metrics, including the normalized fat peak amplitudes and FF, between the healthy volunteers and the osteoporosis patients. The osteoporosis patients exhibited significantly higher normalized fat peak amplitudes and FF compared to the healthy volunteers (all P<0.01).
Discussion and Conclusion
This study designed a ZSI protocol and demonstrated its feasibility in fatty acid characterization in both fat-water phantom and human experiments. The developed ZSI technique revealed significantly higher normalized fat peak amplitudes and FF in vertebral bone marrows of osteoporosis patients than that of healthy volunteers, likely due to a shift of differentiation of mesenchymal stem cells to adipocytes [10]. To our best knowledge, this was the first study to report differences in four main fat components in vertebral body marrows between healthy volunteers and osteoporosis patients. The ZSI technique is promising to facilitate the diagnosis and evaluation of fat-altered diseases by providing complementary information.Acknowledgements
National Natural Science Foundation of China (92259203 and 82271976), and the Outstanding Scientific and Technological Innovation Talent Training Program of Shenzhen (RCJC20221008092809018).References
- Vande Berg BC, Gilon R, Malghem J, Lecouvet F, Depresseux G, Houssiau FA. Correlation between baseline femoral neck marrow status and the development of femoral head osteonecrosis in corticosteroid-treated patients: a longitudinal study by MR imaging. Eur J Radiol 2006;58(3):444-449.
- Bredella MA, Gill CM, Gerweck AV, et al. Ectopic and serum lipid levels are positively associated with bone marrow fat in obesity. Radiology 2013;269(2):534-541.
- Karampinos DC, Ruschke S, Dieckmeyer M, et al. Quantitative MRI and spectroscopy of bone marrow. J Magn Reson Imaging 2018;47(2):332-353.
- Hu HH, Kan HE. Quantitative proton MR techniques for measuring fat. NMR Biomed 2013;26(12):1609-1629.
- Hu HH, Hines CD, Smith DL, Jr., Reeder SB. Variations in T(2)* and fat content of murine brown and white adipose tissues by chemical-shift MRI. Magn Reson Imaging 2012;30(3):323-329.
- Ladefoged CN, Hansen AE, Keller SH, et al. Impact of incorrect tissue classification in Dixon-based MR-AC: fat-water tissue inversion. EJNMMI physics 2014;1(1):101.
- Scotti A, Tain RW, Li W, Gil V, Liew CW, Cai K. Mapping brown adipose tissue based on fat water fraction provided by Z-spectral imaging. J Magn Reson Imaging 2018;47(6):1527-1533.
- Li L, Scotti A, Fang J, et al. Characterization of brown adipose tissue (BAT) in polycystic ovary syndrome (PCOS) patients by Z-Spectral Imaging (ZSI). Eur J Radiol 2020;123:108777.
- Marshall I, Higinbotham J, Bruce S, Freise A. Use of Voigt lineshape for quantification of in vivo 1H spectra. Magn Reson Med 1997;37(5):651-657.
- Zhao LJ, Jiang H, Papasian CJ, et al. Correlation of obesity and osteoporosis: effect of fat mass on the determination of osteoporosis. J Bone Miner Res 2008;23(1):17-29.
Figures