3670
Quantitative water content mapping in situ by in situ MRI: a promising forensic tool for post-mortem edema characterization1INM-4, Research Centre Juelich, Juelich, Germany, 2Institute of Forensic Medicine, Department of Biomedical Engineering, University of Basel, Basel, Switzerland, 3Institute of Forensic Medicine, Health Department Basel-Stadt, Basel, Switzerland, 4Institute of Forensic Medicine, Department of Biomedical Engineering, Health Department Basel-Stadt, Basel, Switzerland, 5RWTH Aachen University, Aachen, Germany, 6INM-11, JARA, Research Centre Juelich, Juelich, Germany, 7JARA - BRAIN - Translational Medicine, Aachen, Germany
Synopsis
Keywords: Multi-Contrast, Ex-Vivo Applications, Ischemia, Microstructure, Relaxometry, Screening, Tissue Characterisation, Traumatic Brain Injury
Motivation: Detection of brain edema at forensic examination remains subjective and observer dependent, but more objective criteria perform poorly. A notable exception is the normalized brain weight.
Goal(s): Investigate MRI measures of death-associated edema.
Approach: We establish in situ water content mapping and T2* relaxometry in a pilot study, adapting a fast quantitative protocol (~6min) using a standard mGRE sequence.
Results: Using the derived quantitative maps, we find correlations between water content and T2* in WM, between tissue water weight and brain weight, and macromolecular density vs normalized brain weight. Microstructural characterization of brain oedema with qMRI seems feasible.
Impact: Assessing the presence of edema as indicative of the cause of death is important for forensic examinations but is currently observer dependent. We seek to establish objective qMRI-based diagnostic measures and propose microstructural markers such as the macromolecular density.
Introduction
Brain edema is a pathological change in the living central nervous system that occurs frequently and is important for characterization of death resulting from trauma or disease. Characterizing it post mortem at autopsy is rendered difficult by subsequent changes in brain water content, such as edema accompanying global ischemia at death1 and post-mortem fluid redistribution due to tissue decomposition2. Forensic pathologists use macroscopic features showing the presence of pressure signs, e.g. compression of the ventricles, to classify edema preceding or causing death. The method is subjective and observer dependent, but remains the gold standard since correlations with more objective criteria as wet-dry measurements of tissue water content or histology, were shown to be poor3. The best objective measure differentiating edema from nonedema cases was reported to be the normalized cerebral weight3. Imaging modalities (CT and/or MRI) are increasingly used preceding and complementing autopsy. We conducted an exploratory study of edema characterization in situ using water content mapping by MRI and compare it to predictions using the normalized cerebral weight.Materials and Methods
Four cases were included (3 female, mean age 65.5), detailed in Table1. A fast, single-scan based water content and T2* mapping method4 was implemented using a multi-echo GRE sequence5. A combination of long TR (5s) and low flip angle (25o) minimized T1 saturation effects in tissue and T2* fitting of the signal decay provided S0. The combined transmit and receive B1 inhomogeneity, which is a multiplicative factor in this method, was corrected by SPM [http://fil.ion.ucl.ac.uk/spm]. Conversion from signal intensity to water content, expressed as volume % in each voxel, was based on internal calibration using CSF signal (assigned 100% water content).Masks for WM, GM and CSF were produced from SPM tissue class probabilities above 99%. A brain mask was obtained by summing the 3 tissue class probabilities; a brain tissue mask excluded voxels with probability >50% of being CSF.
Results and Discussion
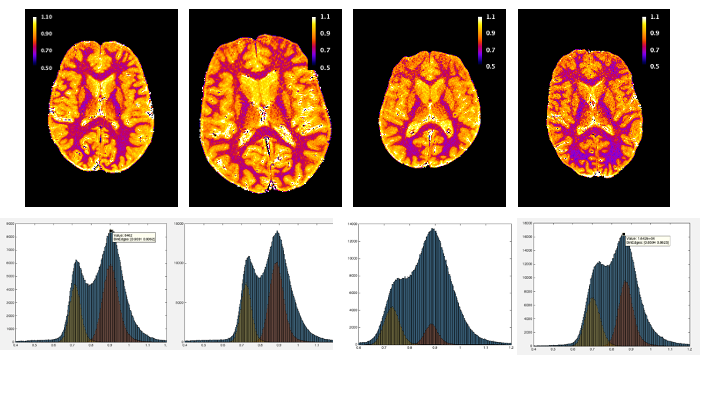
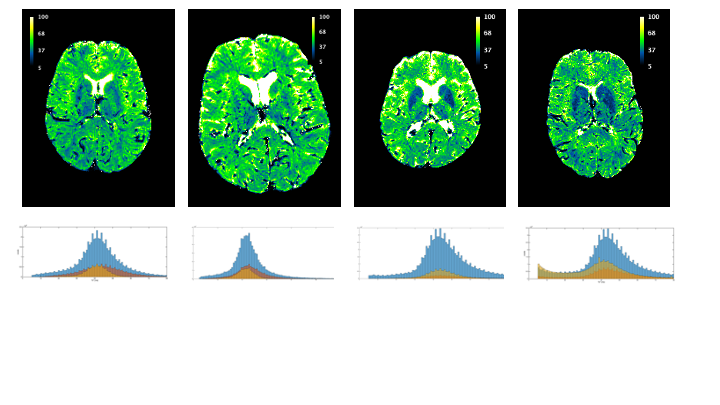
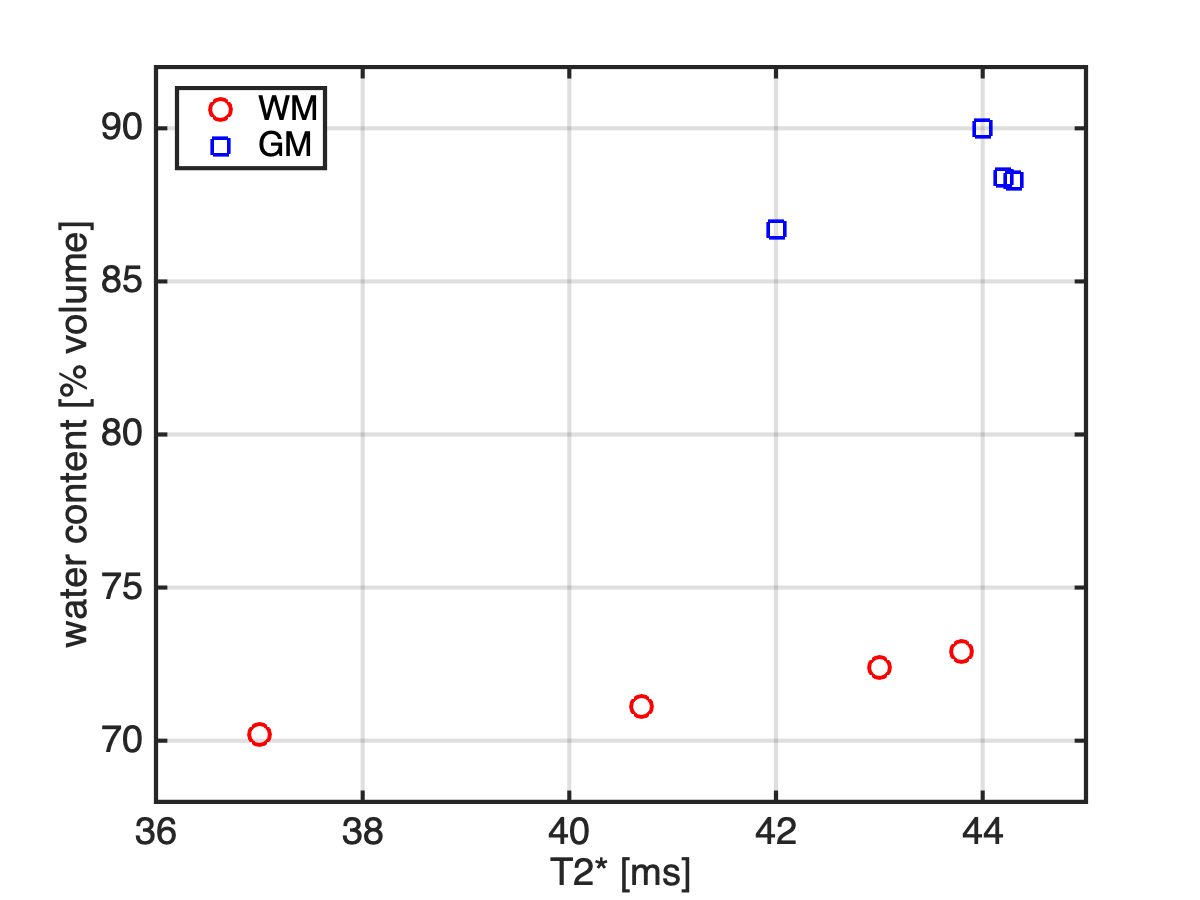
Water content and T2* distributions are visualised in Figs. 1 and 2 and included in Table 1.Water content is known to be highly regulated in the healthy living brain4, but is found to be more variable post mortem. Mean GM water content of 88.3(1.3)% was significantly higher than in vivo (83(1.6)% 4). The WM values were comparable to those found in vivo (70.2%(1.2)4) for cases 1 and 4 (mean 70.7%), and higher for cases 2 and 3 (72.7%). These values are consistent with wet-dry measurements3 and previous findings1. T2* was in all cases shorter than in vivo (~42 ms compared to ~52 ms 4), most likely due to the high concentration of deoxyhemoglobin in blood vessels and temperature effects. Variations in T2* and water content appear uncoupled in GM but related in WM (Fig.3). A good correlation between the two parameters is only found in vivo in the presence of edema 4, but not in healthy tissue. Only one of the two cases (#2 and #3) showing elevated WM water content and T2* was declared edematous by the forensic pathologists (#2); the other (#3) might show advanced signs of decomposition due to delayed beginning of cooling after death. The details of the water content distribution are markedly different in the two cases (Fig.1, Table1).
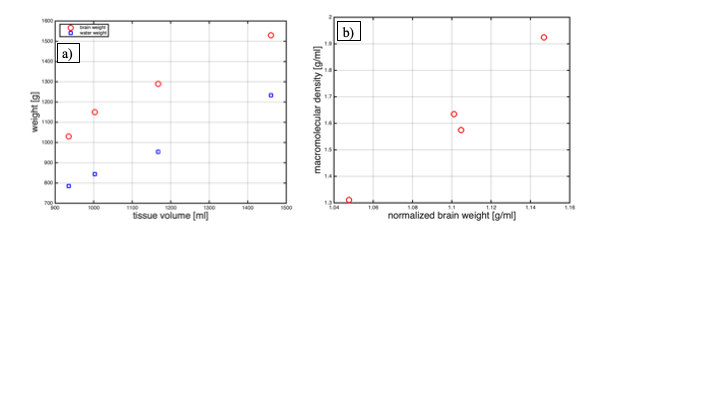
Both tissue water weight and brain weight seem correlated with tissue volume (Fig.4a) and might reflect edema3. The edematous brain (case #2) has the lowest normalized cerebral weight, equivalent to lowest mean tissue density. Interestingly, the macromolecular density (the normalized complement of tissue water) is also lowest for this case (Fig.4b). The macromolecular density could be an objective measure of the presence of edema, since in causes of death that directly affect the brain, the postmortem cell death pathway may be much different than the non-regulated form of cell death6.
On the methodical side, T1 saturation effects both in tissue and CSF will depend on temperature7,8, but remain negligible for the parameters and range of temperatures used here. A tacit assumption of the calibration is that water density as well as its temperature dependence is the same for water in tissue and CSF. Use of an external standard with monitored temperature might be better suited for water content calibration in situ than CSF, which might show post mortem interval (PMI) -dependent solute concentration9,10, and should be explored in the future.
Conclusions
In situ water content mapping by MRI looks promising, but more cases are needed for reliable conclusions. The simplicity of the method and short measurement time could facilitate the inclusion of this measurement whenever post mortem MRI is performed.Acknowledgements
No acknowledgement found.References
[1] A.J. Yates, W. Thelmo, H.M. Pappius. Postmortem changes in the chemistry and histology of normal and edematous brains. Am. J. Pathol., 79 (3) (1975), pp. 555-564
[2] M. Oehmichen. Brain death: neuropathological findings and forensic implications Forensic Sci. Int., 69 (3) (1994), pp. 205-219
[3] M. Bauer, N. Deigendesch, H. Wittig, E. Scheurer, C. Lenz. Tissue sample analysis for post mortem determination of brain edema. Forensic Science International 323 (2021)110808. https://doi.org/10.1016/j.forsciint.2021.110808.
[4] A.M. Oros-Peusquens, R. Loução, Z. Abbas, V. Gras, M. Zimmermann, N.J. Shah. A Single-Scan, Rapid Whole-Brain Protocol for Quantitative Water Content Mapping With Neurobiological Implications. Frontiers in Neurology 10 (2019). DOI:10.3389/fneur.2019.01333
[5] Oros-Peusquens, A. M., Loução, R., Zimmermann, M., Langen, K. J., & Shah, N. J. (2017). Methods for molecular imaging of brain tumours in a hybrid MR-PET context: Water content, T2∗, diffusion indices and FET-PET. Methods, 130, 135-151.
[6] M. Krassner et al. Postmortem changes in brain cell structure: a review. Free Neuropathol. 2023 doi: 10.17879/freeneuropathology-2023-4790
[7] C. Birkl et al. Temperature dependency of T1 relaxation time in unfixed and fixed human brain tissue Biomed Tech 2013; 58. DOI 10.1515/bmt-2013-4290
[8] Berger, C., Bauer, M., Wittig, H. et al. Post mortem brain temperature and its influence on quantitative MRI of the brain. Magn Reson Mater Phy 35, 375–387 (2022).
[9] Hasegawa, I., Shimizu, A., Saito, A. et al. Evaluation of post-mortem lateral cerebral ventricle changes using sequential scans during post-mortem computed tomography. Int J Legal Med 130, 1323–1328 (2016). https://doi.org/10.1007/s00414-016-1327-2
[10] De-Giorgio, F., Ciasca, G., Fecondo, G. et al. Estimation of the time of death by measuring the variation of lateral cerebral ventricle volume and cerebrospinal fluid radiodensity using postmortem computed tomography. Int J Legal Med 135, 2615–2623 (2021). https://doi.org/10.1007/s00414-021-02698-6
Figures
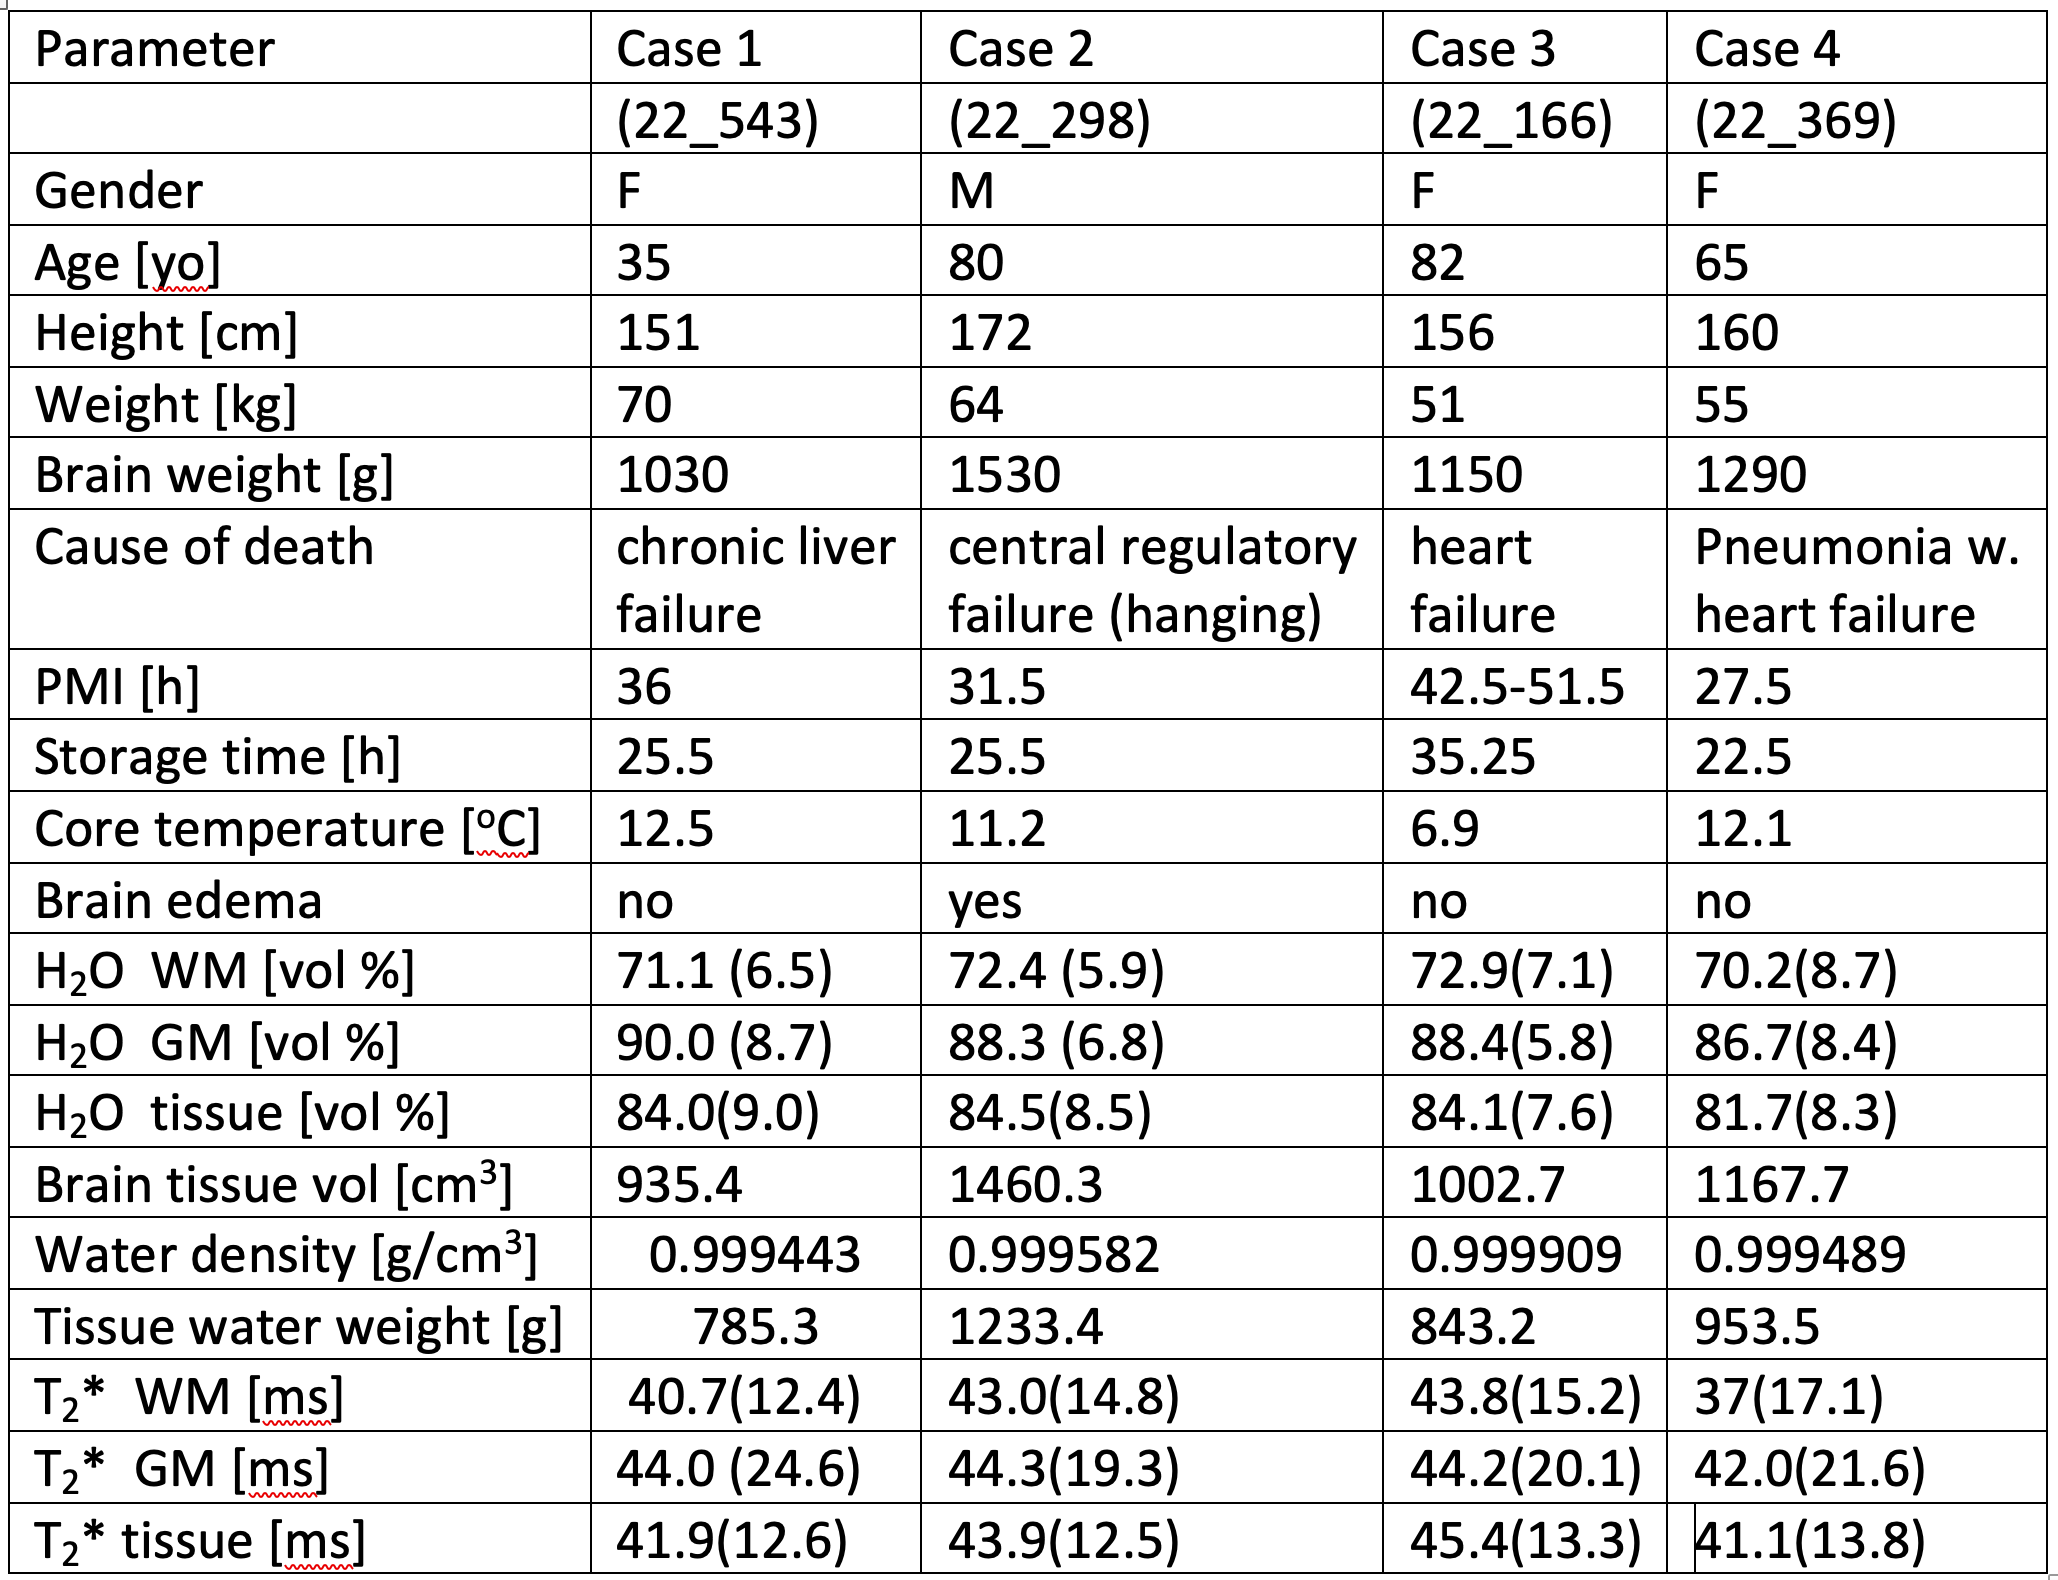
Table 1. Demographics and qMRI values of the 4 cases investigated. MR scanning was performed on a Siemens 3T PRISMA using body coil transmit and a 32 channel receiver coil array. The scanning parameters included: TR=5s , flip=25o, TE1=3.47ms, ΔTE=3.68ms, 84 slices, 1.5mm thick, in-plane resolution 1x1mm2, TA=6min:20s. For cases 3 and 4 an additional acquisition with TR=10s and flip=25o was included and demonstrated unchanged signal intensity and thus negligible T1 saturation effects. Note the long post mortem interval (PMI) of case 3.