3669
Spectrally-selective and Interleaved Water Imaging and Fat Imaging (siWIFI) for Model-free Fat Quantification1Department of Radiology, University of California, San Diego, La Jolla, CA, United States, 2Research Service, VA San Diego Healthcare System, La Jolla, CA, United States, 3GE HealthCare, San Diego, CA, United States, 4Radiology Service, VA San Diego Healthcare System, La Jolla, CA, United States, 5Department of Bioengineering, University of California, San Diego, La Jolla, CA, United States
Synopsis
Keywords: Fat & Fat/Water Separation, Fat
Motivation: Reliable water-fat separation and quantification are of critical importance in the MRI assessment of diseases involving metabolic disruption and fat infiltration.
Goal(s): To develop a model-free approach for spectrally selective and interleaved water imaging and fat Imaging (siWIFI).
Approach: We designed a new sequence that selectively acquires water and fat signals in an interleaved fashion. This new sequence was tested on phantoms and healthy subjects.
Results: The measured fat fraction showed excellent correlation with fat concentrations of phantoms. Both phantom and healthy subject images were comparable to those from standard IDEAL scans.
Impact: Our new method, termed siWIFI, selectively images water and fat for water-fat quantification which does not require complicated post-processing. Combining with MT preparation shows the feasibility of simultaneous quantification of fat infiltration and fibrosis development.
Introduction
Reliable water-fat separation and quantification are of critical importance in the MRI assessment of diseases involving metabolic disruption and fat infiltration1. Fat is a major source of artifacts that compromises both morphological contrast and quantitative measurement of MR parameters. Thus, fat suppression or selective water-fat imaging is crucial for accurate clinical diagnosis. Various approaches have been developed to suppress or separate fat signals from MR images, such as the chemical shift selective fat saturation, Dixon methods and iterative decomposition of water and fat with echo asymmetry and least-squares estimation (IDEAL)2,3. However, these methods are only used for water imaging or require model-based post-processing that may suffer fat-water swap issues4. Here, we introduce a new sequence that separately images water and fat via spectrally-selective and interleaved water imaging and fat imaging (siWIFI). The sequence provides fat and water quantification and circumvents the problems arising with other techniques.Methods
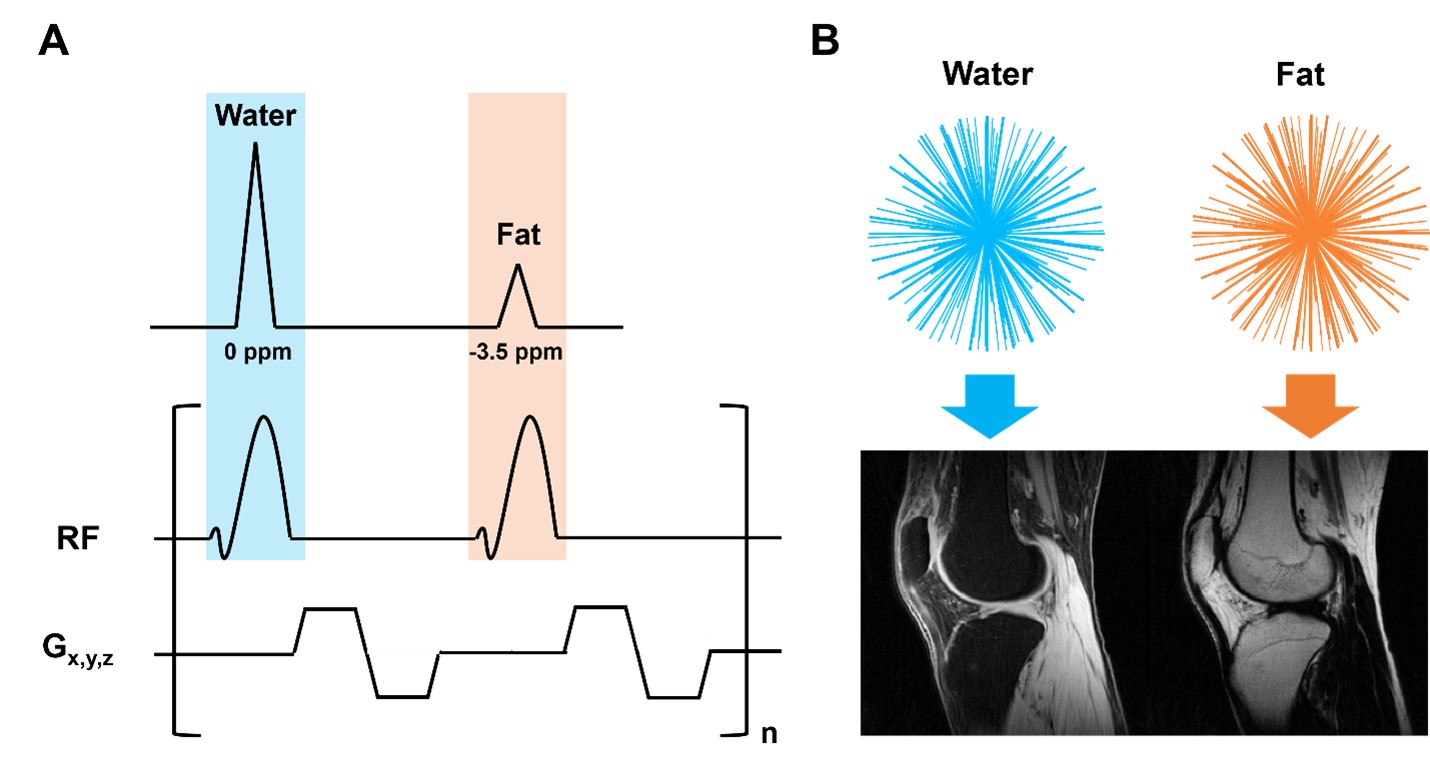
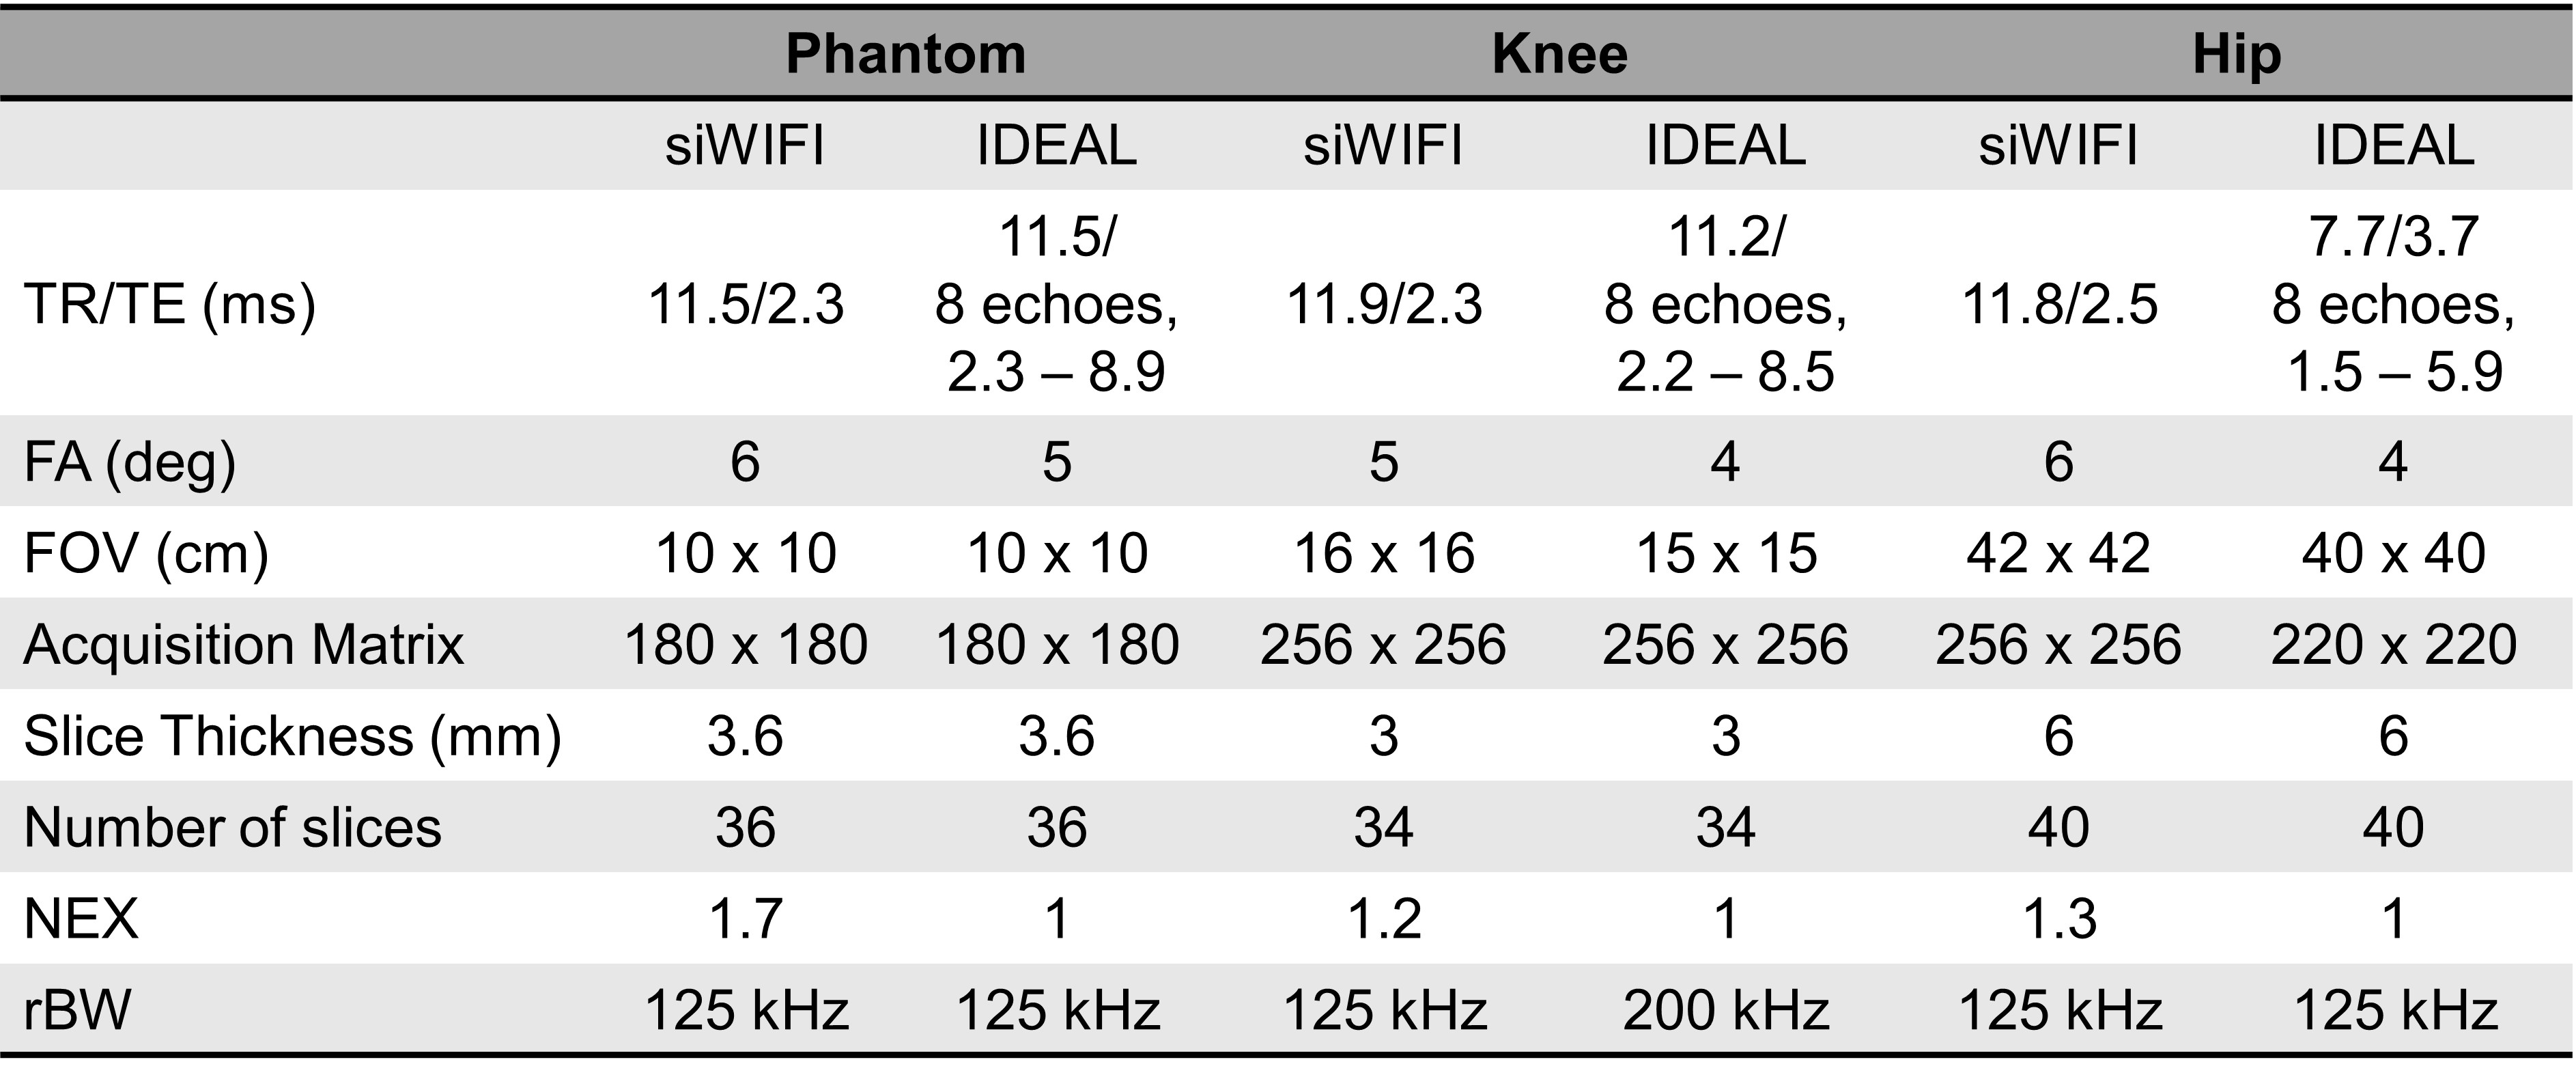
Figure 1 shows the key features of the siWIFI sequence. A narrow band soft pulse (pulse duration = 6.6 ms, bandwidth = 333 Hz) is used for spectrally selective imaging of water and fat. The carrier frequency of this excitation pulse is toggled between water (0 ppm) and fat frequency (-3.5 ppm) for every k-space line acquisition. k-space spokes are acquired in an interleaved fashion and are regrouped for reconstruction to provide separate water and fat images. Consequently, water and fat images are inherently co-registered. A 3D center-out radial readout scheme is employed for data acquisition. The siWIFI sequence was implemented on a 3T scanner (MR750, GE Healthcare), and phantoms with different concentrations (0, 6, 10, 20, 30, 40, 50%) of microlipids (Microlipid, Nestle Health Science) were scanned using an 8-channel knee coil. In vivo knee and hip scans were also performed with the IRB approval, and the results from siWIFI and IDEAL scans were compared. Table 1 summarizes the sequence parameters. A magnetization transfer (MT) module was also incorporated into siWIFI for simultaneous quantification of fat fraction and MT ratio (MTR) in water (TR/TE=107.1/2.3ms, FA=6o, slice-thickness=3mm, matrix=220×220, FOV=16cm×16cm, MT pulse flip angles=0o (MT off) and 1200o (MT on), offset frequency=1500Hz).Results
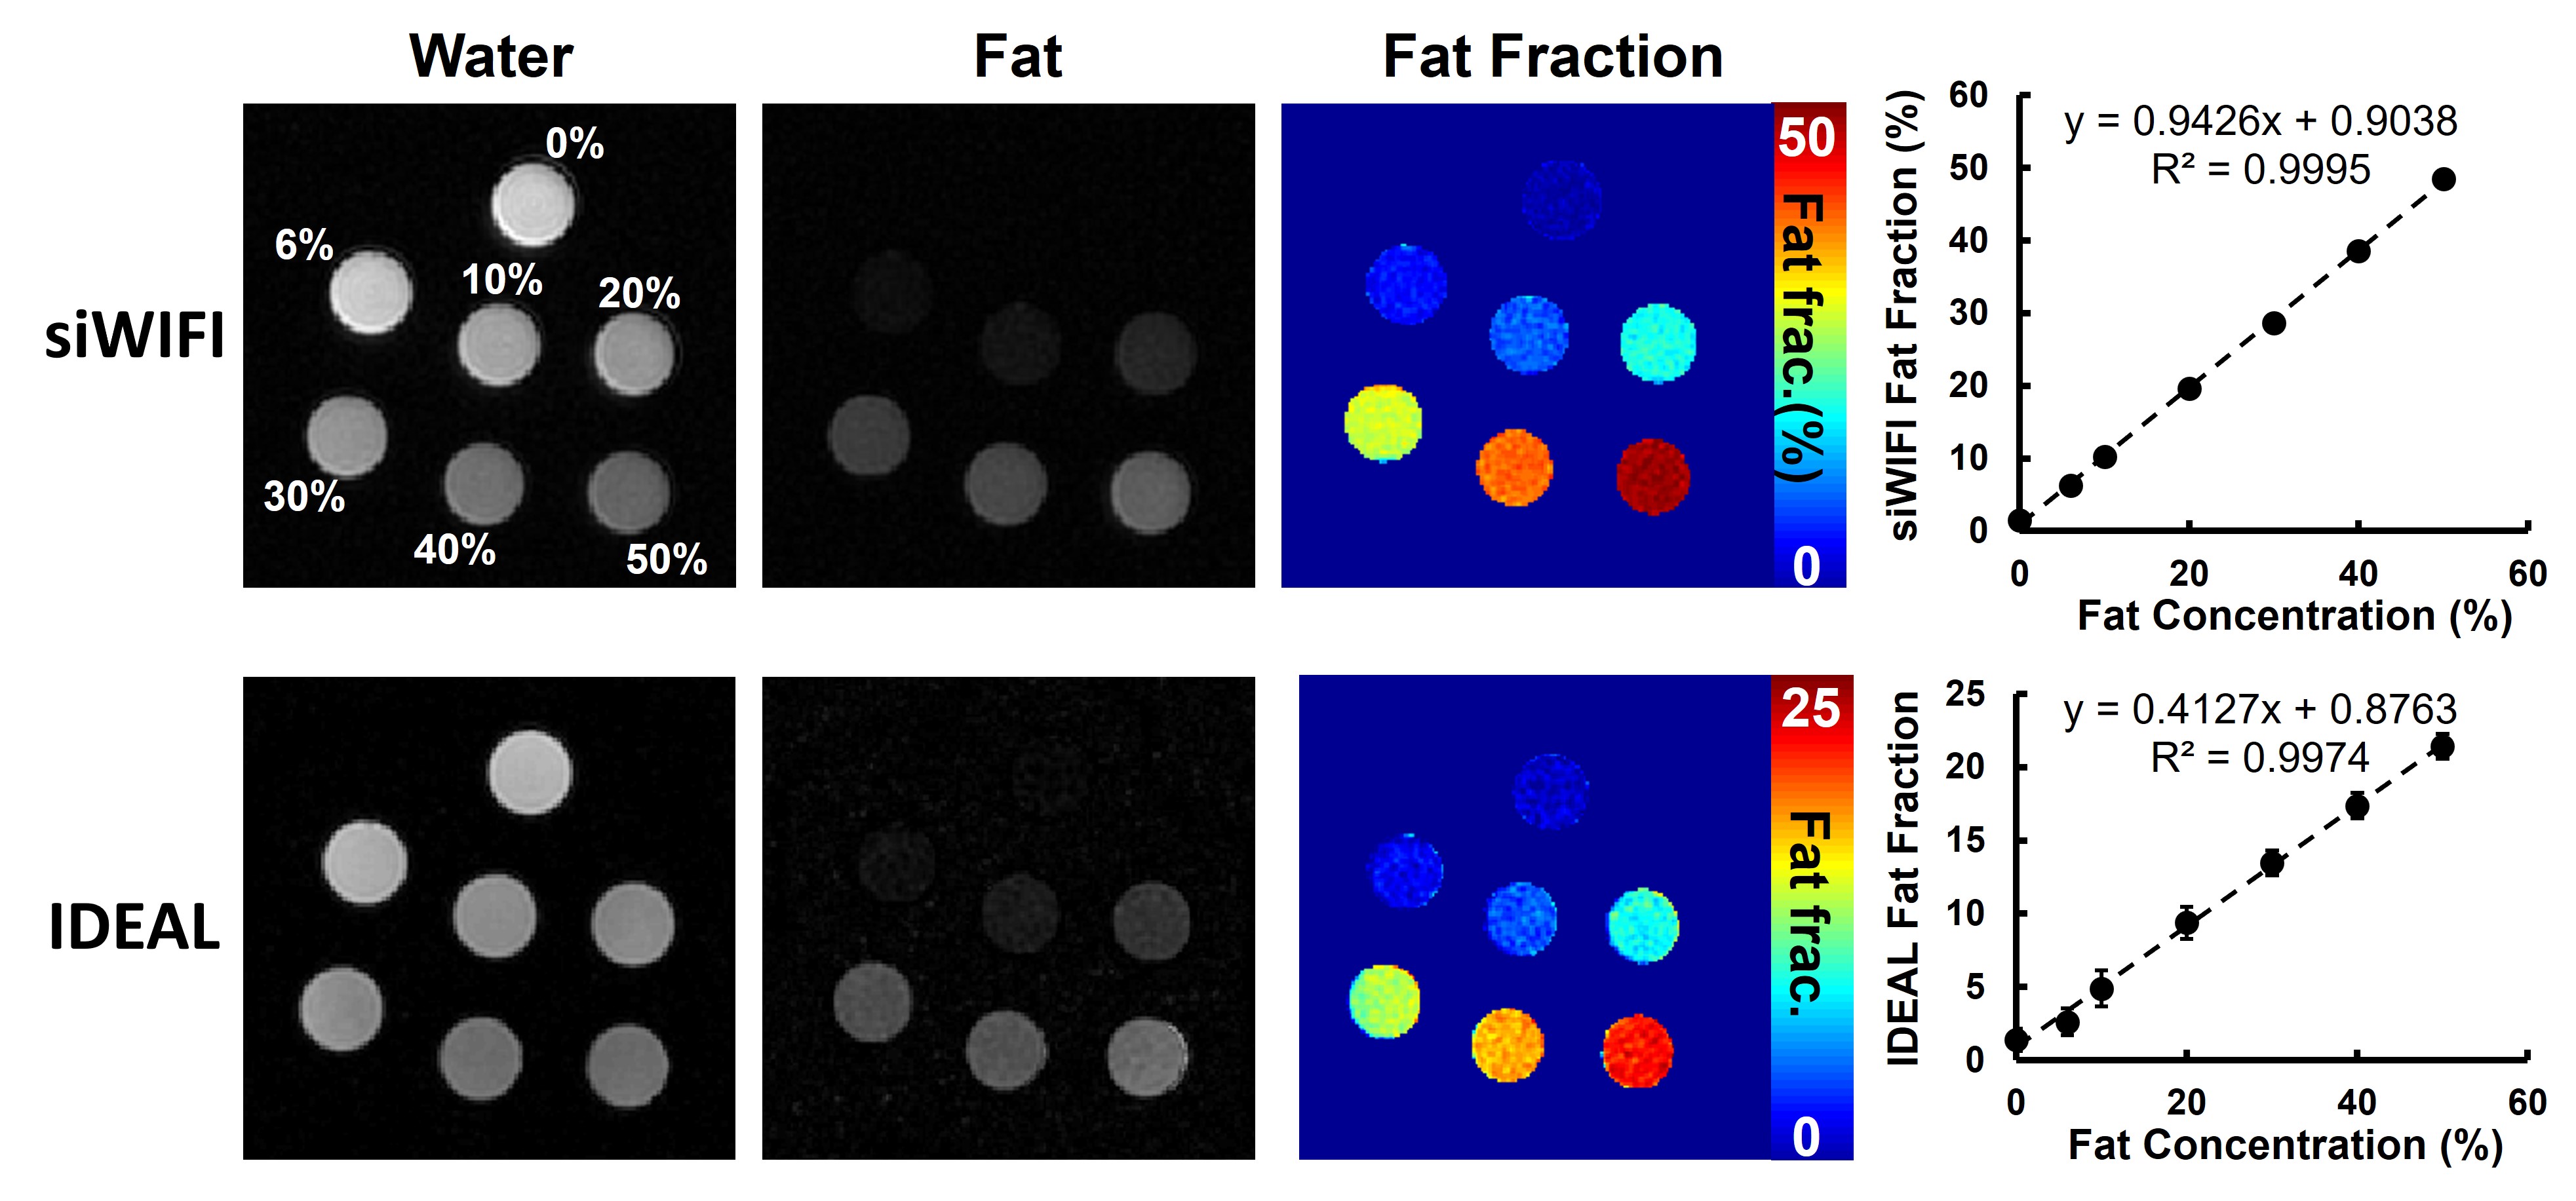
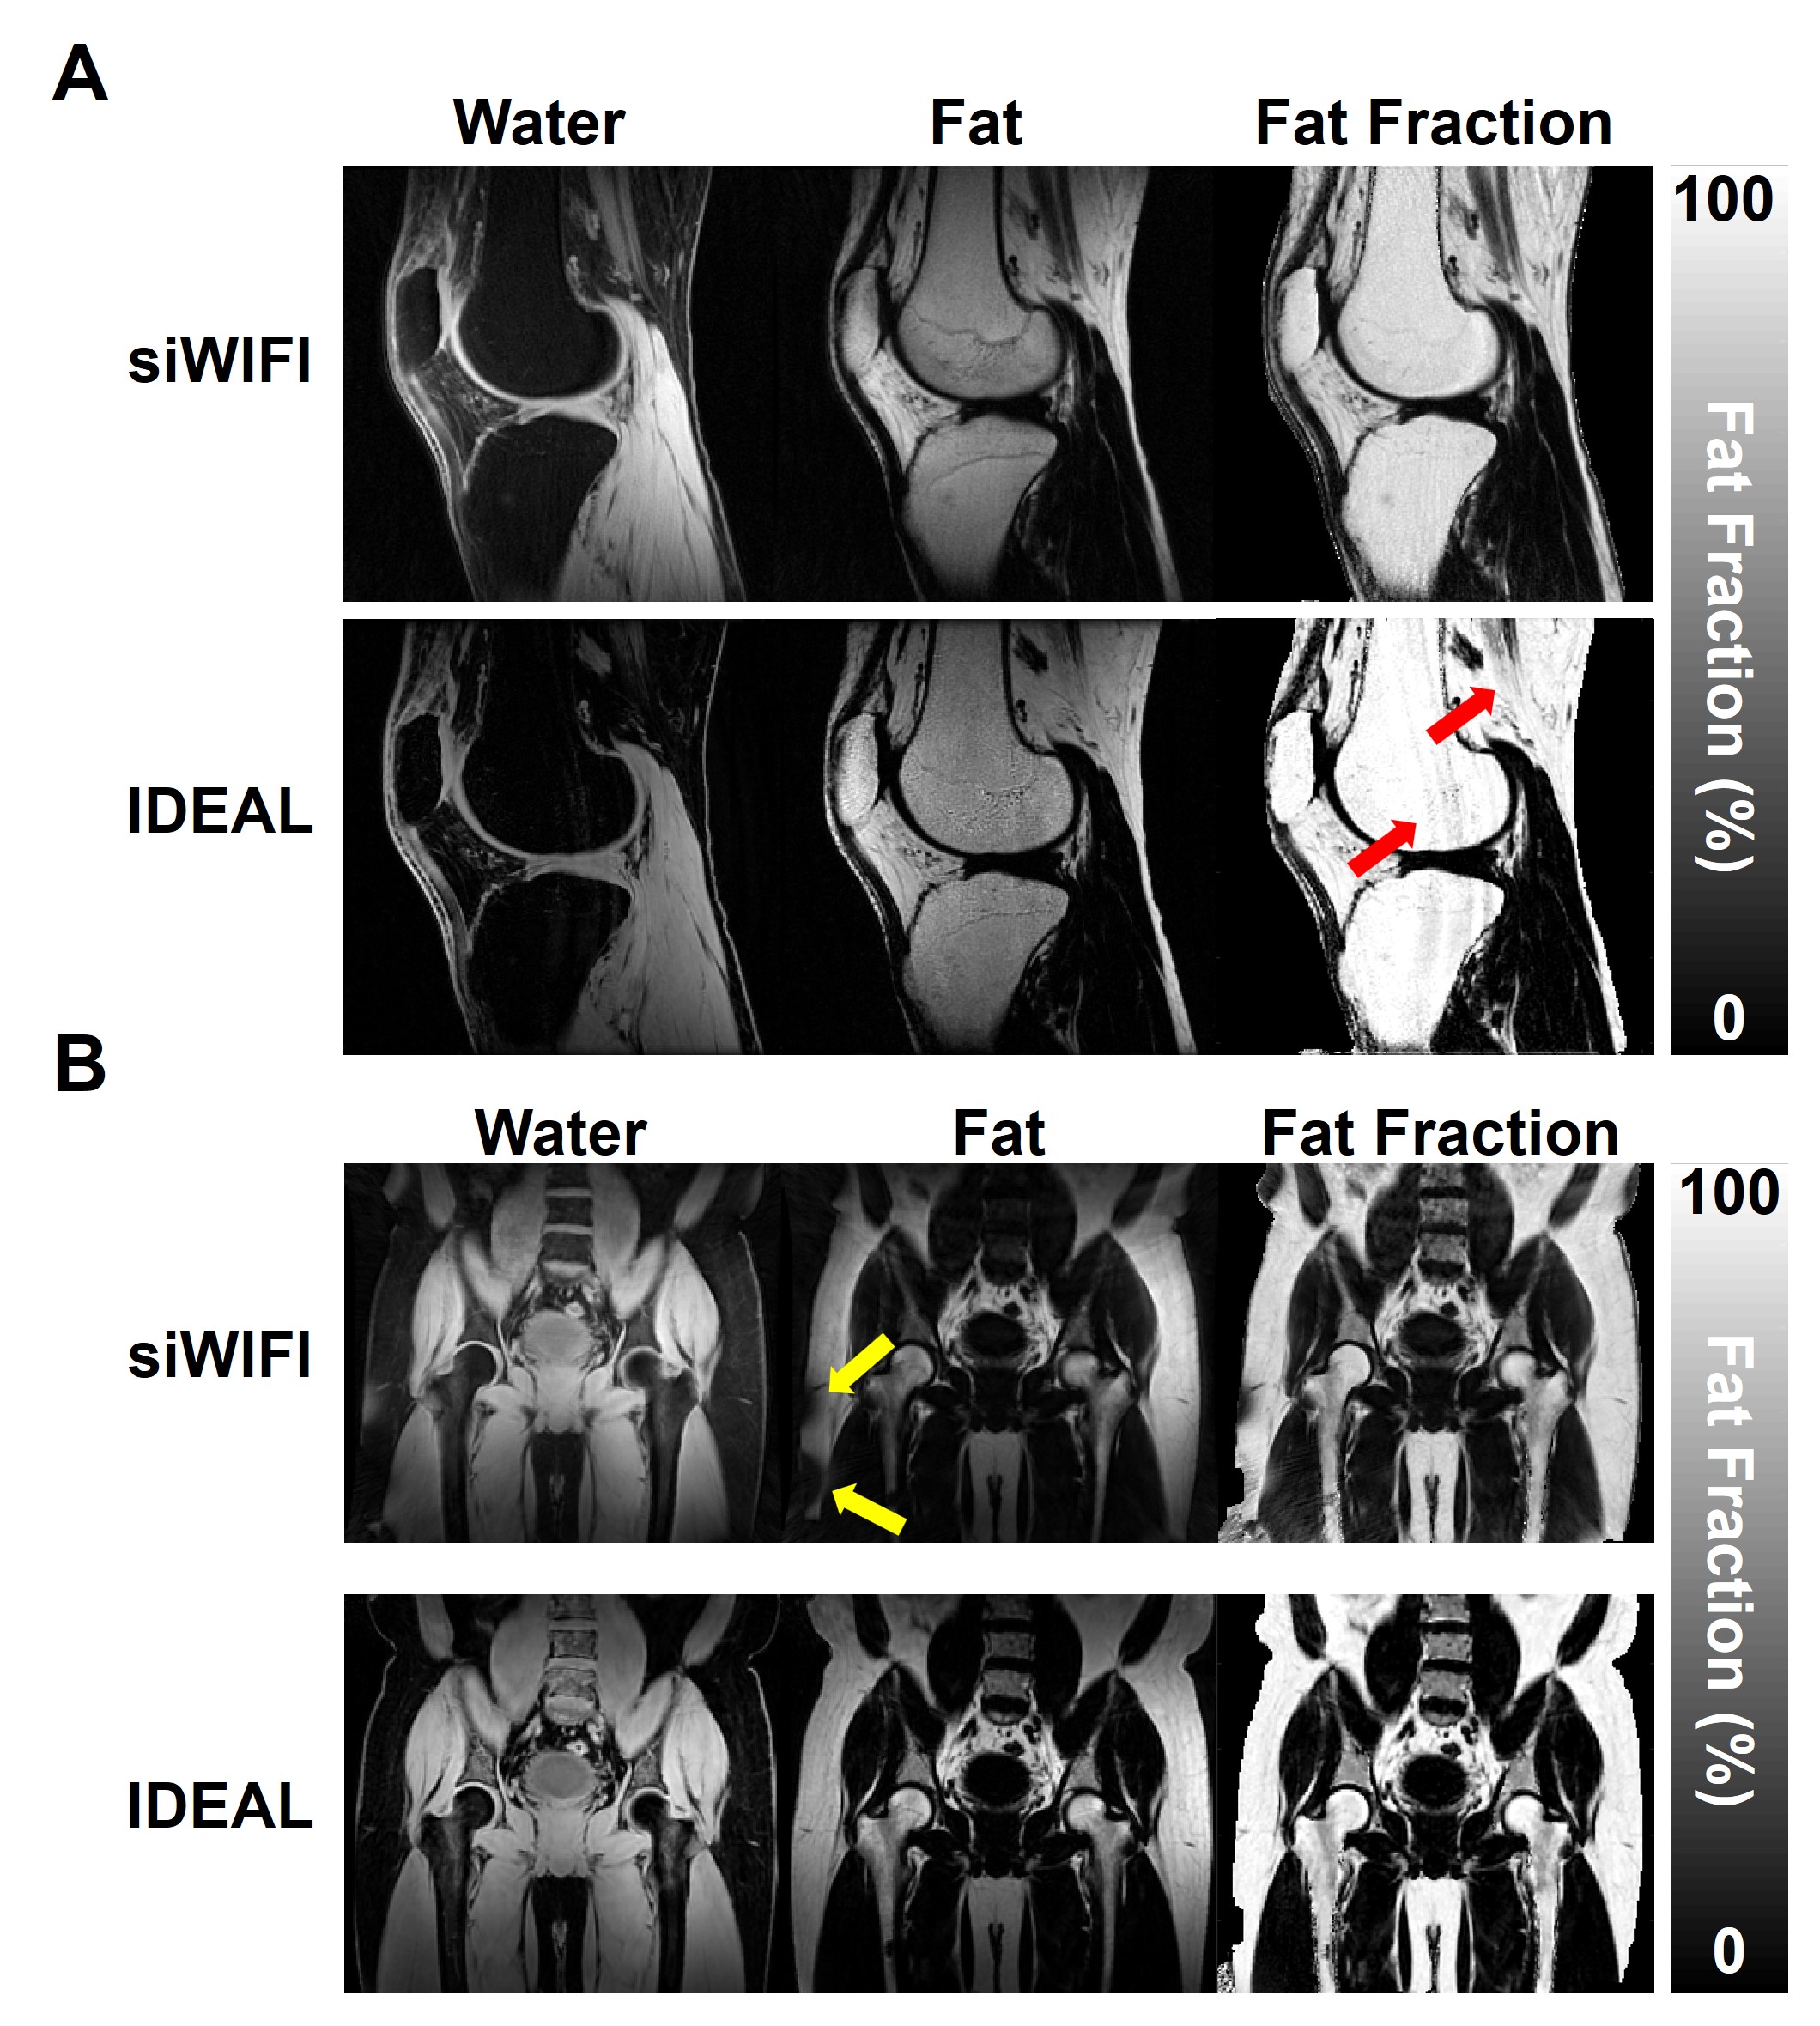
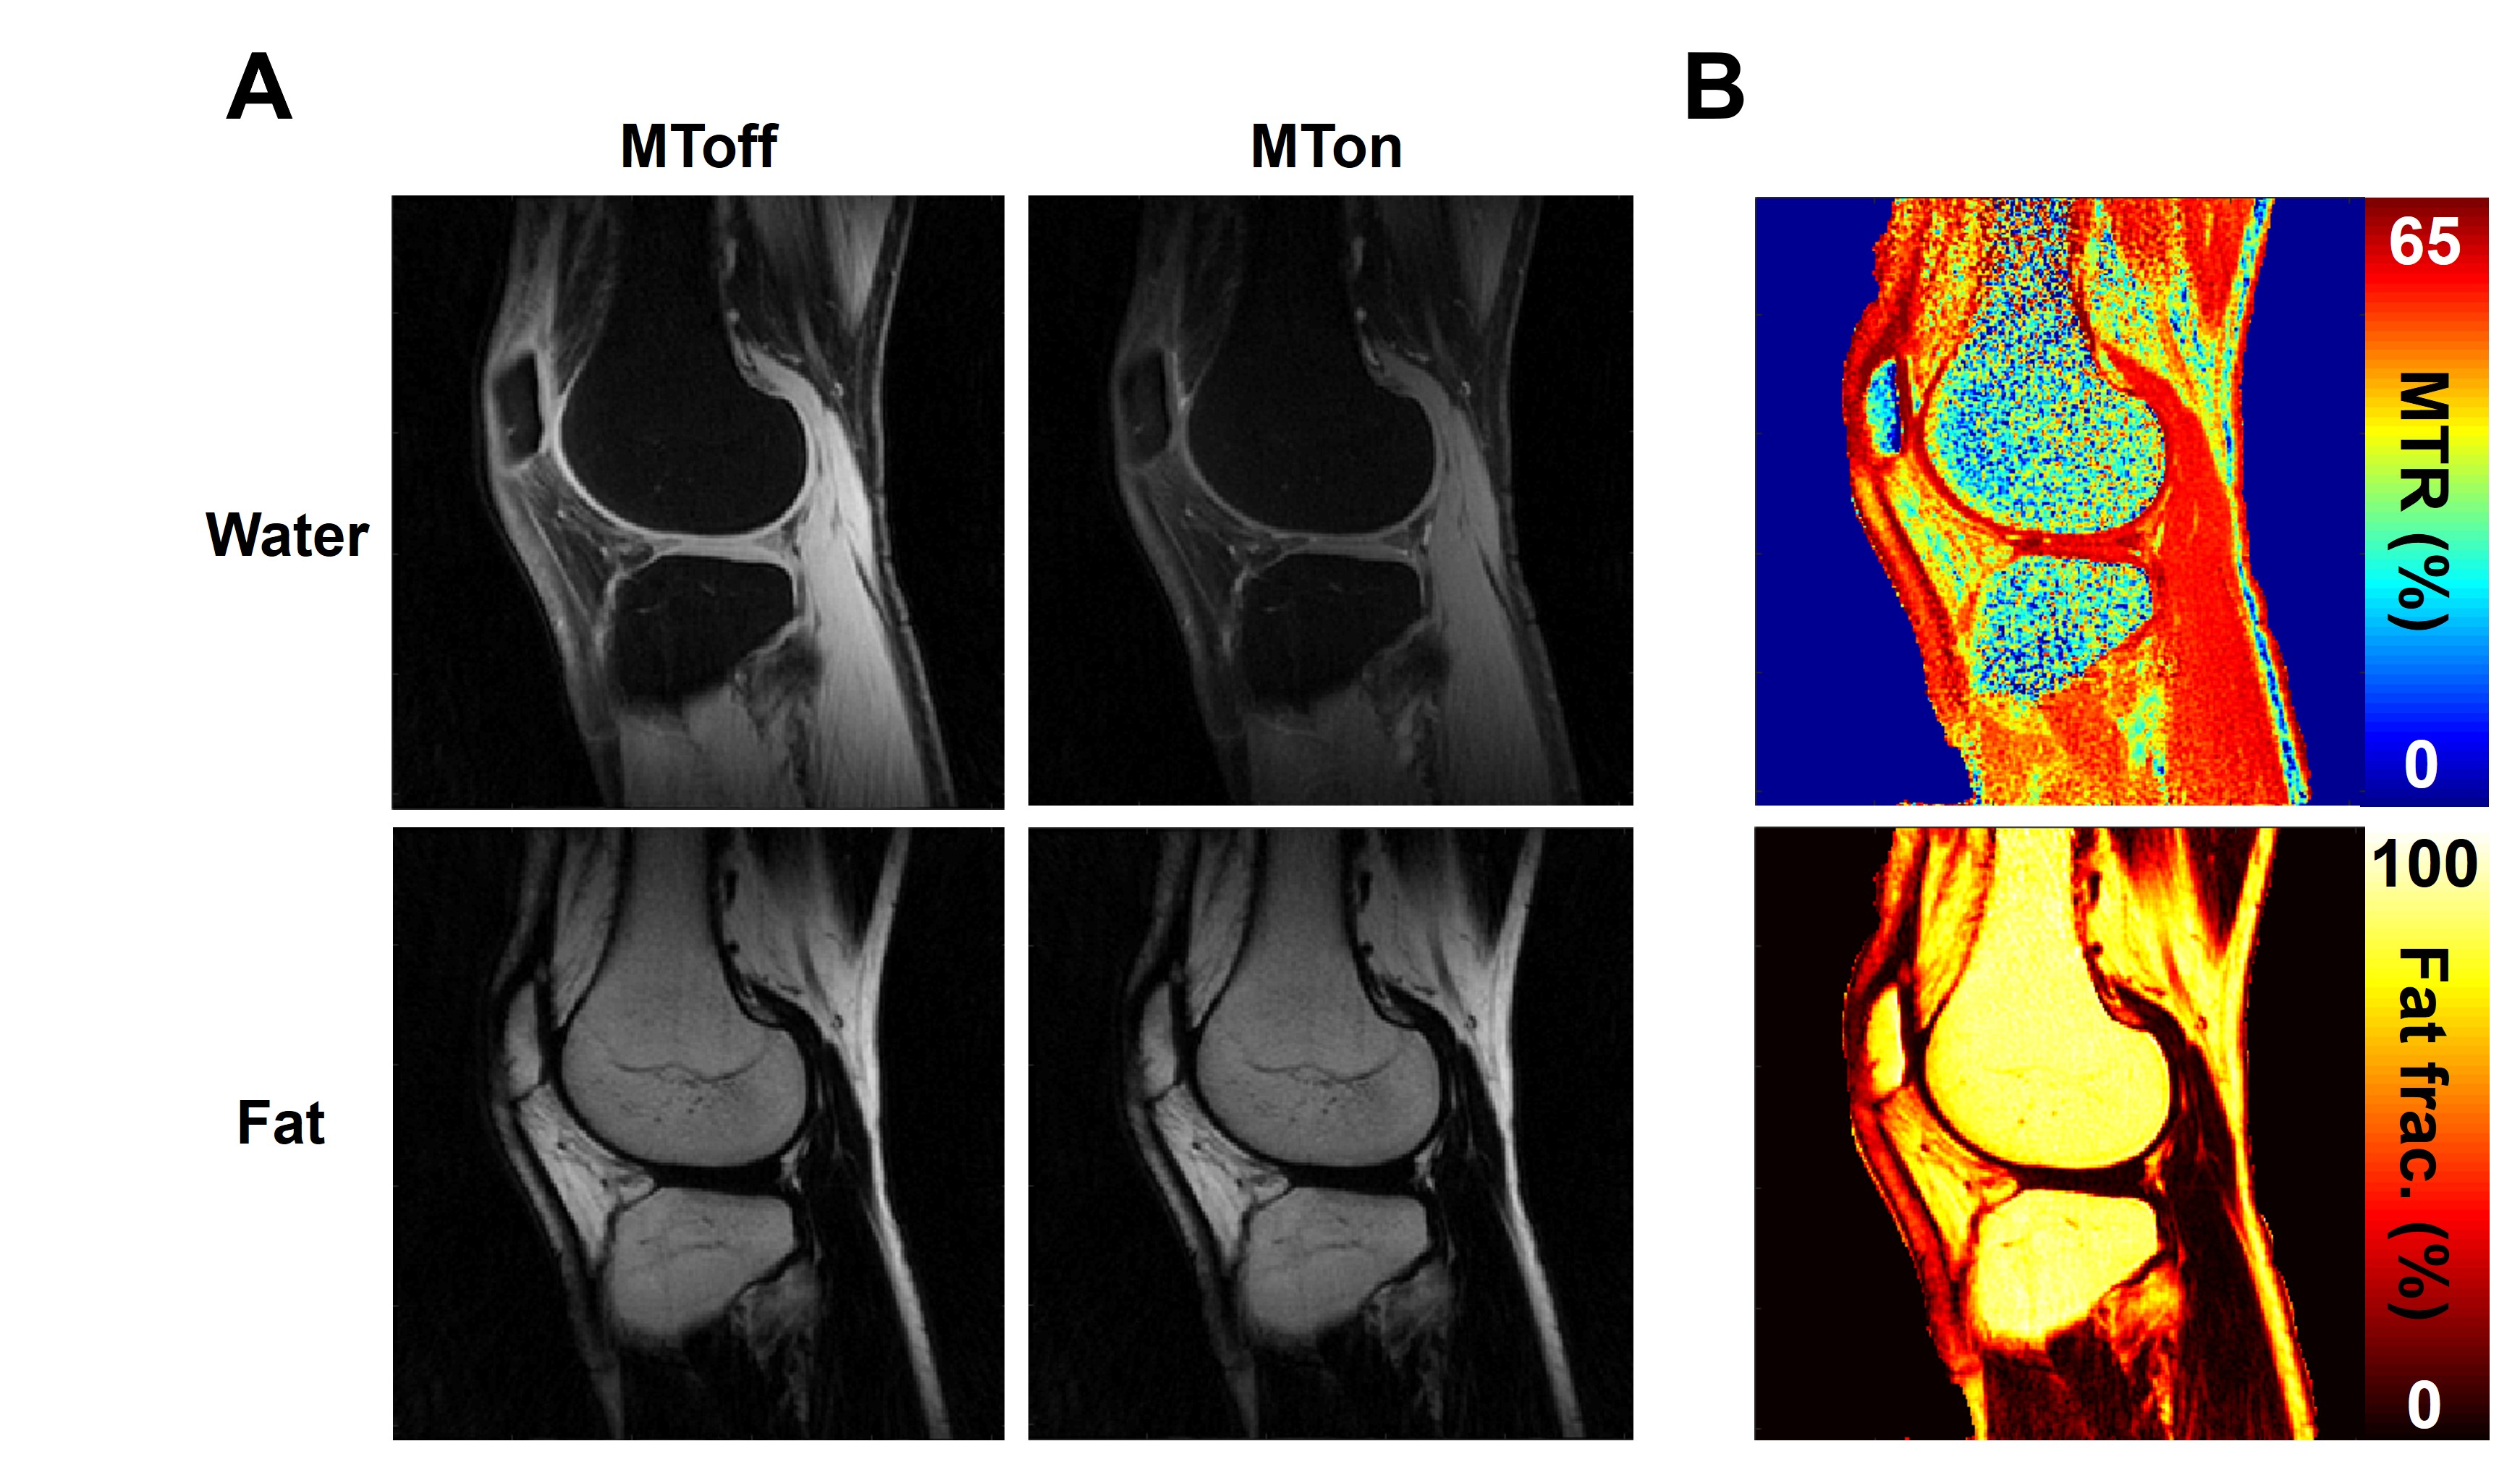
The fat fractions of the microlipid phantoms measured with the siWIFI technique showed excellent correlation with the fat concentration (R2 = 0.9995) (Figure 2). The water, fat, and fat fraction images from the siWIFI knee scan showed comparable results with the IDEAL scan. Prominent artifacts induced by the blood flow pulsation were seen on the IDEAL scans, but not on siWIFI images (Figure 3A). Hip scans showed similar results on siWIFI and IDEAL images, but susceptibility-induced artifacts were present on the siWIFI images (Figure 3B). The MT-weighted images showed saturation effects on the siWIFI water images, but not on the fat images (Figure 4A). The MTR map generated from siWIFI-water images delineated ligaments, cartilage, menisci and muscle (Figure 4B). In addition, the fat fraction maps were generated using the same set of images without MT saturation (i.e., MT off).Discussion
siWIFI imaging showed similar performance to IDEAL without the need for complex model-based fat-water separation processing. The excellent correlation between the fat concentration and the fat fraction measurements from siWIFI indicates that accurate fat quantification can be achieved using siWIFI. Moreover, no blood flow-induced artifacts were seen in siWIFI images because of the center out radial readout scheme which is inherently motion-compensated. The fat fractions estimated from siWIFI scans in the knee and hip were generally lower than the IDEAL values. This may be caused by partial excitation of fat due to its relatively broad frequency spectrum compared to the narrow bandwidth of the siWIFI excitation pulse. Combining siWIFI with MT preparation simultaneously generated MTR and fat fraction maps. The absence of MT saturation effects on the fat images also supports the view that siWIFI is spectrally selective as fat does not show MT contrast (Figure 4A). Simultaneous quantification of fat fraction and mapping of water MT contrast is expected to be useful in disease settings involving fat infiltration and the development of fibrosis, such as muscle degeneration after rotator cuff tendon tearing5. However, the susceptibility-induced artifact shown in the hip scans implies the vulnerability of siWIFI to B0 inhomogeneity, due to its narrow excitation bandwidth. Future studies will be performed to further assess the impact of B0 inhomogeneity on siWIFI in clinical practice.Conclusion
The new siWIFI sequence can reliably image water and fat separately without the need for model-based post-processing. When combined with contrast schemes (such as MT), the siWIFI technique can simultaneously quantify the fat-water composition and MRI tissue properties.Acknowledgements
The authors acknowledge grant support from National Institutes of Health (R01AR062581, R01AR068987, R01AR075825, K01AR080257 and R01AR079484, and RF1AG075717), VA Research and Development Services (Merit Awards I01CX001388, I01CX002211, and I01BX005952), DFG (SE 3272/1-1) and GE Healthcare.References
1. Reeder SB, Hu HH, Sirlin CB. Proton density fat-fraction: a standardized MR-based biomarker of tissue fat concentration. J Magn Reson Imaging. 2012;36:1011-1014.
2. Berglund J, Ahlstrom H, Johansson L et al., Two-point Dixon method with flexible echo times. Magn Reson Med. 2011;65:994-1004.
3. Reeder SB, Pineda AR, Wen Z et al., Iterative decomposition of water and fat with echo asymmetry and least-squares estimation (IDEAL): Application with fast spin-echo imaging. Magn Reson Med. 2005;54: 636-644.
4. Kirchgesner T, Acid S, Perlepe V et al., Two-point Dixon fat-water swapping artifact: lesion mmicker at musculoskeletal T2-weighted MRI. Skeletal Radiol. 2020;49:2081-2086.
5. Chang EY, Suprana A, Tang Q et al., Rotator cuff muscle fibrosis can be assessed using ultrashort echo time magnetization transfer MRI with fat suppression. NMR Biomed. 2023;e5058.
Figures