3668
A mathematical description of the changes of quantitative MPM parameters in ex-vivo whole brain human brains during fixation and hydration1Institut für Systemischeneurowissenschaften, Universitätsklinikum Hamburg-Eppendorf, Hamburg, Germany, 2Rechtsmedizin, Universitätsklinikum Hamburg-Eppendorf, Hamburg, Germany, 3Department of Neurophysics, Max Planck Institute for Human Cognitive and Brain Sciences, Leipzig, Germany, 4Max Planck Research Group MR Physics, Max Planck Institute for Human Development, Berlin, Germany
Synopsis
Keywords: Multi-Contrast, Modelling, Fixation, Postmortem whole human brain, Hydration
Motivation: Relaxation rates in the in-vivo human brain are strongly different to their counterparts in formalin-fixed postmortem tissue.
Goal(s): To model the changes of the relaxation rate parameters for different tissue stages from in-vivo to ex-vivo: unfixed, during fixation and during hydration.
Approach: The multi-parameter mapping (MPM) protocol was used to measure the changes of five whole-human brains across the aforementioned tissue stages, and different saturation models were tested to describe relaxation parameter changes during fixation.
Results: The MPM parameters varied strongly per tissue stage, and a mathematical description of the change of the MPM during fixation was found.
Impact: We characterised the MPM parameters during the fixation and hydration process across the entire brain and propose a mathematical model to describe the changes. This information could facilitate translating microstructure-mapping methods from fixed ex-vivo tissue samples to in-vivo application
Introduction
Quantitative Magnetic Resonance Imaging (qMRI) provides indirect proxies for tissue microstructure like myelin and iron content. Multi-parameter mapping (MPM7) is a useful qMRI method, yielding in particular the following three qMRI parameters: longitudinal (R1) and effective relaxation rates (R2*) and magnetic transfer saturation (MTsat). One approach to directly estimate iron and myelin content from qMRI is to linearly map histology data and R1 and R2* relaxometry from MRI on the same formalin-fixed post-mortem tissue voxelwise1,2,3. However, this mapping doesn't apply to in-vivo MPM parameters due to various factors affecting the tissue state like excision, paraformaldehyde (PFA) fixation and hydration4,5,6. This study aims at quantifying the changes in MPM parameters from in-vivo measurements to postmortem measurements in whole human brains, covering in-situ measurements, fixation, and hydration. Additionally, we tested different saturation models to describe the MPM parameters changes during fixation.Methods
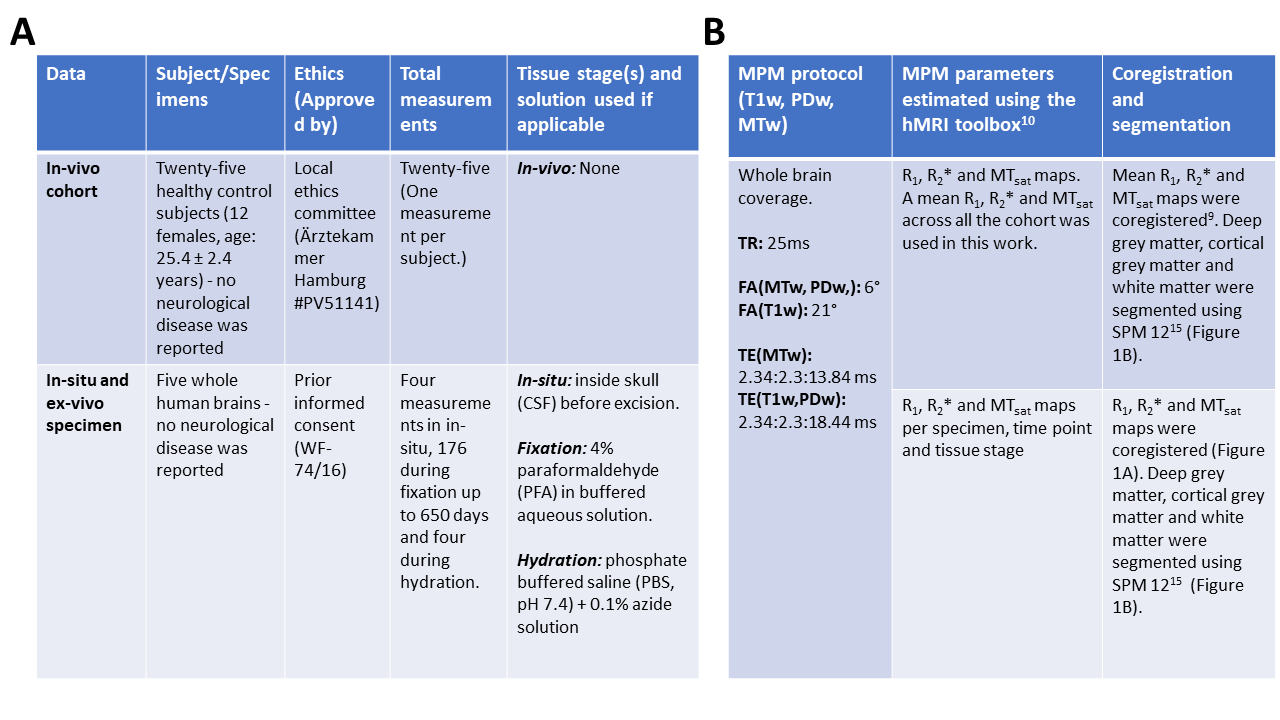
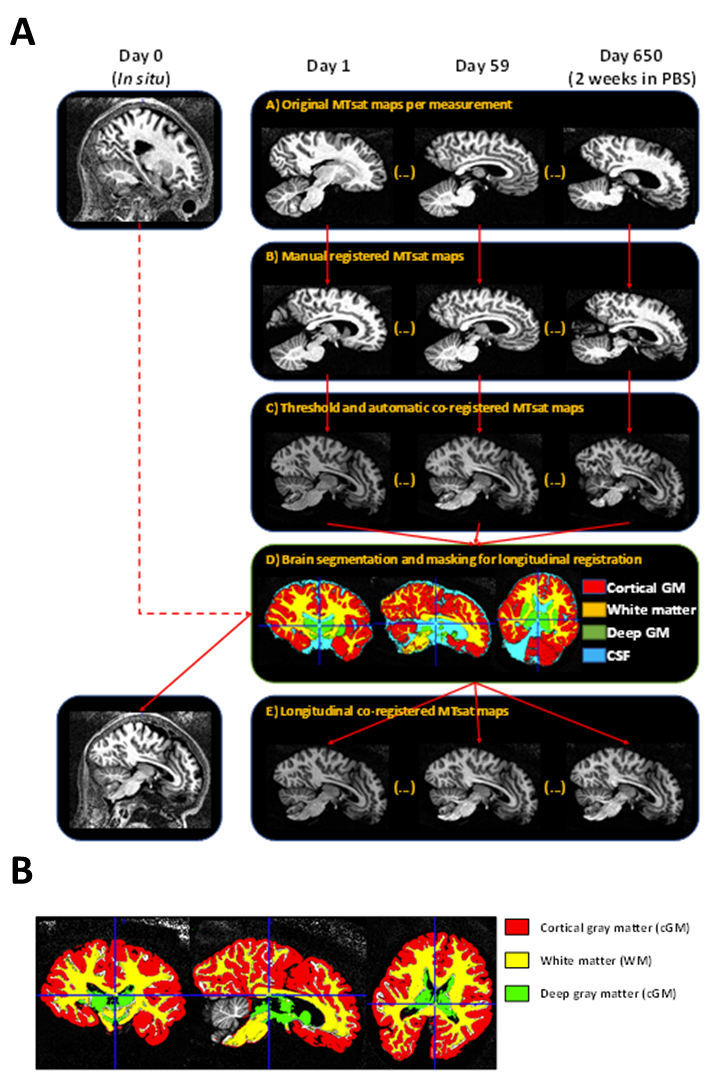
Table 1A details the information about the in-vivo cohort and postmortem specimens, while Table 1B details the MR data acquisition and preprocessing. Two analysis were performed across the white matter, cortical and deep gray matter. These regions are referred hereafter as tissue classes (Figure 1B).Comparison of the different tissue conditions: we estimated the mean values of the MPM parameters for each tissue class (Figure 1B) acquired at five distinct tissue stages: in-vivo, in-situ, fixed at a common time (i.e., 93-95 days in fixative, c-PFA) and last measured time point (i.e., 93-620 days, l-PFA) across specimens, and following hydration (i.e., > 2 weeks in PBS). The difference of the mean values between consecutive tissue stages was also estimated.
Fixative modelling: the temporal evolution of the median estimated MPM parameters were modelled using two saturation models within all tissue classes across all ex-vivo brain specimens. The first saturation model (M1) postulates that the changes in relaxation rates between the unfixed tissue ($$$R_{t0}$$$) and fixed tissue can be expressed through an exponential saturation process, resulting in the following model:
$$M1=R_{t0}+\Delta R_s(1-exp(-t/\tau_s))$$
where $$$\Delta R_s$$$ is the saturation change [1/seconds] and $$$\tau_s$$$ is the saturation time [days]. The second saturation model (M2) proposes that the fixation process in the tissue unfolds in two stages instead12. That model is:
$$M1=R_{t0}+\Delta R_s(1-exp(-t/\tau_s))+\Delta R_l(1-exp(-t/\tau_l))$$
where $$$\Delta R_s$$$ and $$$\Delta R_l$$$ are the short and long saturation changes [1/seconds], and $$$\tau_s$$$ and $$$\tau_l$$$ are the short and long saturation times [days], respectively. To evaluate which model best describes the temporal changes in MPM parameters due to fixation, we calculated the Bayesian Information Criterion (BIC13) per tissue class.
Results
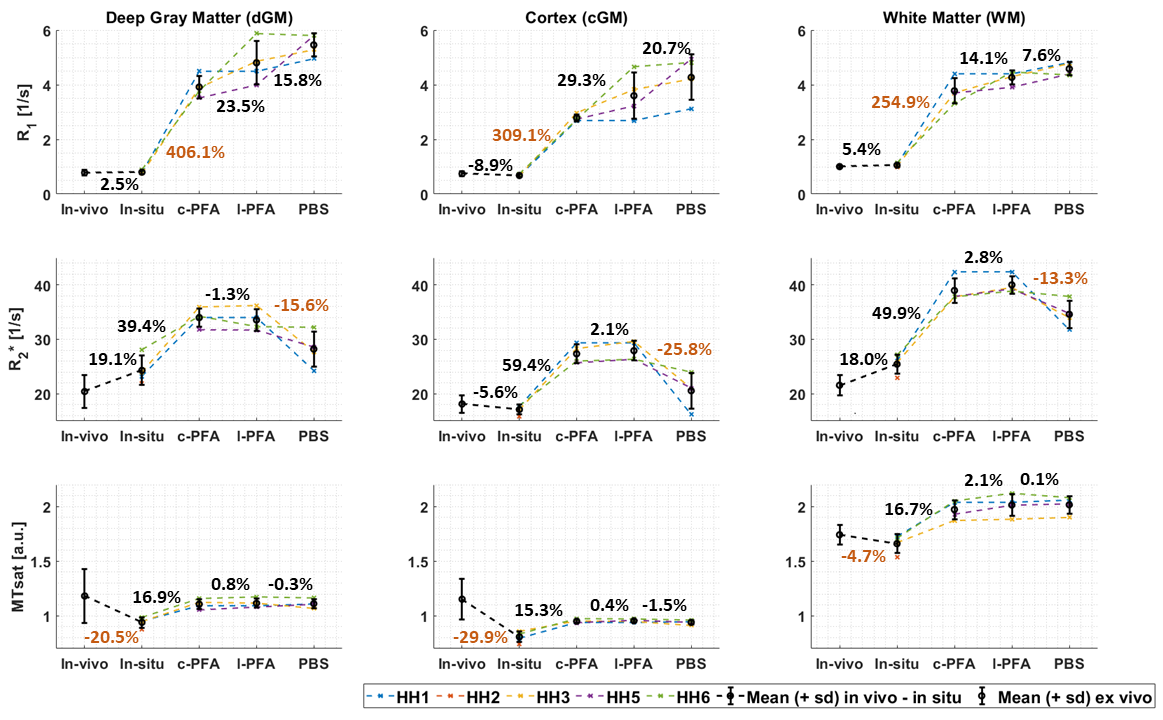
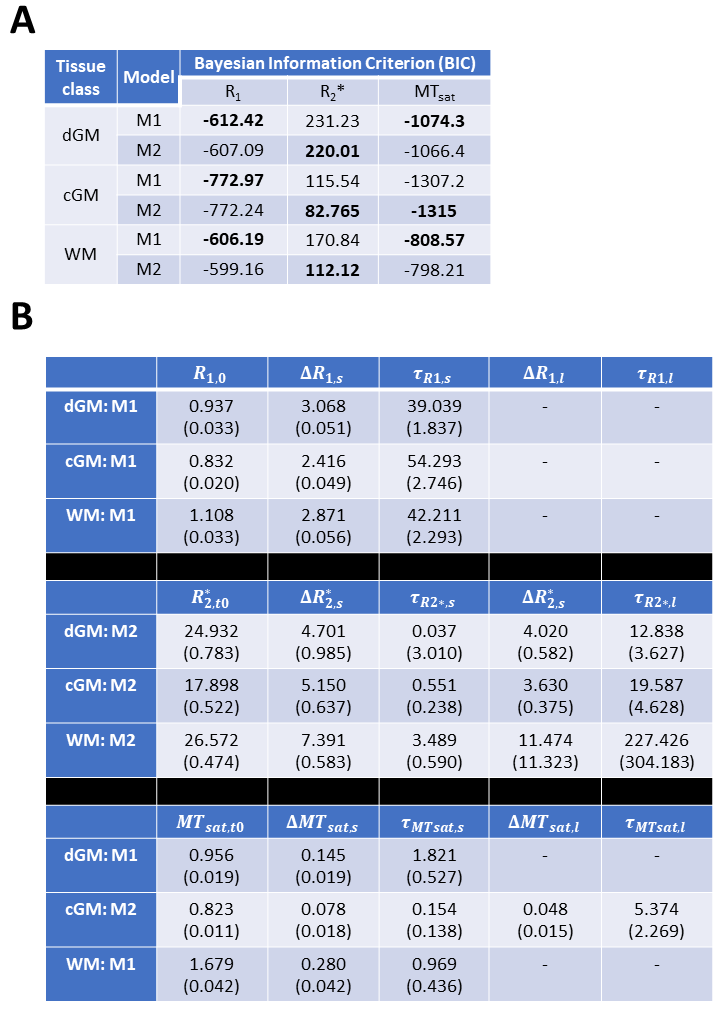
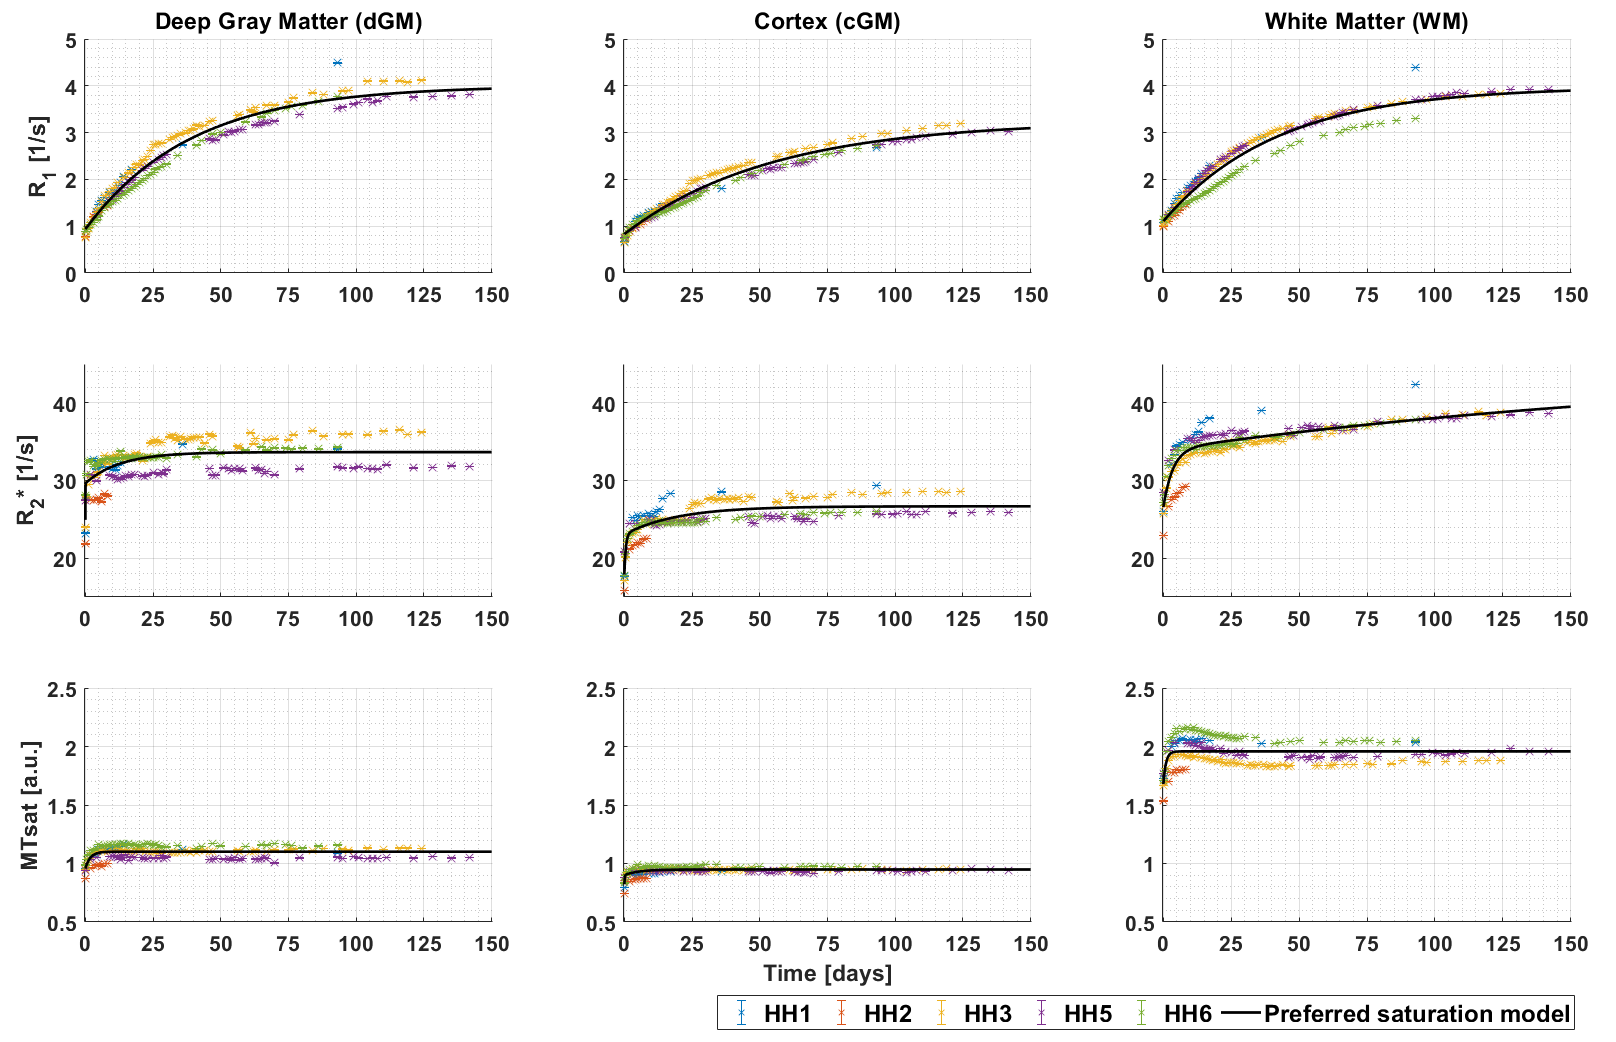
Figure 2 compares MPM parameters across different tissue stages and classes. It also shows the percentual difference between tissue stages. From in-vivo to in-situ condition, R2* and MTsat varies strongly for each tissue class. During fixation, R1 increases the most (>200%), followed by R2* (~45%) and MTsat (~15%). Over longer times (l-PFA), R1 continues increasing while R2* and MTsat remain stable. During hydration, R2* decreases (<25%) while R1 slightly increases and MTsat remains constant.Figure 3 shows the temporal evolution of each MPM parameter per specimen and tissue classes. Furthermore, the figure depicts the curve representing the winning model for each tissue class and MPM parameter (black curves) based on the BIC values (Table 2A). The fitted values of the winning model are listed in Table 2B.
All winning models captured the temporal evolution of the MPM parameters due to fixation, particularly M1 for R1 and M2 for R2*. However, the temporal evolution exhibited greater variability between brain specimens for R2* in dGM and MTsat in WM, making it challenging to describe these temporal changes with one single model. None of the proposed model was capable of describing the initial 10-15 days overshoot of MTsat values during fixation, which was particularly pronounced in white matter (bottom, right subplot).
Discussion and conclusion
Our study confirmed changes in relaxation rates during fixation4,5,6,8 and hydration. Moreover, we found mathematical models describing the MPM parameter changes during fixation. This model allows relating MPM parameters at different fixation times and after hydration to their in-vivo counterparts. Two important limitations are (1) the model describe fixation effects in 4% PFA and may not be applicable to other fixatives, (2) using the same in-vivo MPM protocol for ex-vivo samples may introduce parameter estimation bias. In summary, our model bridges the gap between in-vivo and fixed ex-vivo MRI, enabling potential in-vivo applications of MRI-based microstructure mapping derived from fixed ex-vivo samples like estimating iron and myelin from relaxometry parameters2,3.Acknowledgements
This work was supported by the German Research Foundation (DFG Priority Program 2041 "Computational Connectomics”, [MO 2397/5-1; MO 2249/3–1; KI 13372-2; WE 5046/4-2; MO 2397/5-2; MO 2249/3], by the Emmy Noether Stipend: MO 2397/4-1 and MO 2397/4-2) and by the BMBF (01EW1711A and B) in the framework of ERA-NET NEURON and the Forschungszentrums Medizintechnik Hamburg (fmthh; grant 01fmthh2017). The research leading to these results has received funding from the European Research Council under the European Union's Seventh Framework Programme (FP7/2007-2013) / ERC grant agreement n° 616905.References
[1] Eriksson, S.H., Free, S.L., Thom, M., Martinian, L., Symms, M.R., Salmenpera, T.M., McEvoy, A.W., Harkness, W., Duncan, J.S., Sisodiya, S.M., 2007. Correlation of quantitative MRI and neuropathology in epilepsy surgical resection specimens—T2 correlates with neuronal tissue in gray matter. NeuroImage 37, 48–55. https://doi.org/10.1016/j.neuroimage.2007.04.051
[2] Kirilina, E., Helbling, S., Morawski, M., Pine, K., Reimann, K., Jankuhn, S., Dinse, J., Deistung, A., Reichenbach, J.R., Trampel, R., Geyer, S., Müller, L., Jakubowski, N., Arendt, T., Bazin, P.-L., Weiskopf, N., 2020. Superficial white matter imaging: Contrast mechanisms and whole-brain in vivo mapping. Science Advances 6, eaaz9281. https://doi.org/10.1126/sciadv.aaz9281
[3] Stüber, C., Morawski, M., Schäfer, A., Labadie, C., Wähnert, M., Leuze, C., Streicher, M., Barapatre, N., Reimann, K., Geyer, S., Spemann, D., Turner, R., 2014. Myelin and iron concentration in the human brain: A quantitative study of MRI contrast. NeuroImage 93, 95–106. https://doi.org/10.1016/j.neuroimage.2014.02.026
[4] Shatil, A.S., Uddin, M.N., Matsuda, K.M., Figley, C.R., 2018. Quantitative Ex Vivo MRI Changes due to Progressive Formalin Fixation in Whole Human Brain Specimens: Longitudinal Characterization of Diffusion, Relaxometry, and Myelin Water Fraction Measurements at 3T. Frontiers in Medicine 5.
[5] Shepherd, Timothy M., Thelwall, P.E., Stanisz, G.J., Blackband, S.J., 2009. Aldehyde fixative solutions alter the water relaxation and diffusion properties of nervous tissue. Magnetic Resonance in Medicine 62.
[6] F. Fritz; J. M. Oeschger; O. Ohana; T. Sauvigny; S. Mohammadi. 2023. Diffusion and relaxometry study of an excised temporal lobe from a drug-resistance epilepsy patient using in vivo and ex vivo MRI. Proc. Intl. Soc. Mag. Reson. Med. 31.
[7] Weiskopf, N., Suckling, J., Williams, G., Correia, M.M., Inkster, B., Tait, R., Ooi, C., Bullmore, E.T., Lutti, A., 2013. Quantitative multi-parameter mapping of R1, PD(*), MT, and R2(*) at 3T: a multi-center validation. Front Neurosci 7, 95.
[8] Streubel, T; Ashtarayeh, M; Mushumba, H.; Papazoglou, S.; Püschel, K.; Mohammadi, S.; 2019. Longitudinal assessment of relaxation and magnetization transfer saturation rates during formalin fixation across fiber pathways of the human brai. Proc. Intl. Soc. Mag. Reson. Med. 27.
[9] Emmenegger, T.M., David, G., Ashtarayeh, M., Fritz, F.J., Ellerbrock, I., Helms, G., Balteau, E., Freund, P., Mohammadi, S., 2021. The Influence of Radio-Frequency Transmit Field Inhomogeneities on the Accuracy of G-ratio Weighted Imaging. Frontiers in Neuroscience 15, 770. https://doi.org/10.3389/fnins.2021.674719
[10] Tabelow, K., Balteau, E., Ashburner, J., Callaghan, M.F., Draganski, B., Helms, G., Kherif, F., Leutritz, T., Lutti, A., Phillips, C., Reimer, E., Ruthotto, L., Seif, M., Weiskopf, N., Ziegler, G., Mohammadi, S., 2019. hMRI – A toolbox for quantitative MRI in neuroscience and clinical research. NeuroImage 194, 191–210. https://doi.org/10.1016/j.neuroimage.2019.01.029
[11] MATLAB. (2021). 9.11.0.1837725 (R2021b) Update 2. Natick, Massachusetts: The MathWorks Inc
[12] Thavarajah, R., Mudimbaimannar, V.K., Elizabeth, J., Rao, U.K., Ranganathan, K., 2012a. Chemical and physical basics of routine formaldehyde fixation. J Oral Maxillofac Pathol 16, 400–405. https://doi.org/10.4103/0973-029X.102496
[13] Ghosh, J.K., Delampady, M., Samanta, T., 2007. An Introduction to Bayesian Analysis: Theory and Methods, Springer Texts in Statistics. Springer New York.
Figures