3667
What is the optimal myelin marker? Evidence from multi-contrast MRI, histology, and deep learning1Bernard and Irene Schwartz Center for Biomedical Imaging, Department of Radiology, New York University Grossman School of Medicine, New York, NY, United States, 2Department of Neural and Behavioral Sciences, Penn State University, Hershey, PA, United States
Synopsis
Keywords: Multi-Contrast, Multi-Contrast, MR histology, multi-parametric MRI, deep learning, diffusion, magnetization transfer, relaxivity, mouse brain
Motivation: Deep neural networks trained with MRI and myelin histology data offer enhanced sensitivity and specificity compared to conventional MRI markers, yet their inner workings remain unknown.
Goal(s): To elucidate the relationships between MRI and myelin histology.
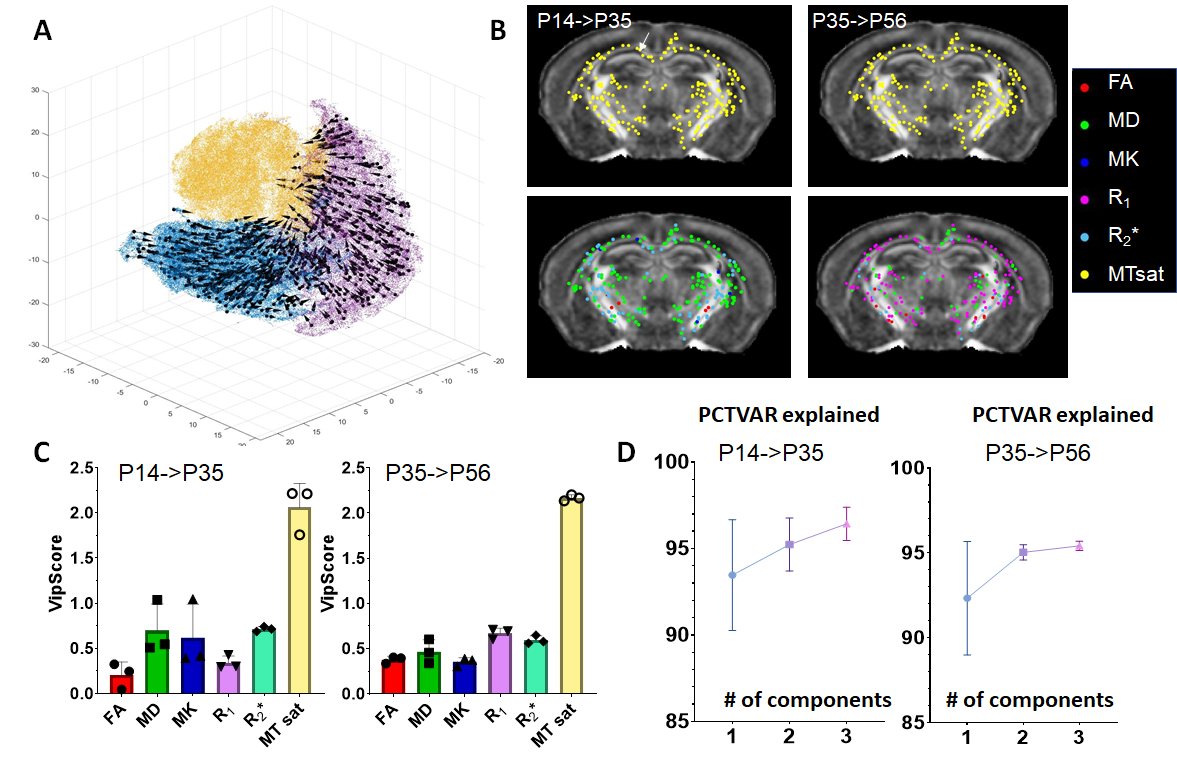
Approach: We mapped multi-parametric MRI data of developing mouse brains and their myelin content onto a 3D manifold after dimension reduction and defined the relationships between MRI and myelin signals in a piecewise fashion.
Results: Our findings revealed how the relationships between multiple MRI parameters and tissue myelin content evolved throughout brain development.
Impact: We have developed a novel data-driven approach to characterize the complex relationship between MRI parameters and myelin. The results suggest that multi-parametric MRI is necessary for accurate myelin mapping.
Introduction
MRI is an indispensable tool for non-invasive examinations of brain structures and functions, offering a multitude of contrasts that target specific cellular structures. However, the sensitivity and specificity of MRI measurements are often constrained due to their indirect nature and the limited understanding of the connection between MRI signals and cellular structures, as evidenced by previous correlation studies1.Efforts to develop sensitive markers for cellular structures can leverage the growing availability of 3D histological data. We previously introduced a deep-learning network named MRHNet2, which was trained using multi-parametric(MP)-MRI data and myelin histology from mouse brains, and demonstrated its enhanced ability to estimate tissue myelin content. Nonetheless, its internal mechanisms remained obscure, hindering further investigation into the individual contributions of MRI contrasts, which is critical for advancing myelin imaging.
In this study, we developed an innovative approach by mapping MP-MRI measurements from the mouse brain white matter (WM) onto a 3D manifold, on which a piecewise linear approximation of their relationships with myelin was constructed to assess their contributions to myelin estimation.
Methods
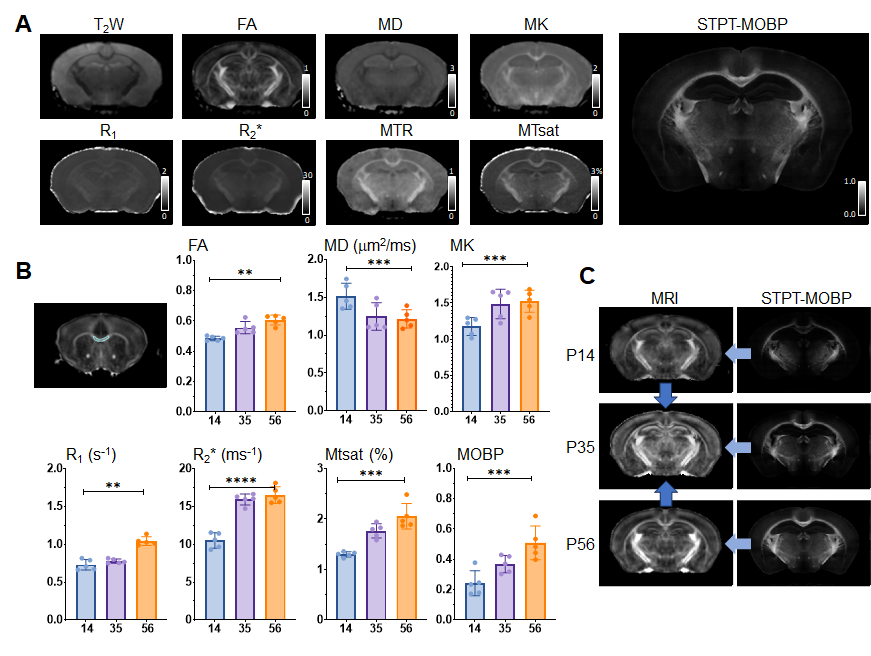
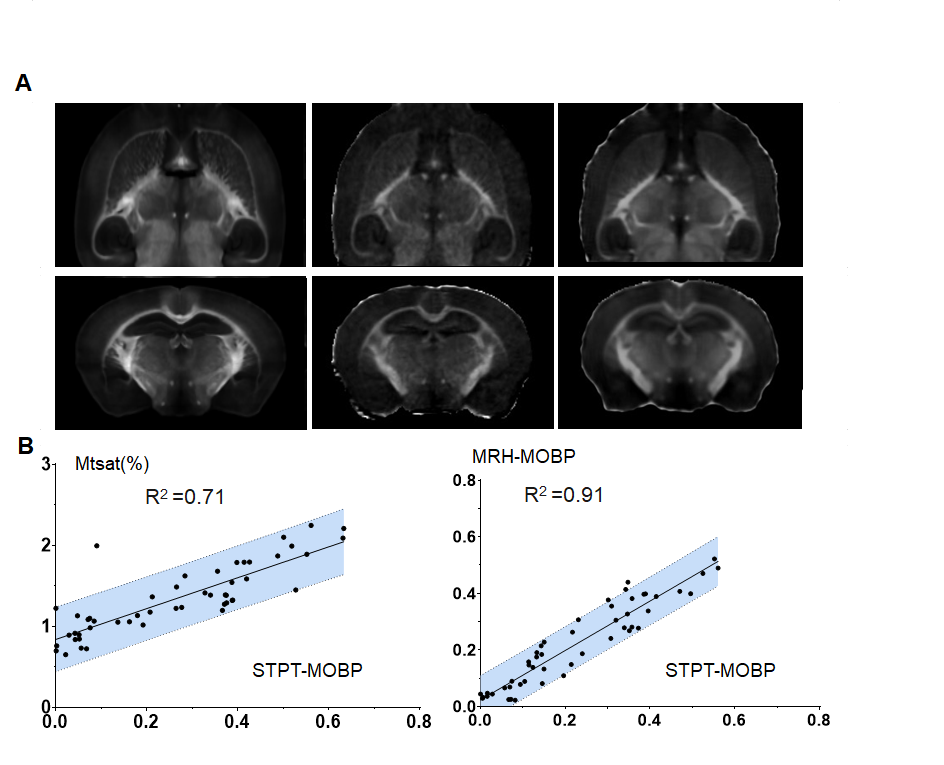
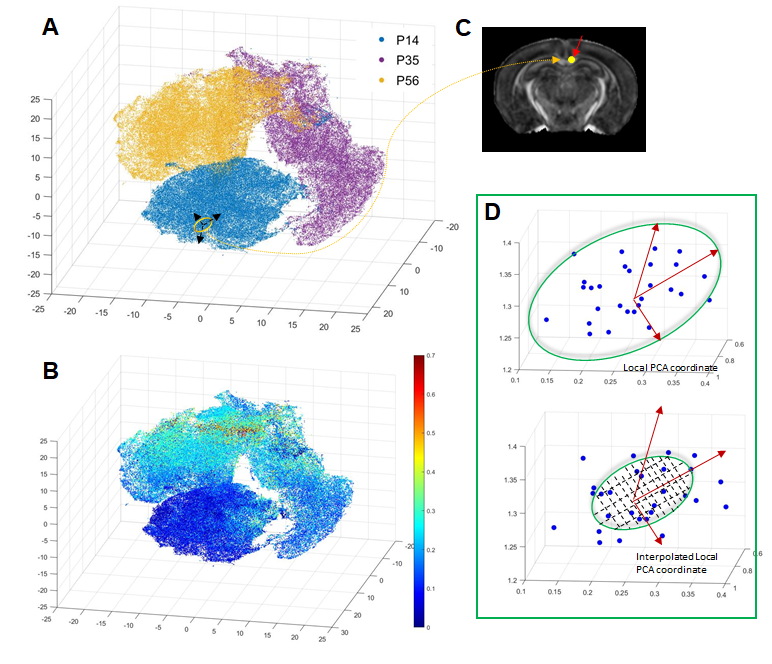
Animals, MRI, and serial two-photon tomography (STPT): Ex vivo T2-weighted, magnetization transfer (MT), and diffusion MRI data were acquired from MOBP-eGFP3 mouse brain at postnatal day 14 (P14), P35, and P56, representing early, mid, and late myelination stages (n=5 at each stage), using the protocol in2 with the addition of an MT saturation protocol4 (Fig.1A). The estimated FA, MD, MK, R1, R2*, and MTsat revealed changes associated with myelination (Fig.1B). 3D STPT images were downsampled and co-registered to MRI (0.1mm isotropic) from the same subject using iterative coarse-to-fine registration. Data from all subjects were normalized to a common template to follow temporal changes (Fig.1C). Results of MRHNet2 trained using the extensive set of data exhibited strong visual concordance with the STPT data (Fig.2A). A voxel-wise correlation analysis confirmed that MRHNet’s estimations were closely aligned with the STPT data (Fig.2B). Dimension reduction of 30,000 white matter voxel data from the MRI parameter space to a 3D manifold was achieved using non-linear t-distributed stochastic neighbor embedding (t-SNE)5(Fig.3A). Local analysis: For each voxel on the manifold, its 30 neighborhood voxels were identified to construct a local Euclidean (R3) space with bases from the first three principal components of MRI parameters (Fig.3C). Partial least square regression (PLSR) was performed using real and interpolated MRI parameters (~100) within the local R3 space as inputs and corresponding MRHNet output as responses to quantify the contributions of each MRI parameter for myelin prediction.Results
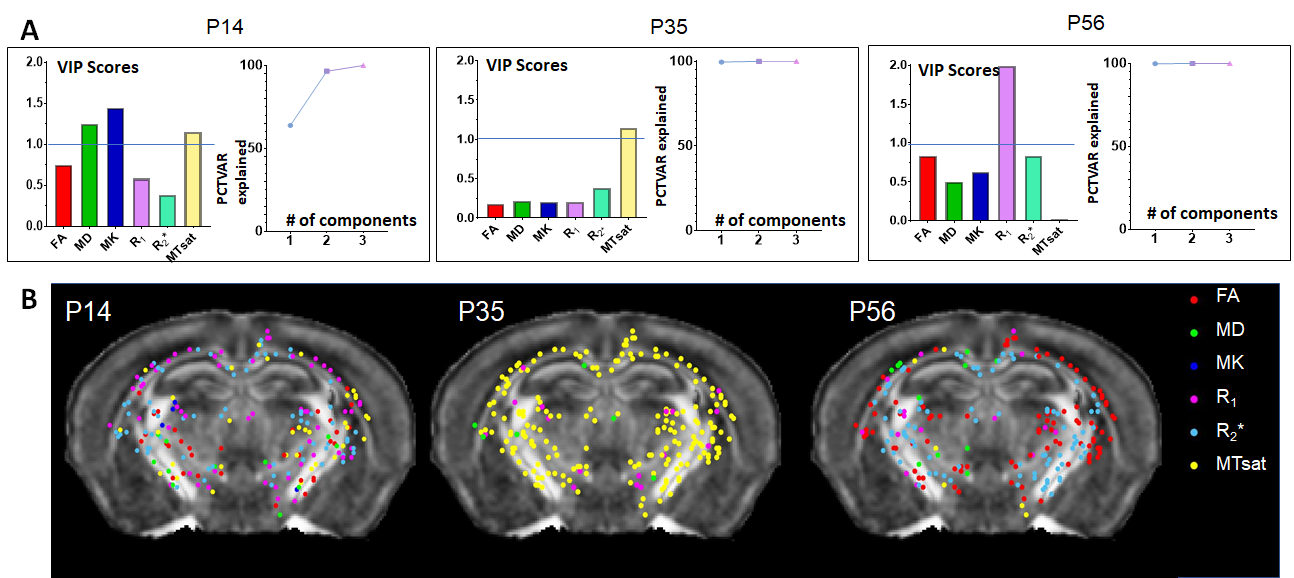
t-SNE mapped MRI data from WM voxels, mostly separated by age, into a 3D manifold (Fig.3A), on which the evolution of MRI parameters was tracked, forming the myelination trajectory. Since t-SNE preserves the local structure (i.e., proximate points on the manifold should exhibit similar MRI parameters) and MRHNet can be formulated as a function on the manifold, it can be analyzed in a piece-wise fashion (Fig.3). This approach enabled the identification of MRI parameters with the most significant contribution to myelin estimation at different developmental stages. For example, at P14 within a corpus callosum voxel, variable importance in projection (VIP) scores from PLSR indicated that MD, MK, and MTsat were key for myelin prediction (VIP>1, Fig.4A), whereas MTsat and R1 emerged as primary contributors at P35 and P56, respectively (Fig.4A). Fig.4B displays the predominant MRI parameters in selected WM voxels from P14 to P56.Furthermore, we investigated MRI contrasts capable of detecting myelin changes. PLSR analysis of temporal MRI parameter fluctuations and MOBP signals (Fig.5) revealed that MTsat was the most critical marker, accounting for 90% of the variance in MOBP signals. The inclusion of diffusion and relaxivity parameters further enhanced the predictive accuracy.
Discussion and conclusion
Inspired by recent neuroscience research on understanding complex brain functions6, we have developed a novel data-driven approach to comprehensively characterize the relationship between MRI parameters and myelin using co-registered MRI and myelin histology. The results demonstrated that MP-MRI is necessary to sensitively detect myelin and normal myelination in the mouse brain. Our study has limitations: 1) the networks were based on ex vivo mouse data and may not apply to in vivo data due to the differences between in vivo and ex vivo MRI signals; 2) data from cases with complex neuropathology are not present in the training dataset, which may limit the applicability of the technique for such cases.Acknowledgements
No acknowledgement found.References
1 Mancini, M. et al. An interactive meta-analysis of MRI biomarkers of myelin. Elife 9 (2020). https://doi.org:10.7554/eLife.61523
2 Liang, Z. et al. Virtual mouse brain histology from multi-contrast MRI via deep learning. Elife 11 (2022). https://doi.org:10.7554/eLife.72331
3 Hughes, E. G., Orthmann-Murphy, J. L., Langseth, A. J. & Bergles, D. E. Myelin remodeling through experience-dependent oligodendrogenesis in the adult somatosensory cortex. Nat Neurosci 21, 696-706 (2018). https://doi.org:10.1038/s41593-018-0121-5
4 Helms, G., Dathe, H., Kallenberg, K. & Dechent, P. High-resolution maps of magnetization transfer with inherent correction for RF inhomogeneity and T1 relaxation obtained from 3D FLASH MRI. Magn Reson Med 60, 1396-1407 (2008). https://doi.org:10.1002/mrm.21732
5 Belkina, A. C. et al. Automated optimized parameters for T-distributed stochastic neighbor embedding improve visualization and analysis of large datasets. Nat Commun 10, 5415 (2019). https://doi.org:10.1038/s41467-019-13055-y
6 Duncker, L. & Sahani, M. Dynamics on the manifold: Identifying computational dynamical activity from neural population recordings. Curr Opin Neurobiol 70, 163-170 (2021). https://doi.org:10.1016/j.conb.2021.10.014
Figures