3666
Quantification of 1H-MRSI metabolites in mild traumatic brain injury using relaxation correction from MRF1Bernard and Irene Schwartz Center for Biomedical Imaging, Department of Radiology, New York University Grossman School of Medicine, New York, NY, United States, 2Center for Advanced Imaging Innovation and Research (CAI2R), Department of Radiology, New York University Grossman School of Medicine, New York, NY, United States, 3Vilcek Institute of Graduate Biomedical Sciences, New York University Grossman School of Medicine, New York, NY, United States, 4Department of Neurology, New York University Grossman School of Medicine, New York, NY, United States, 5Department of Radiology, Hôpital Cochin, Paris, France, 6Department of Radiology, University of Miami Miller School of Medicine, Miami, FL, United States, 7Siemens Medical Solutions USA Inc., Malvern, PA, United States, 8Department of Rehabilitation Medicine, New York University Grossman School of Medicine, New York, NY, United States, 9Department of Psychiatry, New York University Grossman School of Medicine, New York, NY, United States, 10Ronald O. Perelman Department of Emergency Medicine, New York University Grossman School of Medicine, New York, NY, United States
Synopsis
Keywords: Multi-Contrast, Spectroscopy, White Matter, MR Fingerprinting, Relaxometry
Motivation: Accurate 1H-MRS metabolite quantification requires adjustments for metabolite and water signal relaxation, which are challenging to measure.
Goal(s): Our goal was to examine whether an MRF-based correction of subject-specific water relaxation times, applied to patients with mild traumatic brain injury (mTBI), yields results and effect sizes comparable with a conventional literature-based correction approach that utilizes one set of relaxation times for all subjects.
Approach: MRF and 1H-MRSI were acquired in 21 mTBI patients and 20 age-matched controls for quantification of metabolite concentrations in six white matter regions.
Results: Both methods yielded similar findings with comparable effect sizes across all metabolites in all regions.
Impact: In the context of intermediate TR and short TE, the standard absolute quantification method based on one literature-derived set of water relaxation times for all subjects may be appropriate for studying white matter metabolism in mild traumatic brain injury.
Introduction
In proton magnetic resonance spectroscopy (1H-MRS) studies of clinical populations, deriving absolute metabolite concentrations enables a straightforward interpretation of results1, and is useful for making comparisons with data collected across experimental conditions2. Absolute quantification is challenging, however, in part because it requires additional measurements of metabolite and tissue water longitudinal (T1) and transverse (T2) relaxation times3 using lengthy conventional relaxometry techniques4. While population-averaged literature values can be substituted to obtain quantitative results5, this standard approach relies on the unsubstantiated assumption that microstructural properties such as molecular motion (T1) and proton-proton interactions (T2)4 are unaltered with age, sex, anatomical region, and pathology3. Fortunately, quantitative relaxometry has become clinically feasible with MR fingerprinting (MRF)6, which can simultaneously measure multiple tissue parameters within a single acquisition. We therefore applied MRF-based correction of water relaxation times to the quantification of metabolite levels within the white matter (WM) of patients with mild traumatic brain injury (mTBI) and their matched controls7. We compared the results and effect sizes obtained with this method to those obtained with the conventional method of using one set of literature-derived water relaxation times for all subjects. Additionally, we investigated whether, in patients, the MRF-based correction method delivers stronger relationships between metabolite levels and clinical outcome.Materials and Methods
Clinical, MRF, and 1H-MRSI data from 21 mTBI patients and 20 age-, sex-, and education-matched controls were acquired at 3T (MAGNETOM Prisma, Siemens Healthcare, Erlangen, Germany) with a 20-channel transmit-receive head coil (Table 1A). Six WM regions commonly implicated in TBI were manually segmented over each subject’s MPRAGE, which was used to register their reconstructed MRF and 1H-MRSI maps (Figure 1). After data processing and quality control7,8, voxel averaged T1, T2, and metabolite areas were obtained from each region, including choline (Cho), creatine (Cr), glutamate-plus-glutamine (Glx), myo-inositol (mI), and N-acetylaspartate (NAA). The unsuppressed tissue water signal was measured to serve as an internal reference for both quantification methods.MRF-Based Quantification: Regional metabolite signals were normalized to the MRF-corrected water signal, which accounted for fractional T1 and T2 relaxation within cerebrospinal fluid (CSF), gray matter (GM), and WM, and then scaled by the fractional water concentration within each tissue type, as done in Gajdošík et al.9, to yield millimolar (mM) concentrations.
Standard Quantification: Regional metabolite signals were normalized to the water signal, which was adjusted for tissue water T1 relaxation using one set of values from literature10,11 (CSF=4300 ms; GM=1350 ms; WM=840 ms), to yield metabolite levels in institutional units.
Patients’ functional outcomes were measured by the Glasgow Outcome Scale Extended (GOSE)12, and dichotomized into “recovered” (GOSE=8) and “non-recovered” (GOSE≤7) subgroups. Mann-Whitney U tests were used to compare regional mean metabolite concentrations for all patients vs. controls, and non-recovered patients vs. controls. Coefficients of variation (CVs), percent differences, and effect sizes (Cohen’s d) were obtained and compared with those reported previously7. Statistical significance was defined as p < 0.05.
Results
Demographics and clinical characteristics are compiled in Table 1B. We observed no remarkable changes in CVs or effect sizes (paired t-test, p = 0.07) when comparing metabolite levels calculated from the current study’s MRF-based quantification with the previous study’s literature-based quantification (Table 2). Magnitudes of effect were moderately correlated between methods (Spearman's R = 0.48, **p < 0.01) (Figure 2). Both methods demonstrated higher corona radiata Glx (d ≥ 0.8, **p < 0.01) in patients vs. controls; higher frontal WM Cho (d > 0.5, *p < 0.05) and higher corona radiata Glx (d ≥ 0.8, **p < 0.01), in non-recovered patients vs. controls (Figure 3).Discussion
The theoretically higher accuracy of absolute quantification, expected when using MRF-derived water relaxation times, did not meaningfully change the results obtained with conventional quantification in the context of intermediate TR (1.7 s) and short TE (18 ms). Therefore, using the standard method of one literature-derived set of water relaxation times for all subjects may be appropriate for the described application of studying WM metabolism in mTBI.Reasons for this finding include the short TE of the 1H-MRSI sequence, which minimizes the T2 error, and our previous findings8 of (i) low T1 or T2 CVs within the patient and control groups (all ~4%), suggesting low heterogeneity in individual relaxation times; (ii) no group differences in T1 or T2 (within the same regions) between the patients and controls studied here.
Because our previous report also found that WM T1 was a strong predictor of patients’ functional recovery at 3-months post-injury8, future work will investigate whether combining MRF-derived relaxation times with 1H-MRSI metabolite concentrations will yield stronger associations with future clinical outcome than any measure alone.
Acknowledgements
This work was supported by grants R01NS097494 and R01EB026456 from the National Institutes of Health (NIH).References
1 Hoch, S. E., Kirov, II & Tal, A. When are metabolic ratios superior to absolute quantification? A statistical analysis. NMR Biomed 30 (2017). https://doi.org:10.1002/nbm.3710
2 Jansen, J. F., Backes, W. H., Nicolay, K. & Kooi, M. E. 1H MR spectroscopy of the brain: absolute quantification of metabolites. Radiology 240, 318-332 (2006). https://doi.org:10.1148/radiol.2402050314
3 Gasparovic, C. et al. Use of tissue water as a concentration reference for proton spectroscopic imaging. Magn Reson Med 55, 1219-1226 (2006). https://doi.org:10.1002/mrm.20901
4 Deoni, S. C. Quantitative relaxometry of the brain. Top Magn Reson Imaging 21, 101-113 (2010). https://doi.org:10.1097/RMR.0b013e31821e56d8
5 Kulpanovich, A. & Tal, A. The application of magnetic resonance fingerprinting to single voxel proton spectroscopy. NMR Biomed 31, e4001 (2018). https://doi.org:10.1002/nbm.4001
6 Ma, D. et al. Magnetic resonance fingerprinting. Nature 495, 187-192 (2013). https://doi.org:10.1038/nature11971
7 Chen, A. M. et al. Replicability of proton MR spectroscopic imaging findings in mild traumatic brain injury: Implications for clinical applications. Neuroimage Clin 37, 103325 (2023). https://doi.org:10.1016/j.nicl.2023.103325
8 Gerhalter, T. et al. T1 and T2 quantification using magnetic resonance fingerprinting in mild traumatic brain injury. Eur Radiol (2021). https://doi.org:10.1007/s00330-021-08235-8
9 Gajdosik, M. et al. Hippocampal single-voxel MR spectroscopy with a long echo time at 3 T using semi-LASER sequence. NMR Biomed 34, e4538 (2021). https://doi.org:10.1002/nbm.4538
10 Wansapura, J. P., Holland, S. K., Dunn, R. S. & Ball, W. S., Jr. NMR relaxation times in the human brain at 3.0 tesla. J Magn Reson Imaging 9, 531-538 (1999). https://doi.org:10.1002/(sici)1522-2586(199904)9:4<531::aid-jmri4>3.0.co;2-l
11 Lu, H. et al. Routine clinical brain MRI sequences for use at 3.0 Tesla. J Magn Reson Imaging 22, 13-22 (2005). https://doi.org:10.1002/jmri.20356
12 Wilson, J. T., Pettigrew, L. E. & Teasdale, G. M. Structured interviews for the Glasgow Outcome Scale and the extended Glasgow Outcome Scale: guidelines for their use. J Neurotrauma 15, 573-585 (1998). https://doi.org:10.1089/neu.1998.15.573
13 Cloos, M. A. et al. Rapid Radial T1 and T2 Mapping of the Hip Articular Cartilage With Magnetic Resonance Fingerprinting. J Magn Reson Imaging 50, 810-815 (2019). https://doi.org:10.1002/jmri.26615
14 Ding, X. Q. et al. Reproducibility and reliability of short-TE whole-brain MR spectroscopic imaging of human brain at 3T. Magn Reson Med 73, 921-928 (2015). https://doi.org:10.1002/mrm.25208
15 Rusinek, H. et al. Fully automatic segmentation of white matter lesions: error analysis and validation of a new tool. Int J Comput Assist Radiol Surg 8, 289-291 (2013).
Figures
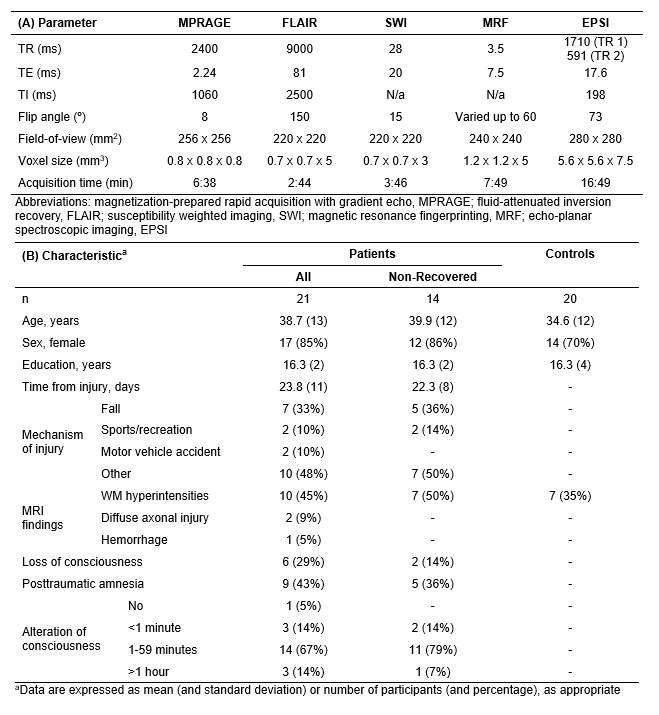
Table 1. Imaging parameters are presented in (A). The protocol included T1-weighted MPRAGE, T2-weighted FLAIR, and SWI sequences for spatial registration and clinical review, an MRF sequence13 for multiparametric mapping, and an EPSI prototype sequence14 for metabolite data acquisition. Subject characteristics are presented in (B). Subjects were further categorized as “non-recovered” based on a subjective assessment of daily functioning after injury, defined as a score of ≤ 7 on the Glasgow Outcome Scale Extended (GOSE).
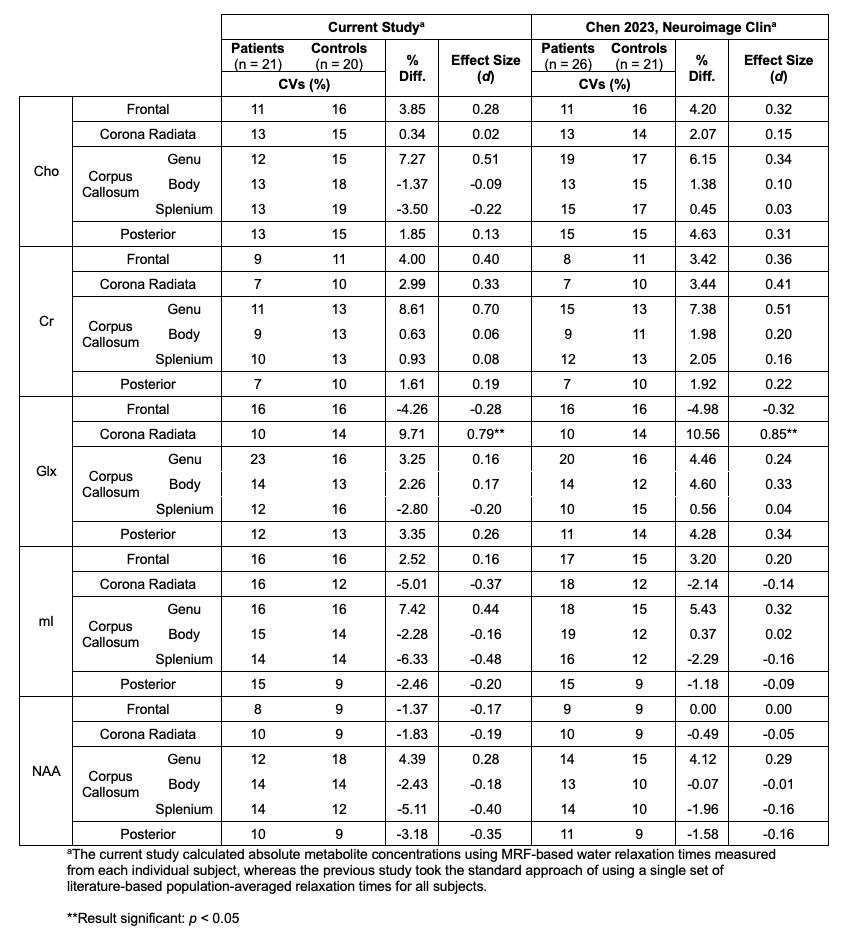
Table 2. Coefficients of variation (CVs), percent differences, and effect sizes (Cohen’s d) of regional white matter metabolite levels in patients with mild traumatic brain injury vs. their matched healthy controls, from the current study and previous work7. Of note, a paired t-test comparison of absolute effect sizes (i.e., their magnitudes) yielded a non-significant result (p = 0.073; MRF-based quantification, d = 0.28 ± 0.2 [mean ± standard deviation]; standard quantification: d = 0.23 ± 0.2).
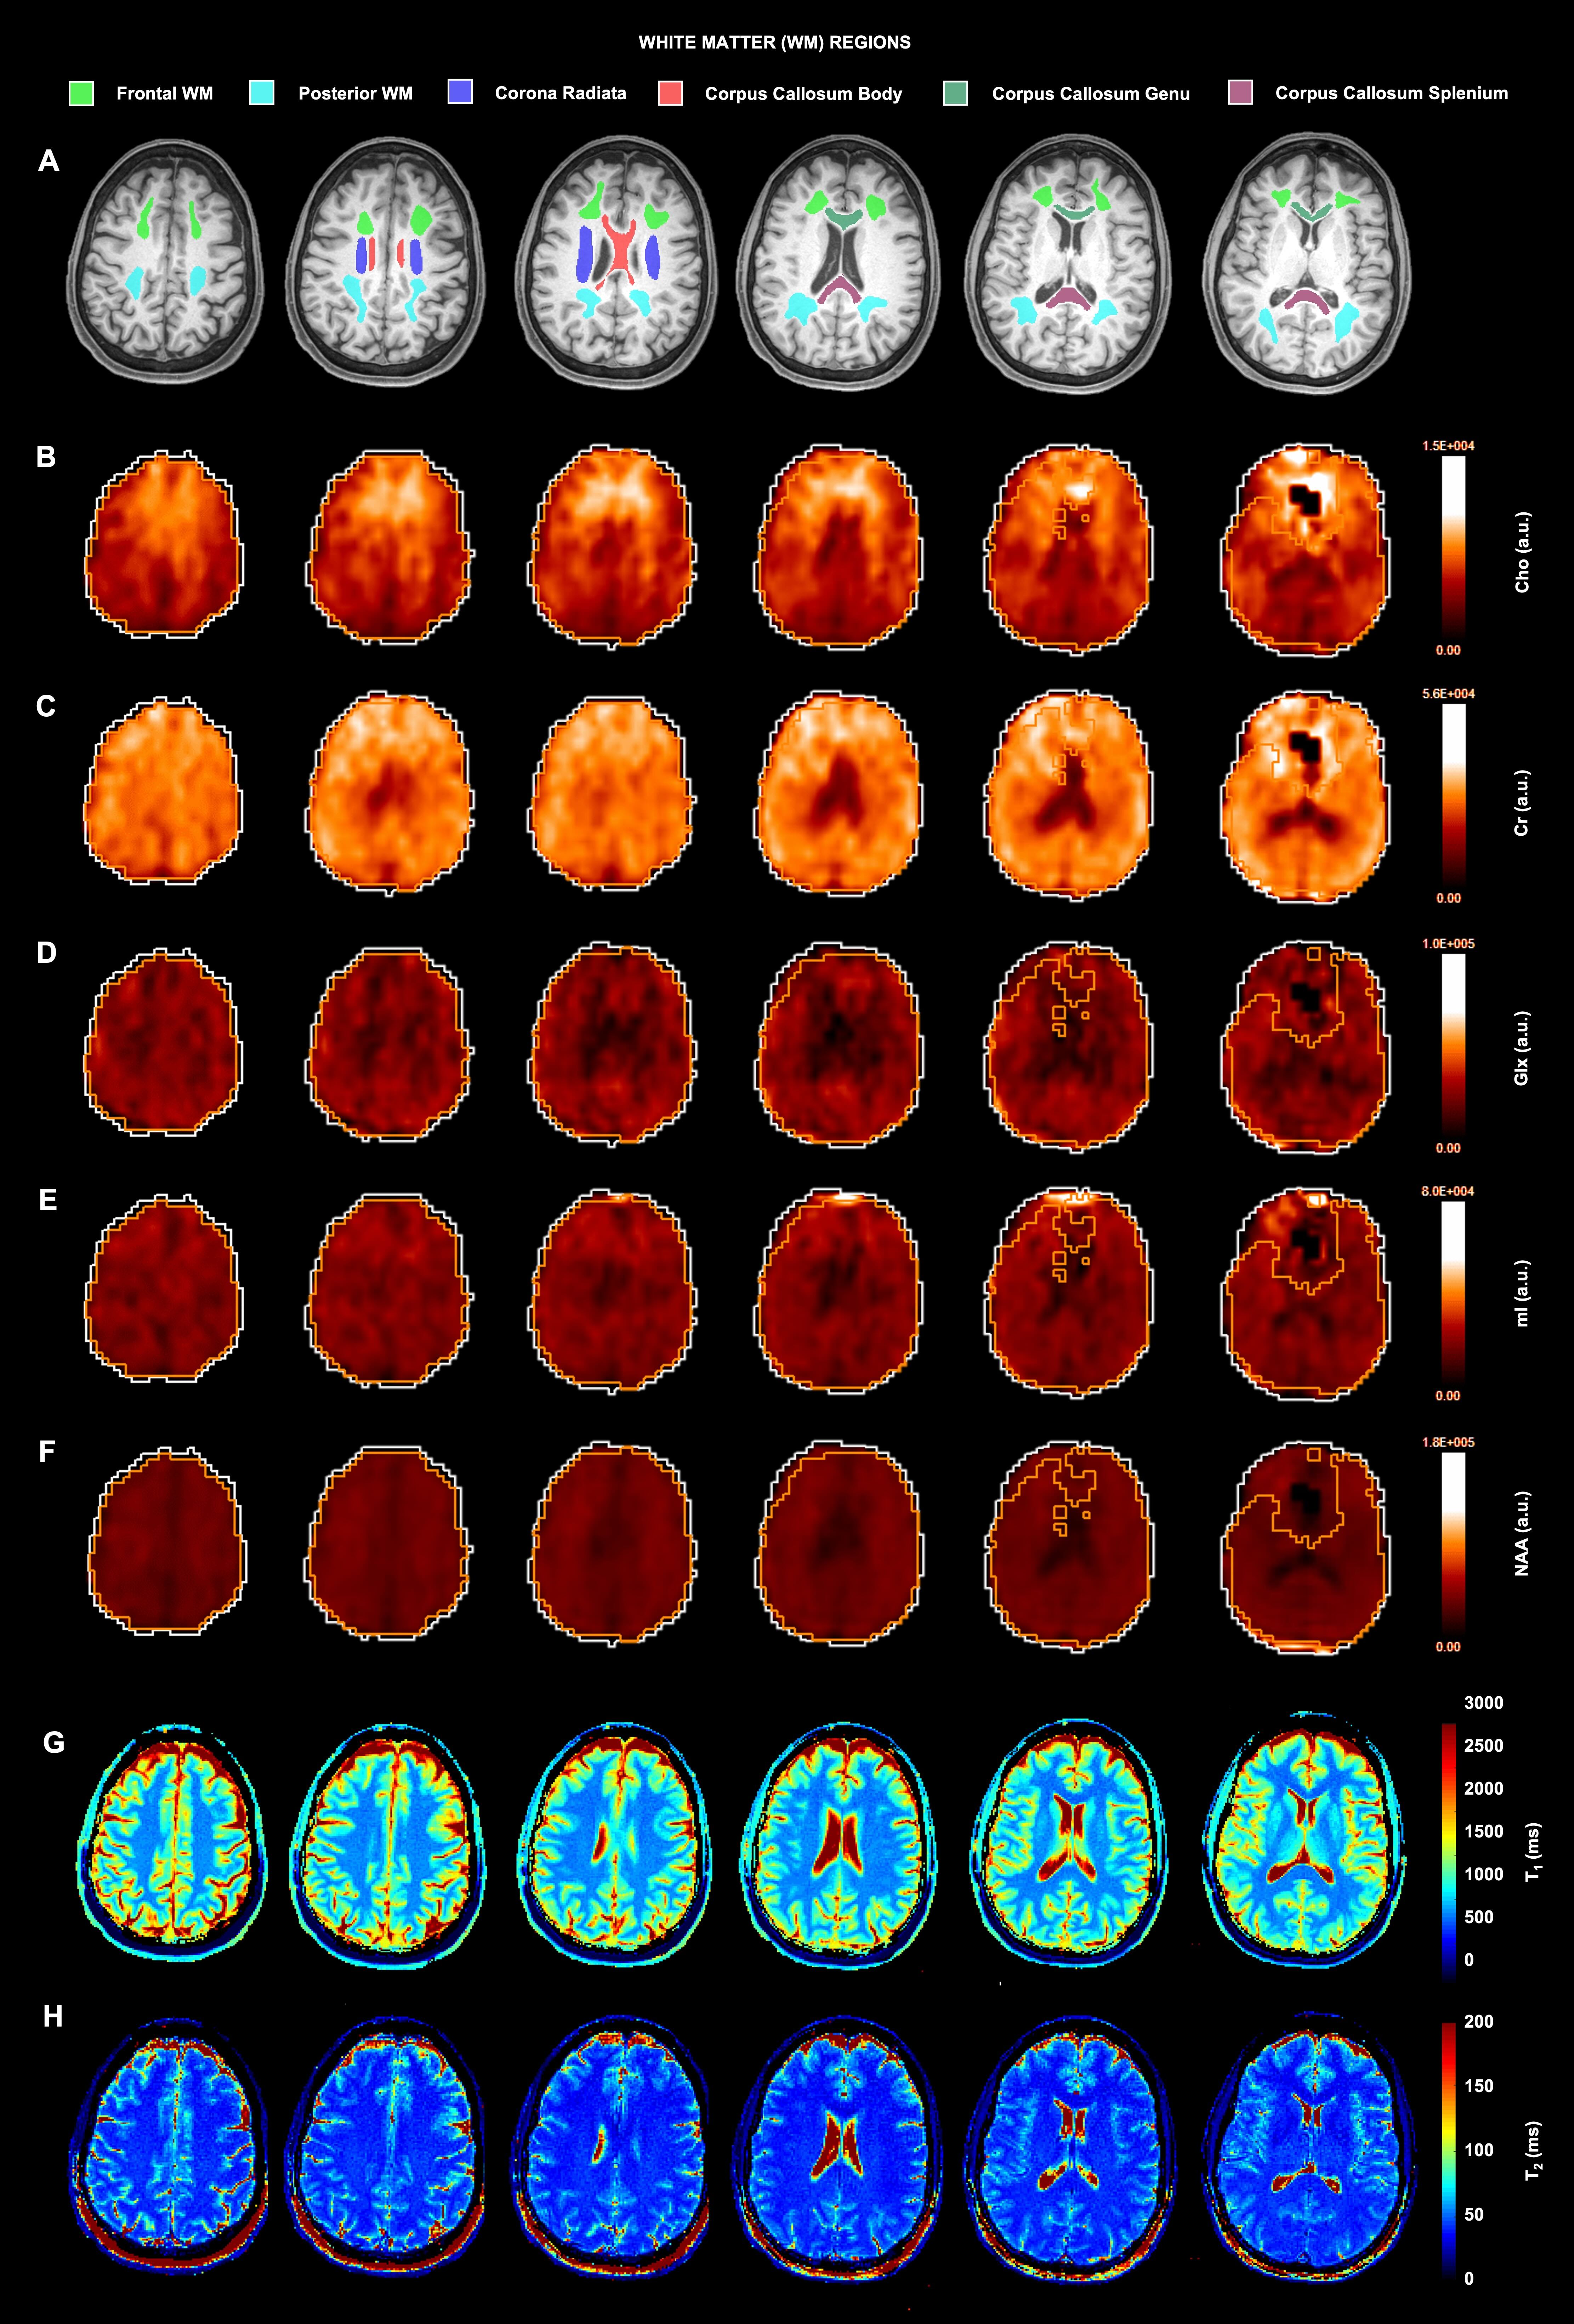
Figure 1. (A) MPRAGE images overlaid with the six white matter regions that were manually segmented using FireVoxel15. Outlined regions were individually registered to the 1H-MRSI-derived (B-F) metabolite maps in MIDAS, and to the MRF-derived (G) T1 and (H) T2 maps in SPM12 (https://www.fil.ion.ucl.ac.uk/spm/). Overlaid on each metabolite map are outlines of the brain mask (white) and quality map (orange), which defined voxels with metabolite linewidth <12 Hz and signal <3 standard deviations from the mean. Voxels outside of the quality map were excluded from the analysis.
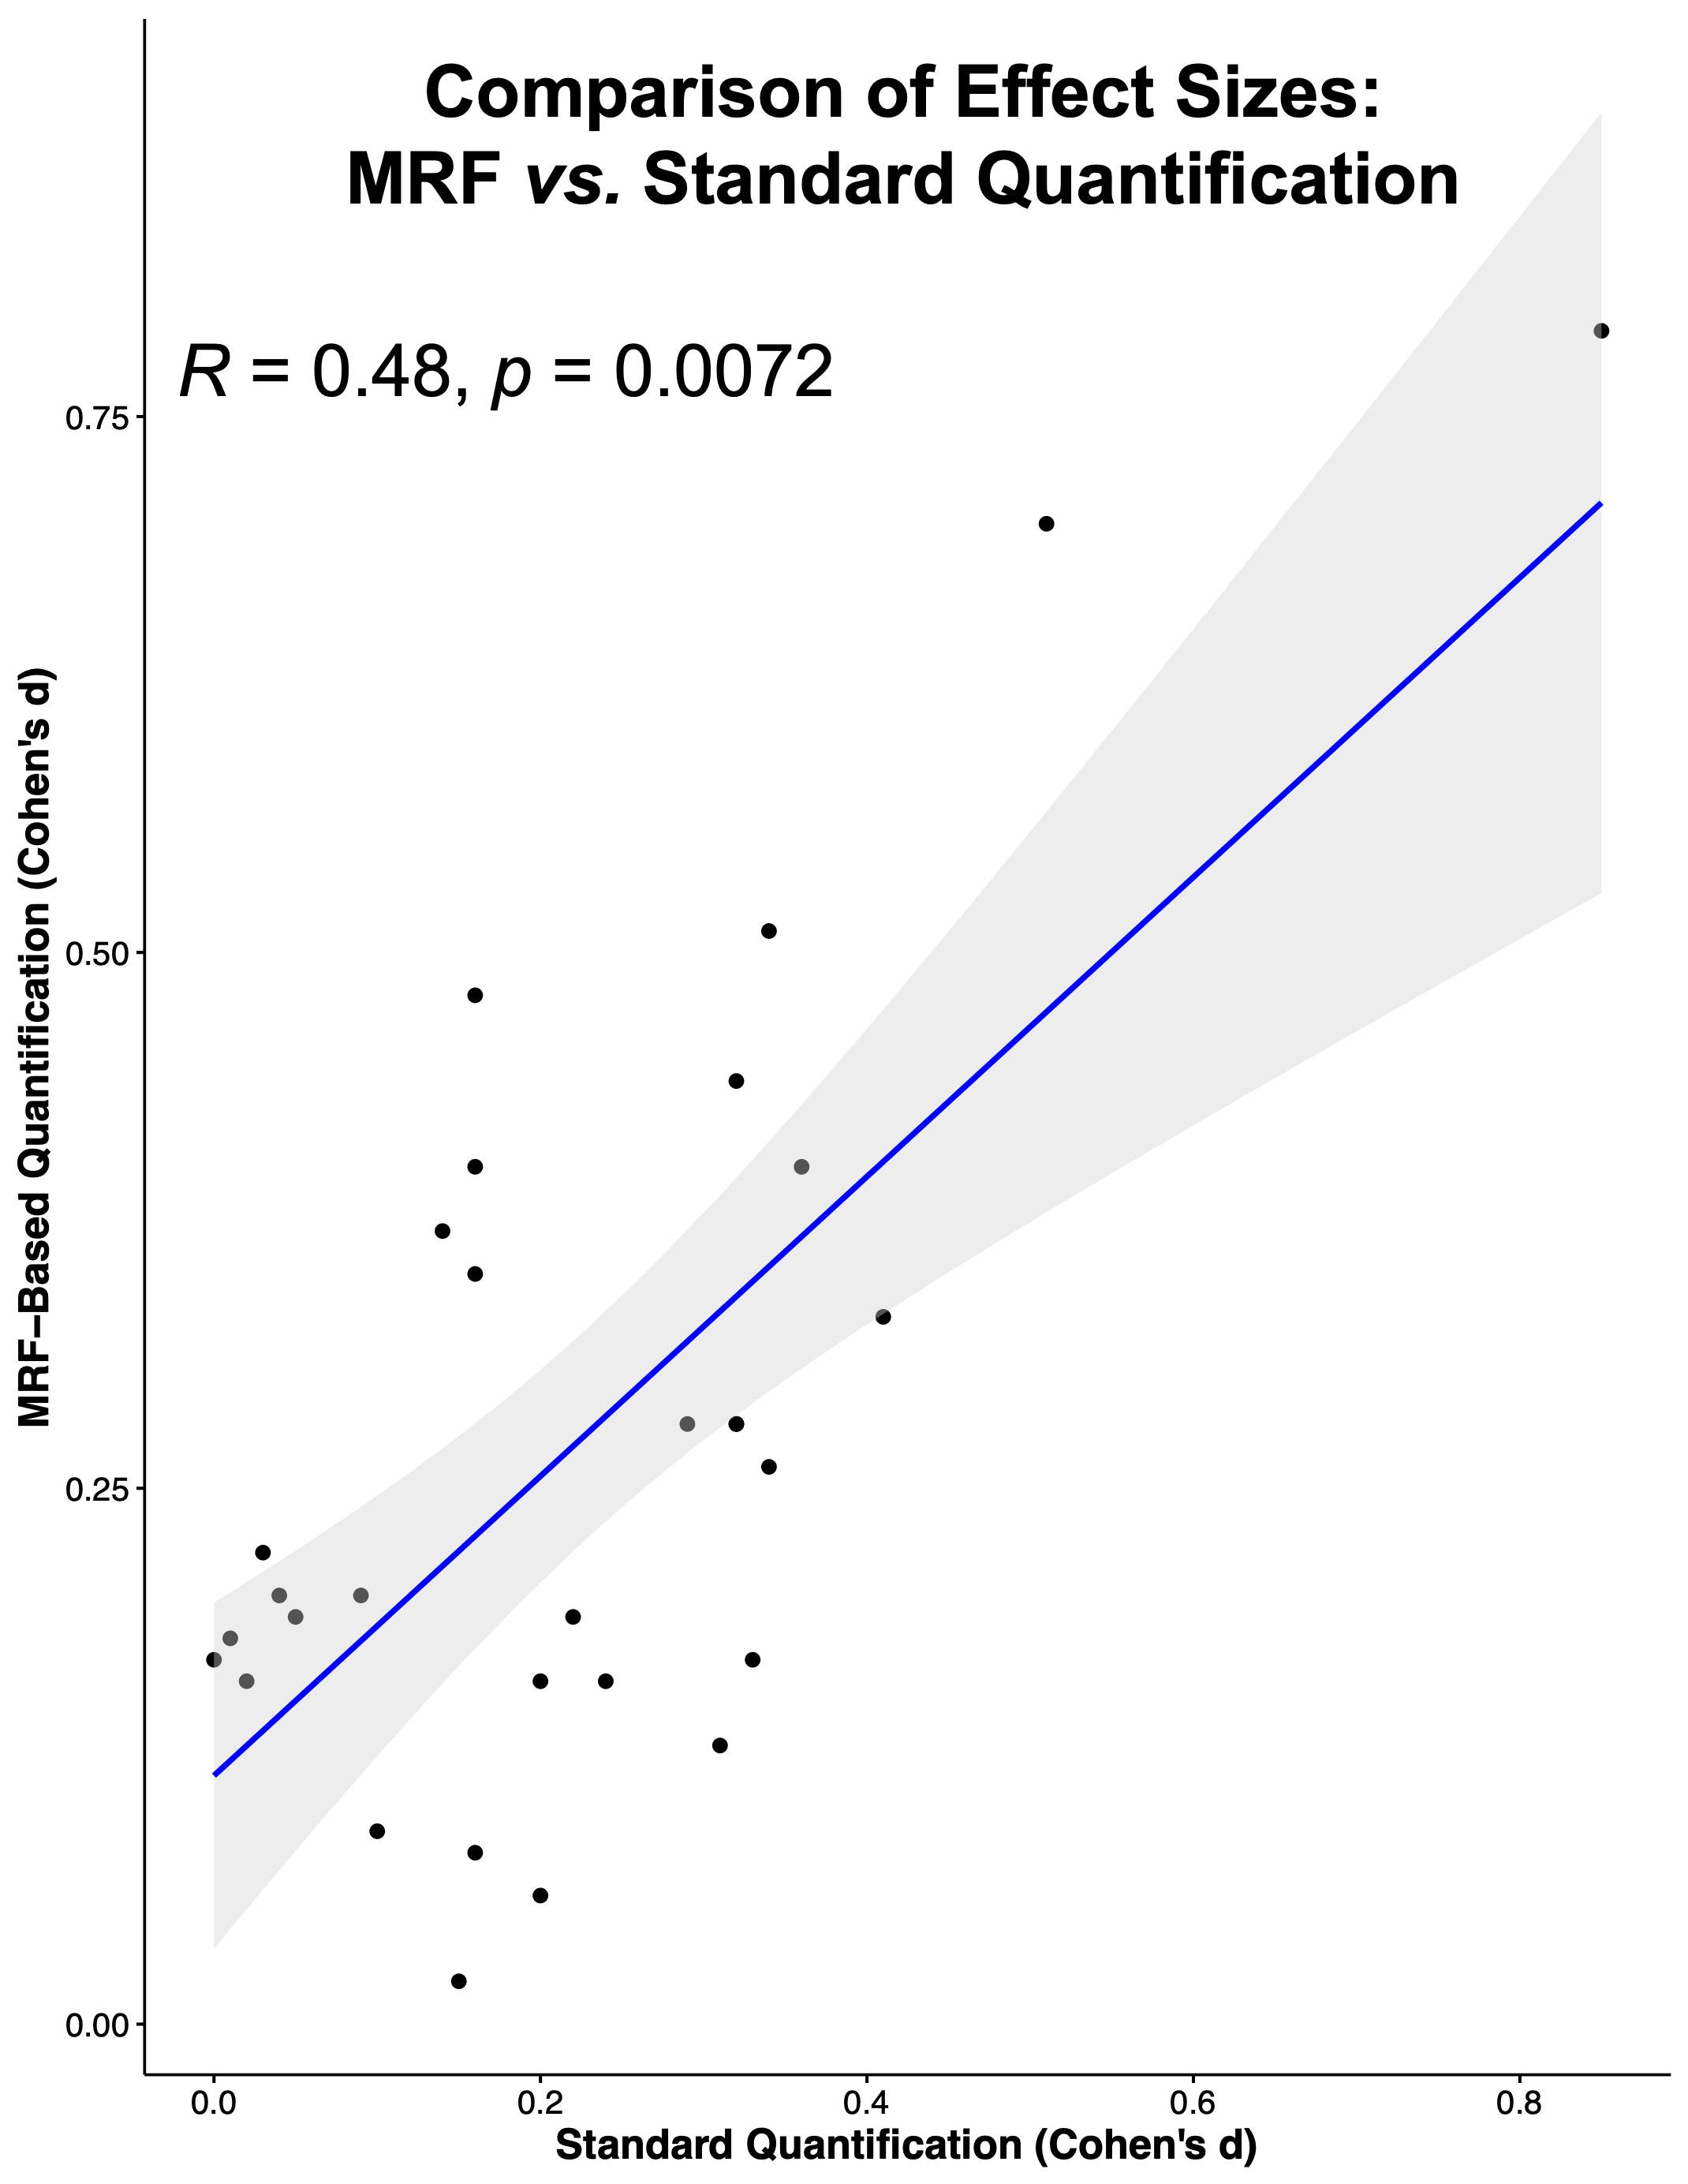
Figure 2. A significant Spearman correlation (R = 0.48, p = 0.0072) was found for the association between magnitudes of effect sizes (Cohen's d) derived from MRF-based and standard metabolite quantification approaches.
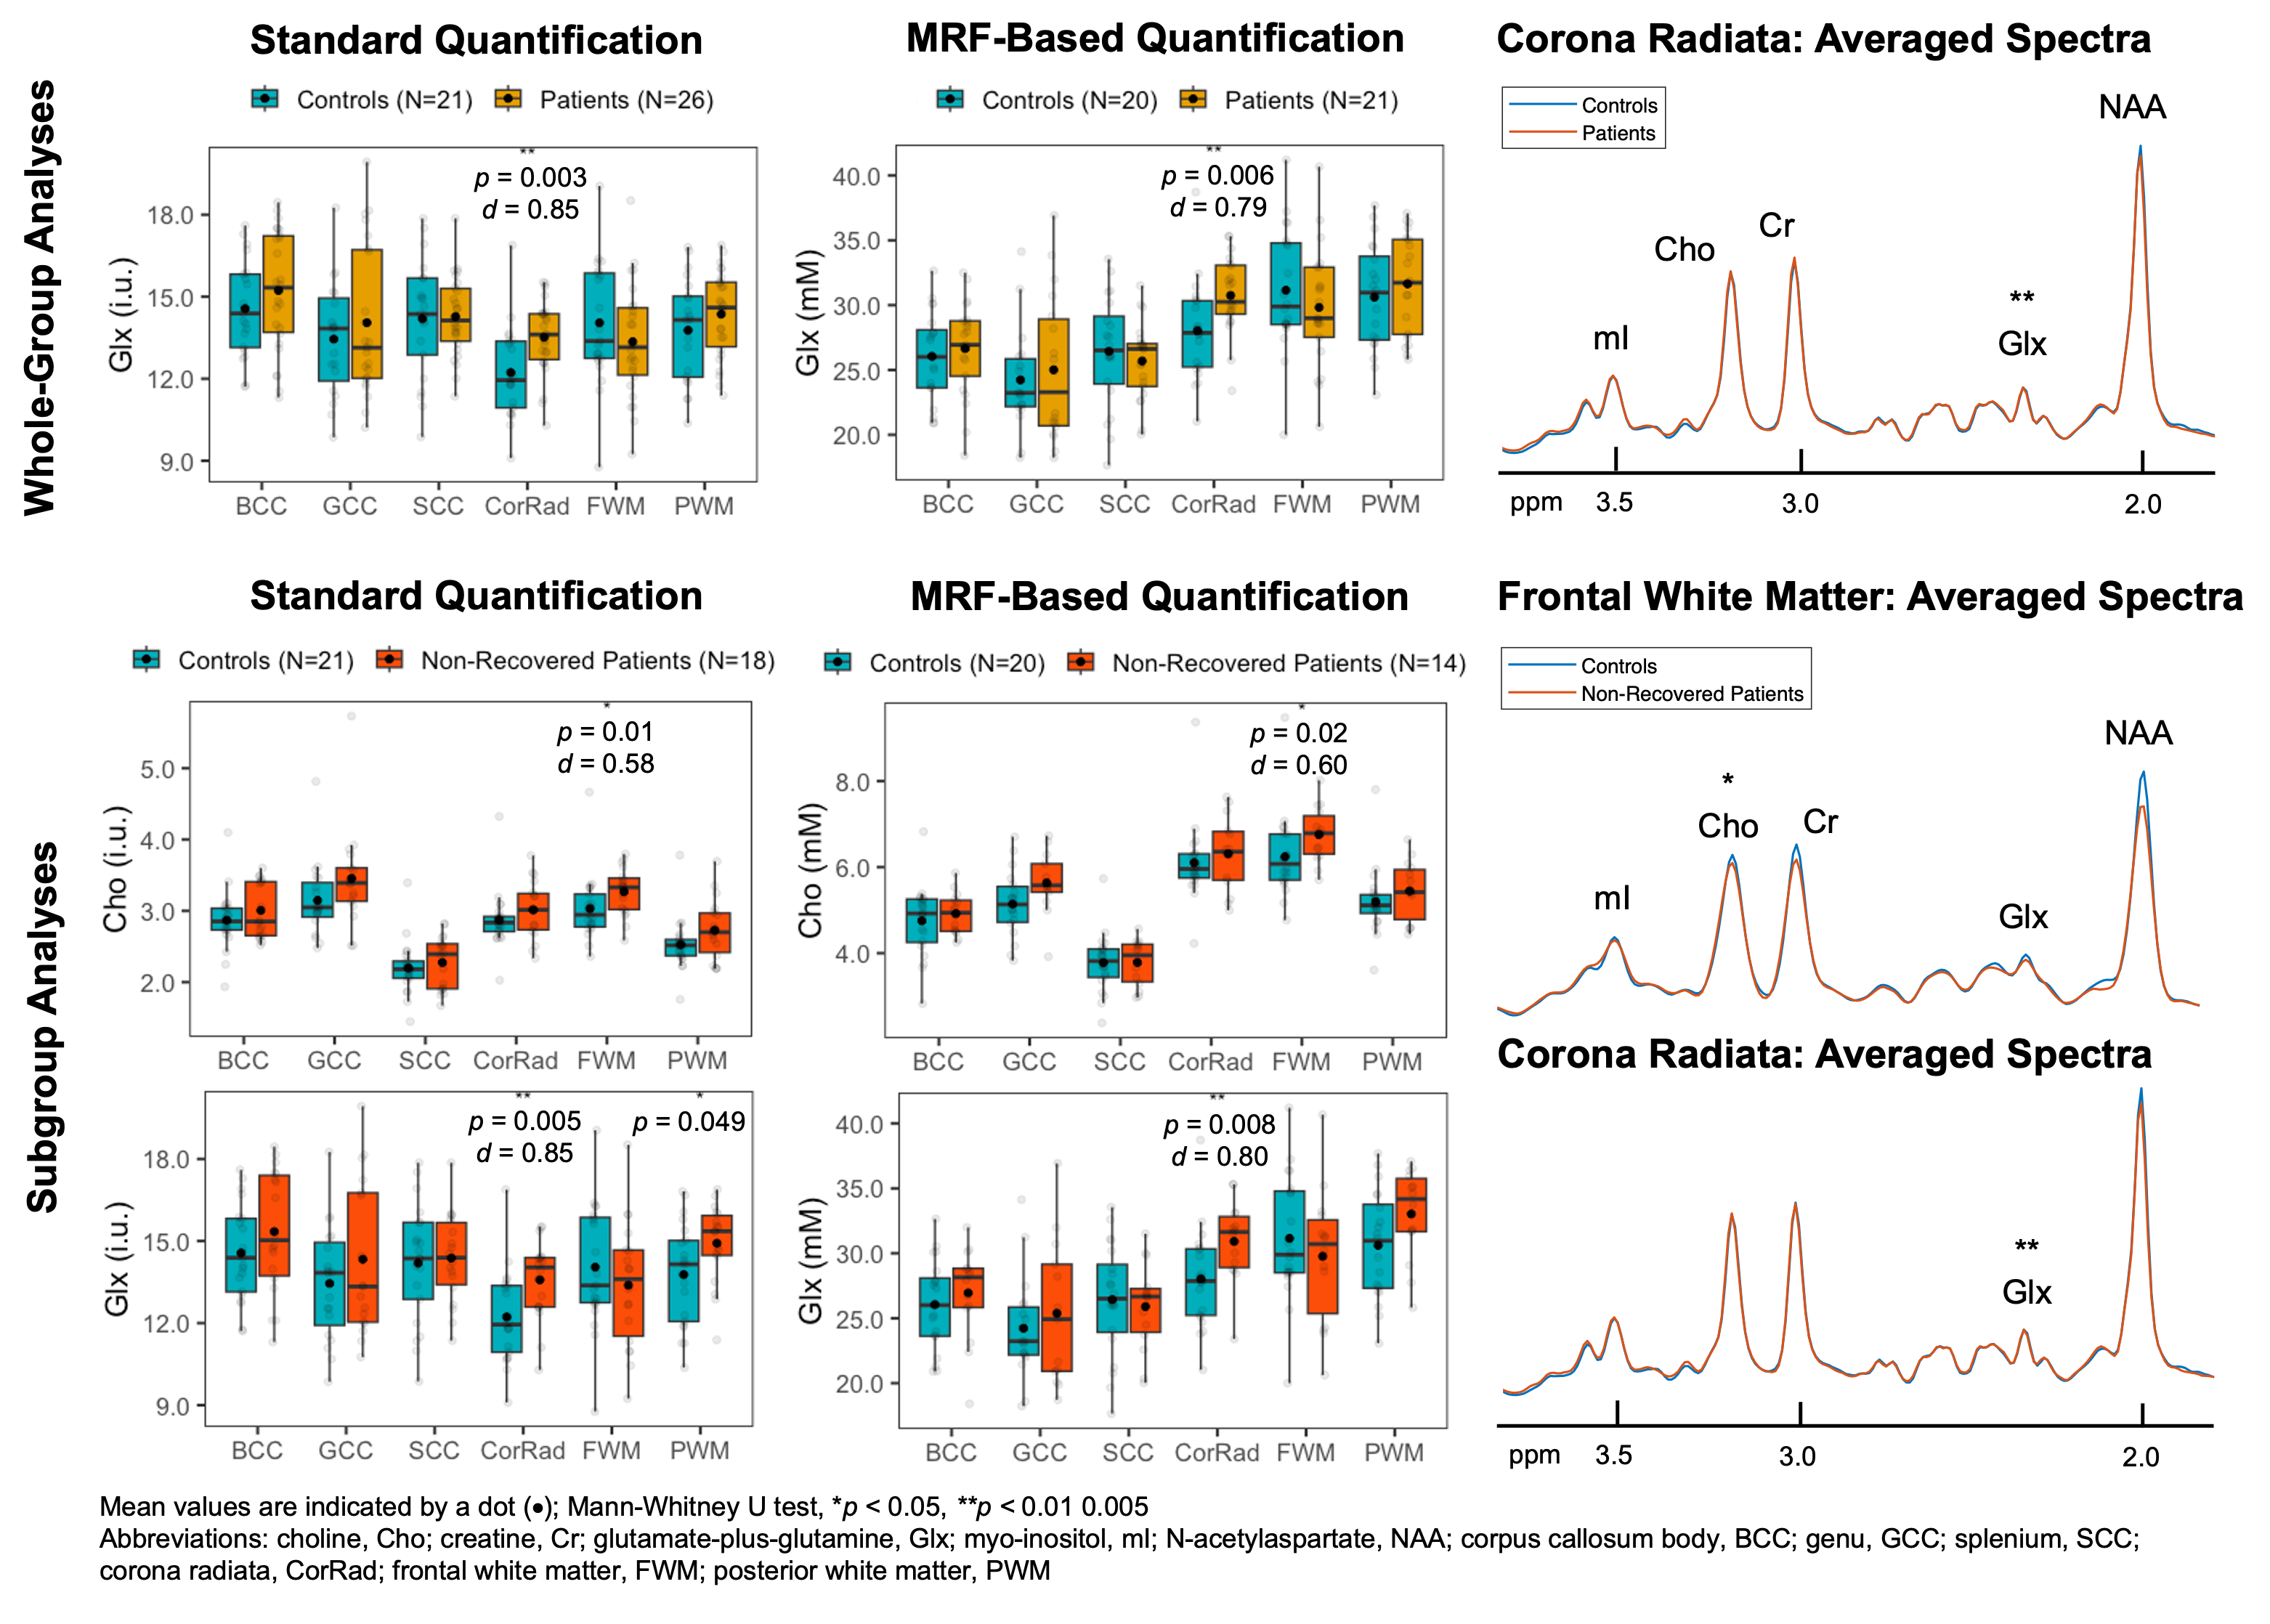
Figure 3. Boxplots of select metabolite distributions in all (Whole-Group Analyses) and non-recovered (Subgroup Analyses) mTBI patients vs. matched controls, across all white matter regions. Note that significant results in Standard Quantification (left) were also significant in MRF-Based Quantification (middle), with comparable effect sizes (d). In patients, elevated CorRad Glx was observed following both analyses, whereas elevated FWM Cho was only observed following subgroup analyses. Averaged spectra were overlaid on the same frequency and intensity scales (right).