3664
Water-fat Separation for the knee on a 50 mT Portable MRI Scanner1School of Electrical Engineering, Chongqing University, Chongqing, China
Synopsis
Keywords: Fat & Fat/Water Separation, Low-Field MRI
Motivation: Bright fat signals in MR images can obscure the underlying details and affect the physician's diagnosis. Especially in ultra-low-field MRI (B0 < 100 mT), lower SNR images are more important to discern fat and water signals.
Goal(s): This study aims to achieve effective water-fat separation using the Dixon method at a 50 mT MR scanner.
Approach: R2* effect and priori information have been added to the existing two-point Dixon method.
Results: The images obtained on the 50 mT MRI scanner can clearly distinguish cartilage, muscle and fat compared to the water-fat separation images obtained on the 3T MRI scanner.
Impact: Phase errors in the acquired MR images were significantly reduced after using priori phantom phase images. This work demonstrates the successful application of the Dixon method to ULF MRI. Future studies will focus on reducing imaging time.
Introduction
In T1 weighted or T2 weighted MR images, fat tissue appears hyperintense. Bright fat signals can obscure the underlying details and affect the physician's diagnosis. In ultra-low-field MRI (ULF, B0 < 100 mT), lower SNR images are more important to discern fat and water signals. Currently, the most widely used method is based on frequency selection, which requires highly homogeneous B0 and B1 fields and is impractical to apply to ULF MRI. The STIR sequence suppresses tissues with T1 values similar to fat, and further loss of SNR. The Dixon method is often used in clinical and scientific research on fat suppression because it can eliminate the need for highly homogeneous B0 and B1 fields and maintain image SNR. However, there is limited literature on water fat separation in ULF MRI. Here, we present a modified two-point Dixon method specifically designed for ULF MRI.Methods
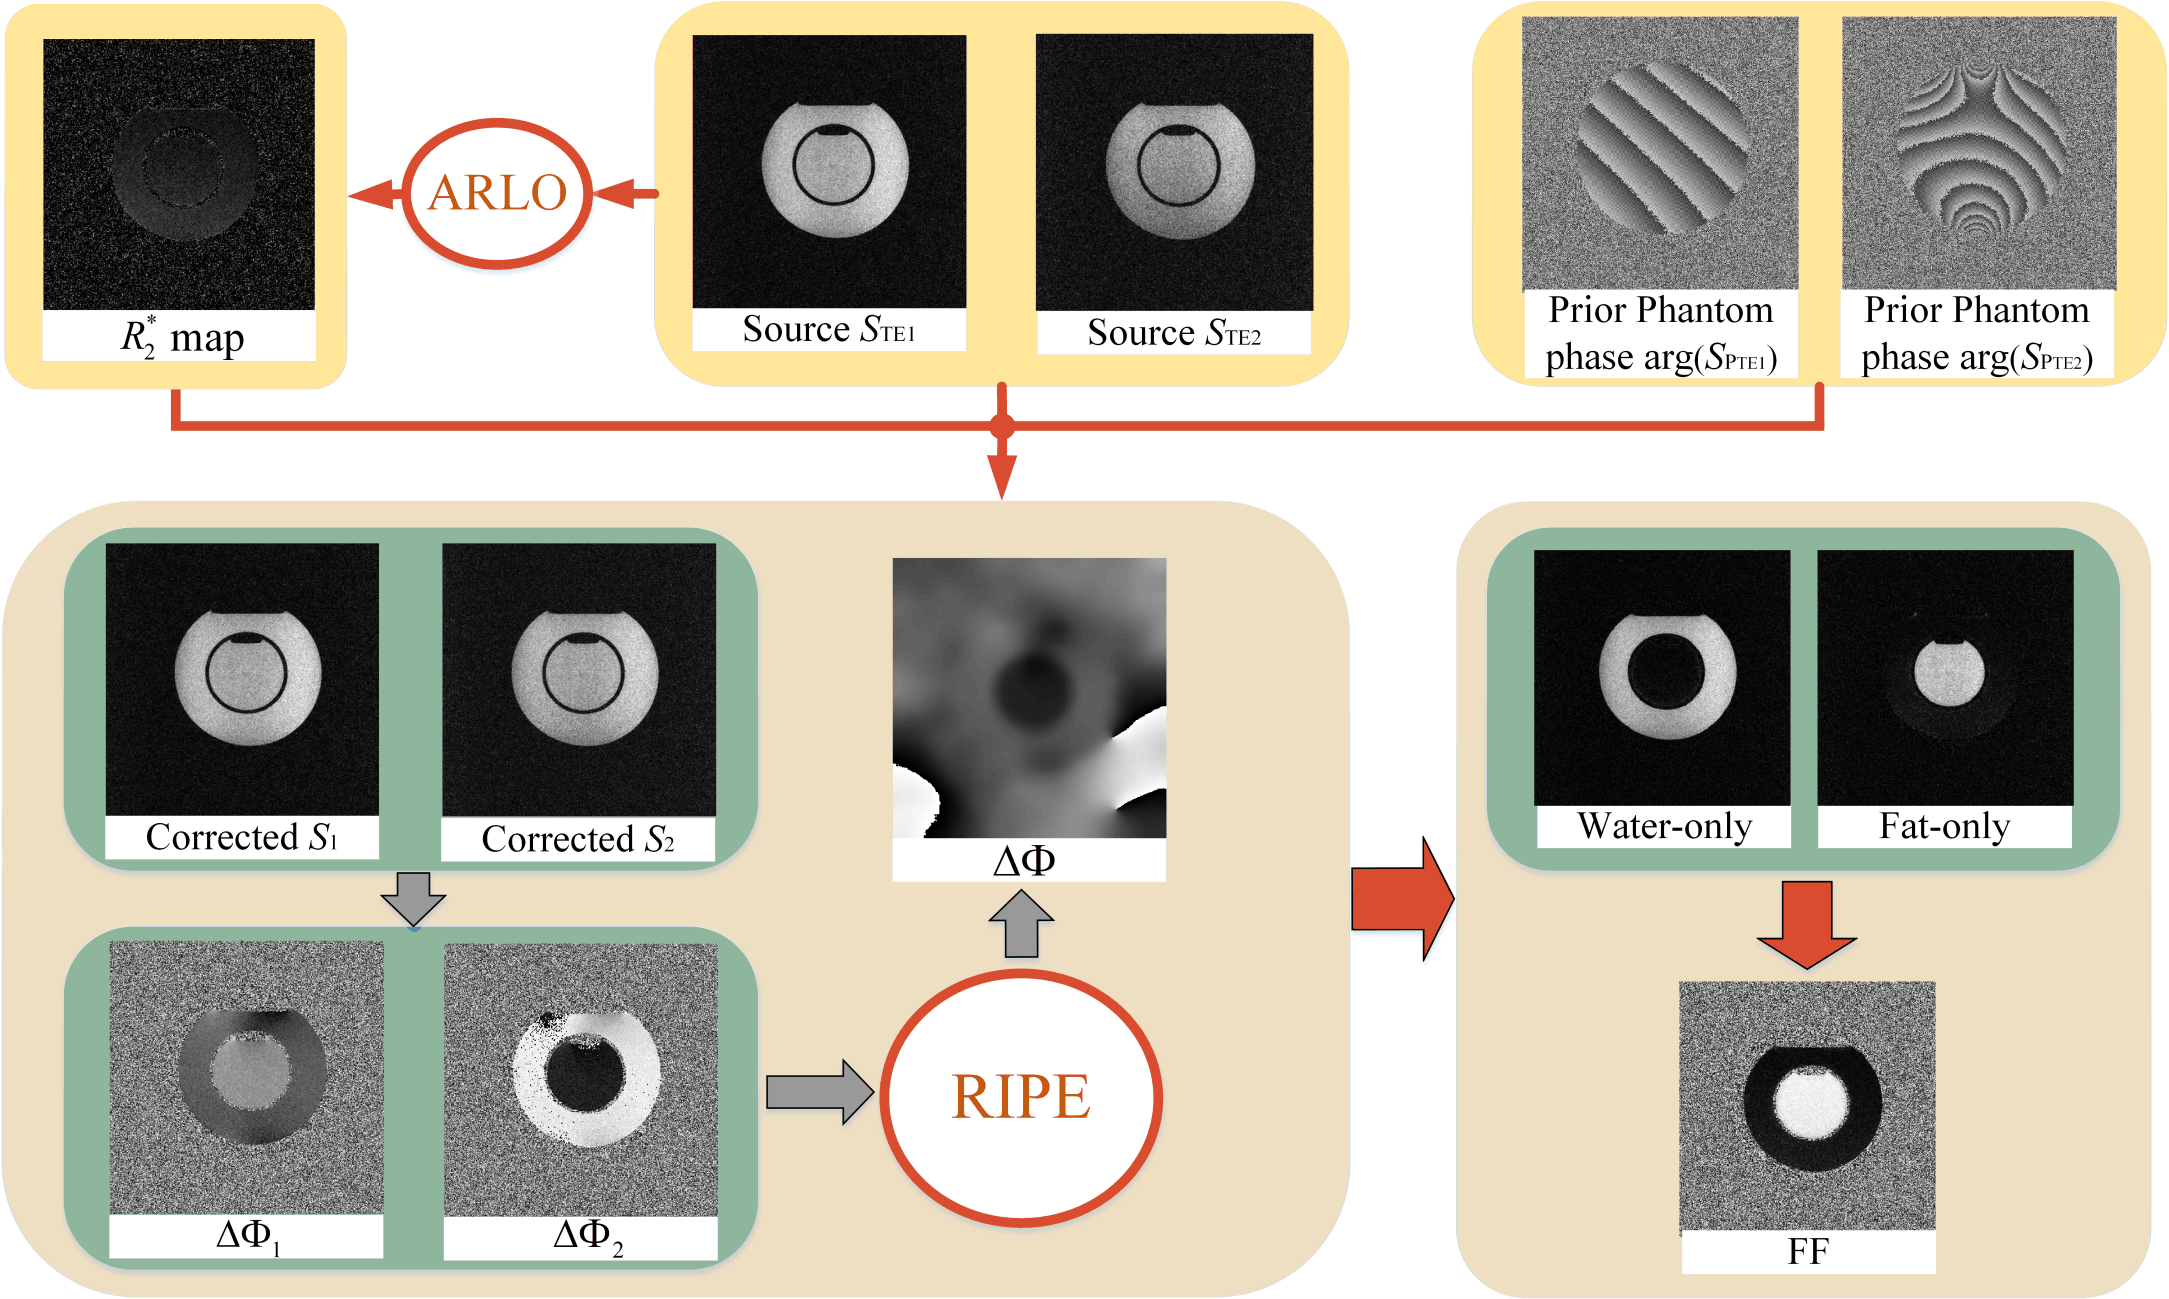
Method: As shown in Fig. 1, The priori phantom was first scanned to obtain phase images of the phantom at different TEs (SpTEn). Then, the sample is scanned to obtain the phase image of the sample at the same TE (STEn), and after 3 scans the R2* of the sample is obtained using auto-regression on the linear operations ( ARLO) algorithm1. Since the sample and the phantom are considered to be in the same magnetic field environment for a short period of time, the phase errors from physical sources are shared. Phase errors caused by physical sources are eliminated by operating from the image phase, performing Eq. 1. Next, the phase potential value, ΔΦn, is calculated and a phase value, ΔΦ, is selected using the Regional Iterative Phase Extraction (RIPE) method2. Finally, the water and fat signals for a given sample are estimated based on the composite signal, Sn, and the phasor ΔΦ. Imaging: Experiments were performed on a homemade 50 MT MRI scanner3 with a 3D-GRE sequence with parameters: TR/TE = 120/(24 ms, 64ms), receiver bandwidth = ±5 kHz, FOV = 240 mm, slice thickness = 4.2 mm, FA = 45°, and NA = 1. The two scanning times are approximately 18 minutes and 26 seconds. For comparisons, we performed knee imaging using a 3T MRI scanner (Siemens, MAGNETOM Prisma, Germany) with a TSE sequence with parameters: TR/TE = 570/(10.9 ms, 12ms), receiver bandwidth = ±320 kHz, FOV = 160 mm, slice thickness = 0.8 mm. The two scanning times are approximately 4 minutes and 50 seconds. Data processing: The modified two-point Dixon algorithm was implemented on the Matlab platform (Math Works R2020a, Natick, MA, USA) and uses the original data file saved on the scanner as its input. $$Sn=(|STEn|ei(arg(STEn)-arg(SpTEn)))·eTEnR2* (1).$$Results
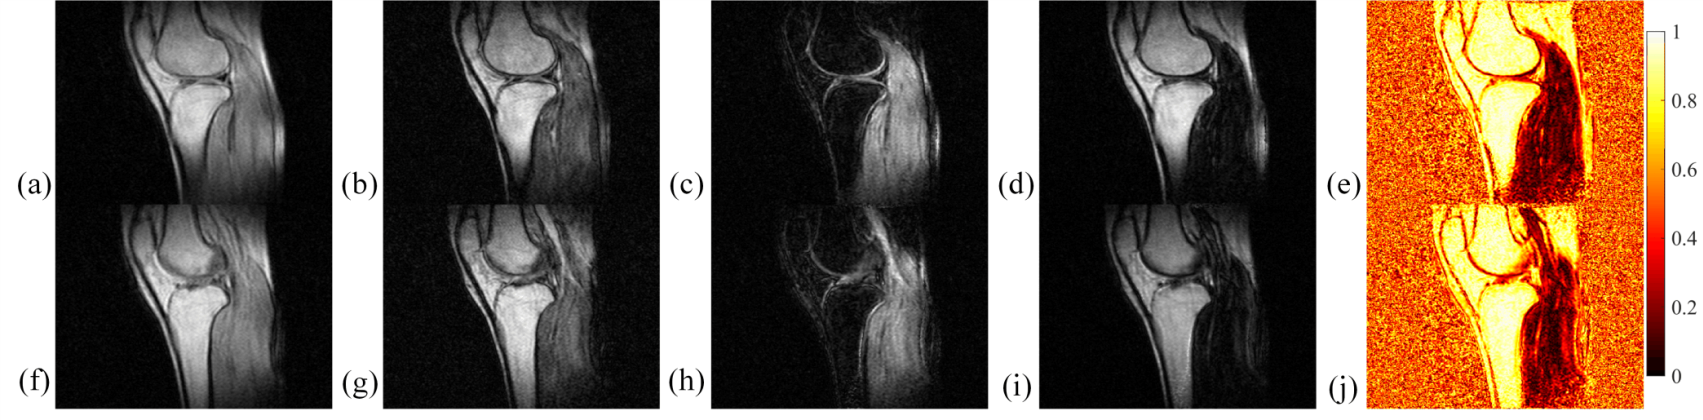
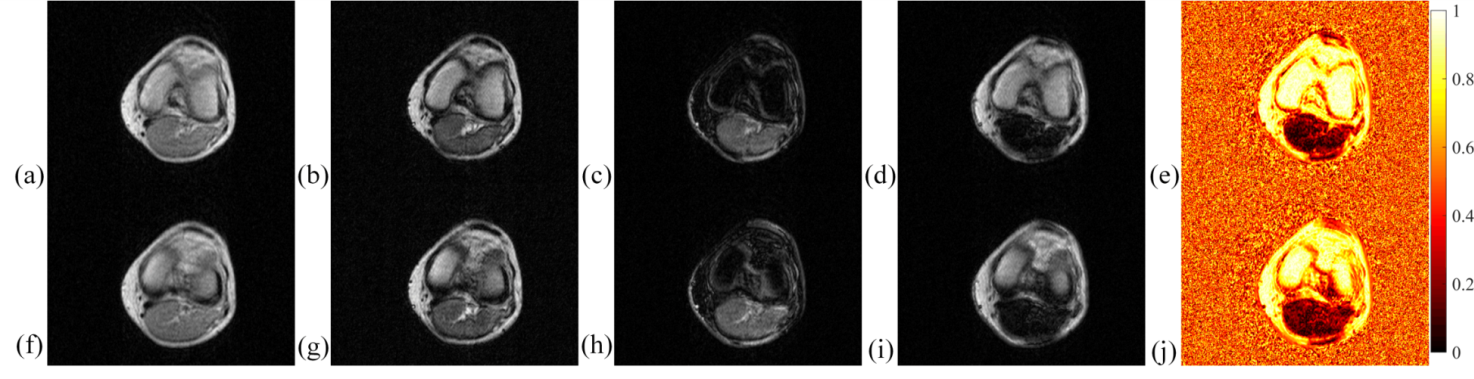
We scanned the knee of a healthy volunteer. Fig. 2 (sagittal plane) and Fig. 3 (transverse plane) show multislice water-fat separation images of the healthy volunteer knee at the 50 mT MRI scanner. Fig. 4 (sagittal plane) and Fig. 5 (transverse plane) show the magnitude and water-fat separation images acquired at the 3T MRI scanner. Fig. 4 and Fig. 5 were obtained using the two-point Dixon algorithm for water-fat separation that comes with the scanner. Compared with the water-only and fat-only images obtained by the 3T MRI scanner, it is acknowledged that the images obtained on the 50 mT MRI scanner had a lower SNR. However, we can clearly distinguish cartilage, muscle, and fat in Fig. 2 and Fig. 3. These tissues are always not easily identified by nonprofessionals without water-fat separation, see Fig. 2 (a, f) and Fig. 3 (a, f). In contrast, after water-fat separation, we can more easily distinguish.Discussion and Conclusion
Due to the limited scope of the study, we did not validate the effect of water-fat separation at more sites in the human body. Additionally, there is a lack of mature fat suppression methods in ULF MRI. During validation, the results of water-fat separation in 3T MRI is listed for comparison. The two-point Dixon method was enhanced by incorporating the R2* effect and priori information. By utilizing priori information, the phase error in the acquired sample images was substantially alleviated, resulting in a successful separation of water and fat signals in ULF MRI. This method can be applied to gradient-echo sequence. Our results provide strong support for the implementation of the Dixon method in ULF MRI. We are also confident that Dixon method will soon play a crucial role in subsequent studies of ULF MRI. In the future, our focus will be on reducing imaging time, and exploring applications in ULF MRI after water-fat separation.Acknowledgements
Funding: This work was supported in part by the National Natural Science Foundation of China under Grant 52077023, in part by the National Natural Science Foundation of Chongqing under Grant cstc2020jcyj-msxmX0340, in part by Shenzhen Science and Technology Innovation Commission under Grant CJGJZD20200617102402006 and the China Scholarship Council.References
[1] M. Pei, T. D. Nguyen, N. D. Thimmappa, C. Salustri, F. Dong, M. A. Cooper, J. Li, M. R. Prince, and Y. Wang, “Algorithm for fast monoexponential fitting based on Auto-Regression on Linear Operations (ARLO) of data,” vol. 73, no. 2, pp. 843-850, 2015.
[2] Q. S. Xiang, “Two-point water-fat imaging with partially-opposed-phase (POP) acquisition: an asymmetric Dixon method,” Magn Reson Med, vol. 56, no. 3, pp. 572-584, 2006.
[3] Y. He, W. He, L. Tan, F. Chen, F. Meng, H. Feng, and Z. Xu, “Use of 2.1 MHz MRI scanner for brain imaging and its preliminary results in stroke,” Journal of Magnetic Resonance, vol. 319, pp. 106829, 2020.
Figures