3663
Insights for in vivo MR axon radius mapping from simulations based on large-scale histology1Institute of Systems Neuroscience, University Medical Center Hamburg-Eppendorf, Hamburg, Germany, 2Department of Neurophysics, Max Planck Institute for Human Cognitive and Brain Sciences, Leipzig, Germany, 3Paul Flechsig Institute - Center of Neuropathology and Brain Research, Medical Faculty University of Leipzig, Leipzig, Germany, 4Felix Bloch Institute for Solid State Physics, Faculty of Physics and Earth Sciences, Leipzig University, Leipzig, Germany, 5Wellcome Centre for Human Neuroimaging, Institute of Neurology, University College London, London, United Kingdom, 6Max Planck Research Group MR Physics, Max Planck Institute for Human Development, Berlin, Germany
Synopsis
Keywords: Microstructure, White Matter, Histology, Axon Radius Distribution, Intra-axonal signal, Rician bias
Motivation: To understand deviations between axon radii from in vivo MR experiments and histology.
Goal(s): To assess the sensitivity of the intra-axonal MR signal to the axon radius; to assess the impact of confounders (extra-axonal signal and Rician noise bias); to discuss deviations between in vivo MR experiments and simulations.
Approach: We simulated MR signals for axon radii distributions from large-scale histology with and without confounders; we compared radii fitted to in vivo MR experiments and simulations.
Results: Large MR radii are inherently underestimated; confounders are expected to further bias MR radii and can potentially explain deviations between in vivo MR experiments and simulations.
Impact: We reveal an inherent bias in the MR axon radius model for in vivo measurements. Furthermore, we identified two main confounders that can significantly narrow the dynamic range of MR radius measurements and reduce sensitivity to small-axon radii regions.
Introduction
Diffusion-weighted MRI (dMRI) can estimate the tail-weighted effective MR axon radius1,2$$r_{\text{eff}} = \sqrt[4]{\frac{\langle r^6 \rangle}{\langle r^2 \rangle}}.~\quad~(\text{Eq.1})$$
However, current validation2-4 of $$$r_{\text{eff}}$$$ in the human brian relies on small-scale histology data5-7, which insufficiently samples the tail of the axon radii8. Furthermore, MR signal simulations for validation2 or MR protocol optimization9 neglect the axon radii distribution and use single axon approximations instead. Using MR simulations based on axon radii distributions of the human corpus callosum (CC) from large-scale histology10, we assessed the sensitivity of the intra-axonal MR signal to $$$r_{\text{eff}}$$$ and characterized the impact of potential confounders, specifically, residual extra-axonal signal and Rician noise bias. Furthermore, we assessed and discussed deviations of MR simulations to in vivo MR experiments.
Theory
The magnitude diffusion-weighted MR signal normalized to S(b=0) in white matter can be approximated as11-13 $$S(h(r),\vec{g},b)~=~f_{\text{a}}\underbrace{\frac{\langle~r^2e^{-bD_{\text{a}}^{\perp}(r)}\int~P(\vec{n})e^{-b(D_{\text{a}}^{\parallel}-D_{\text{a}}^{\perp}(r))(\vec{g}^T\vec{n})} d \vec{n} \rangle}{\langle~r^2\rangle}}_{S_{\text{a}}(h(r),\vec{g},b)}+(1-f_{\text{a}})\cdot\underbrace{e^{-bD_{\text{e}}^{\perp}}\int~P(\vec{n})e^{-b(D_{\text{e}}^{\parallel}-D_{\text{e}}^{\perp})(\vec{g}^T\vec{n})}d \vec{n}}_{S_{\text{e}}(\vec{g},b)}~\quad~(\text{Eq.2})$$ with- $$$\vec{g}$$$: diffusion gradient direction
- $$$\vec{n}$$$: main fiber direction
- $$$\text{P}(\vec{n})$$$: fiber orientation distribution function
- $$$f_{\text{a}}$$$: $$$\text{T}_2$$$-weighted axonal water fraction
- $$$\text{S}_{\text{e}}(\vec{g},b)$$$: extra-axonal signal
- $$$\text{S}_{\text{a}}(h(r),\vec{g},b)$$$: intra-axonal signal
- $$$\text{D}_{\text{e}}^{\perp}$$$ and $$$\text{D}_{\text{e}}^{\parallel}$$$: extra-axonal perpendicular and parallel diffusivity
- $$$\text{D}_{\text{a}}^{\perp}(r)$$$ and $$$\text{D}_{\text{a}}^{\parallel}$$$: intra-axonal perpendicular and parallel diffusivity
- $$$r$$$: axon radius
- h(r): axon radii distribution
- b: b-value
At sufficiently high diffusion weighting (estimated as $$$b \geq 6 \text{ms}/\text{μm}^2$$$ for in vivo data2,14), $$$\text{S}_{\text{e}}(\vec{g},b)$$$ becomes negligible, and so $$$r_{\text{eff}}$$$ can be fit to the spherically-averaged signal of $$$\text{S}_{\text{a}}(h(r),\vec{g},b)$$$2,15.
Materials and Methods
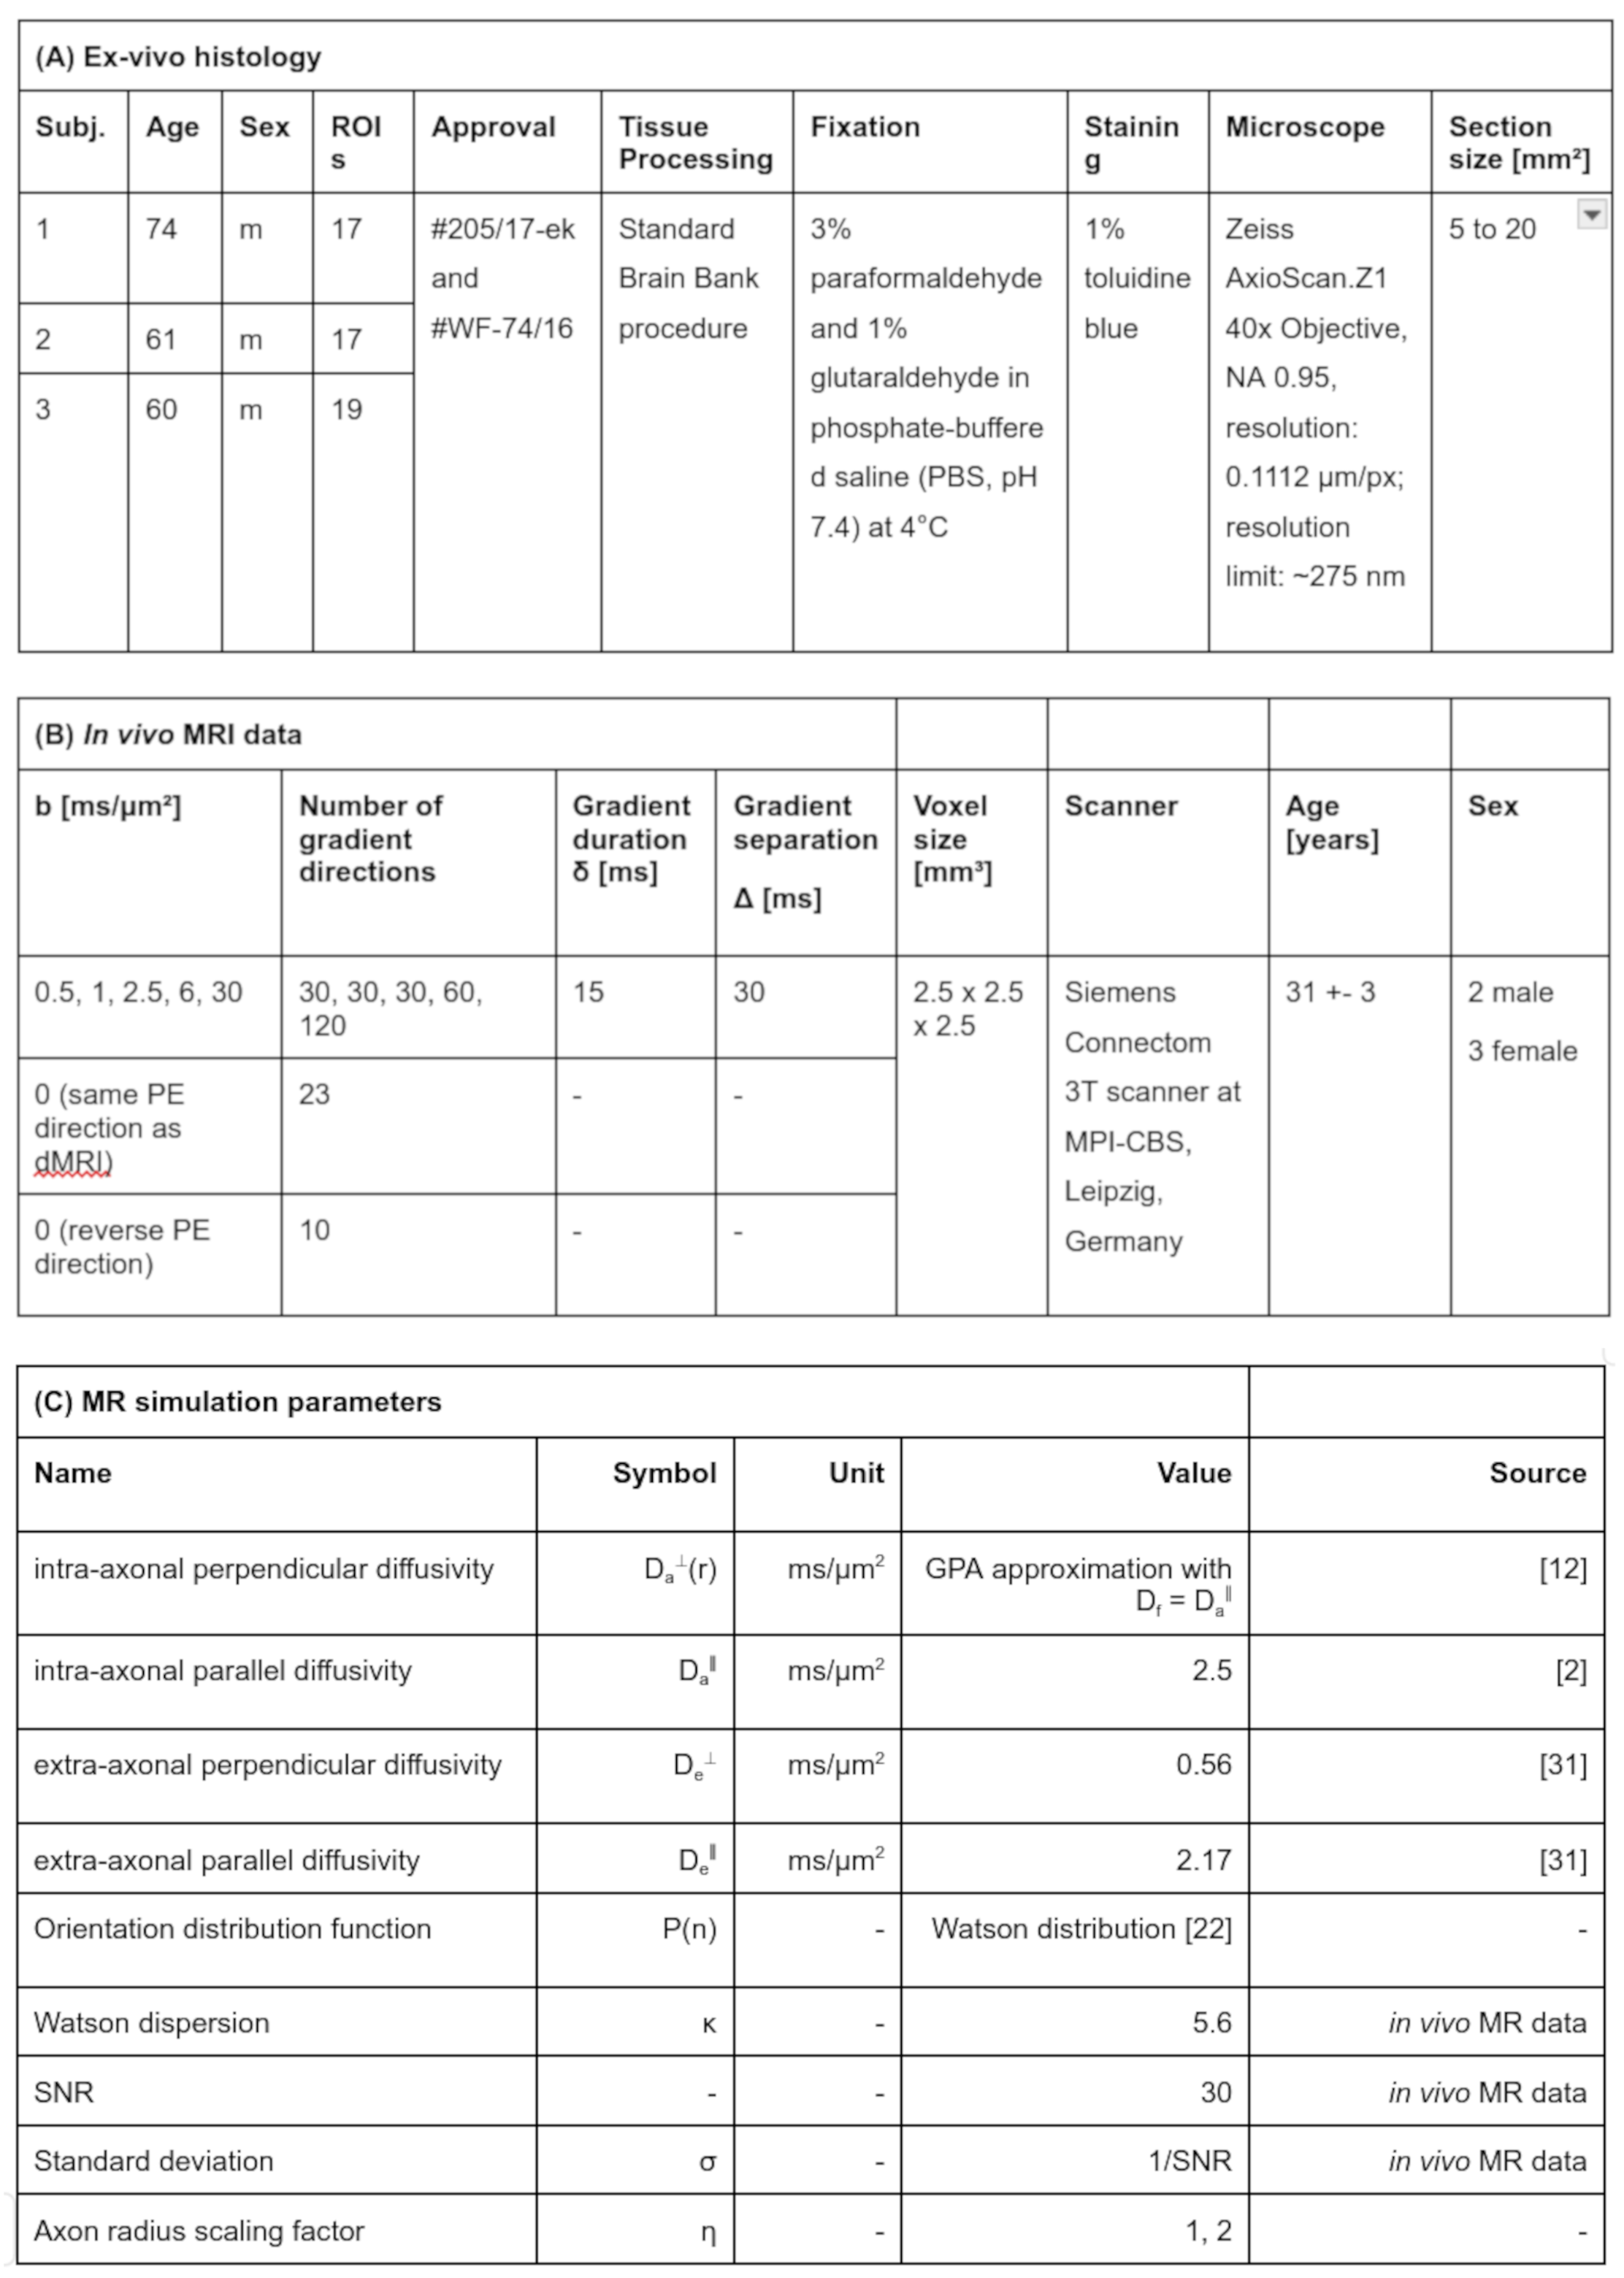
Histology Image Acquisition: We acquired large-scale light microscopy images for several ROIs of three CC specimens. See Table 1A for details.Histology Image Processing: We derived empirical h(r) and $$$r_{\text{eff}}$$$ per ROI as in10.
MR Image Acquisition: We acquired in vivo, dMRI images of five healthy adults following the protocol in9 (see Table 1B).
MR Image Processing: We preprocessed dMRI images16-19 and computed neurite dispersion (κ)20. For $$$b \geq 6 \text{ms}/\text{μm}^2$$$, we fitted spherically-averaged signals using a Rician ML estimator21 with estimated noise level $$$\hat{𝜎}$$$ obtained19,22-23 from raw dMR images.
MR Simulations: For histology-based h(r) per ROI, we simulated in vivo MR signals for $$$b = [6, 30]~\text{ms}/\text{μm}^2$$$ using Eq.2 (see Table 1B-C for parameters) to study:
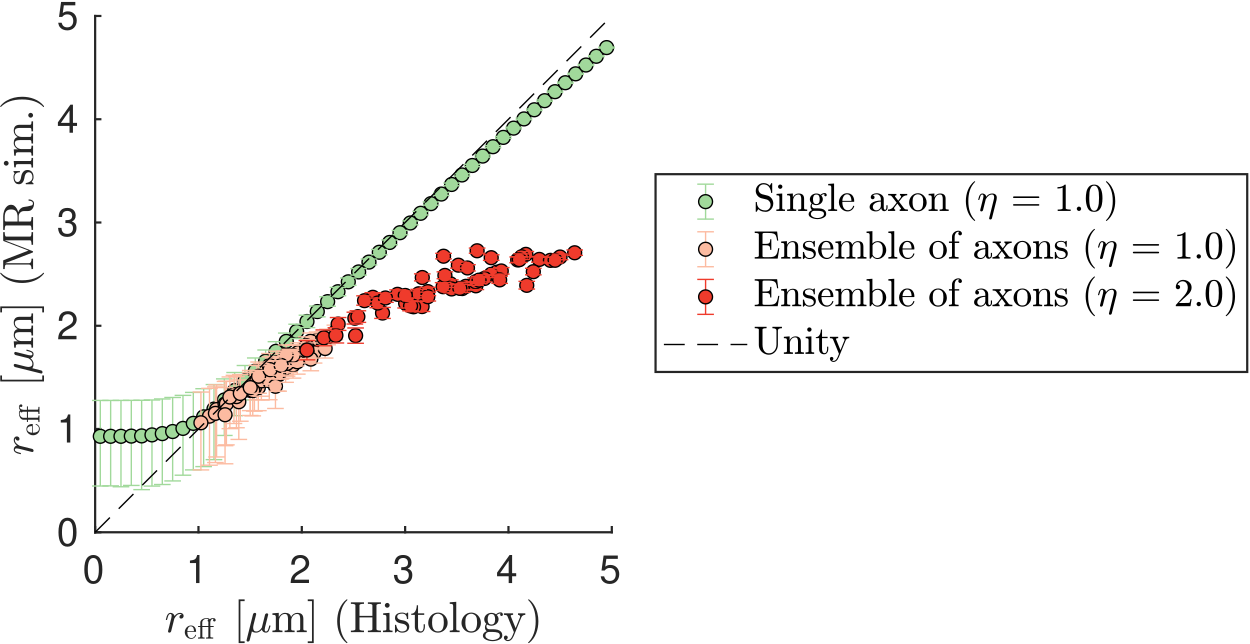
- the sensitivity of $$$\text{S}_{\text{a}}(h(r),\vec{g},b)$$$ to $$$r_{\text{eff}}$$$: Eq.2 with $$$\text{S}_{\text{e}}(\vec{g},b) = 0$$$ and SNR = inf; we repeated the analysis for single axons of radius $$$r \in [0, 5]~\text{μm}$$$ instead of histology-based h(r),
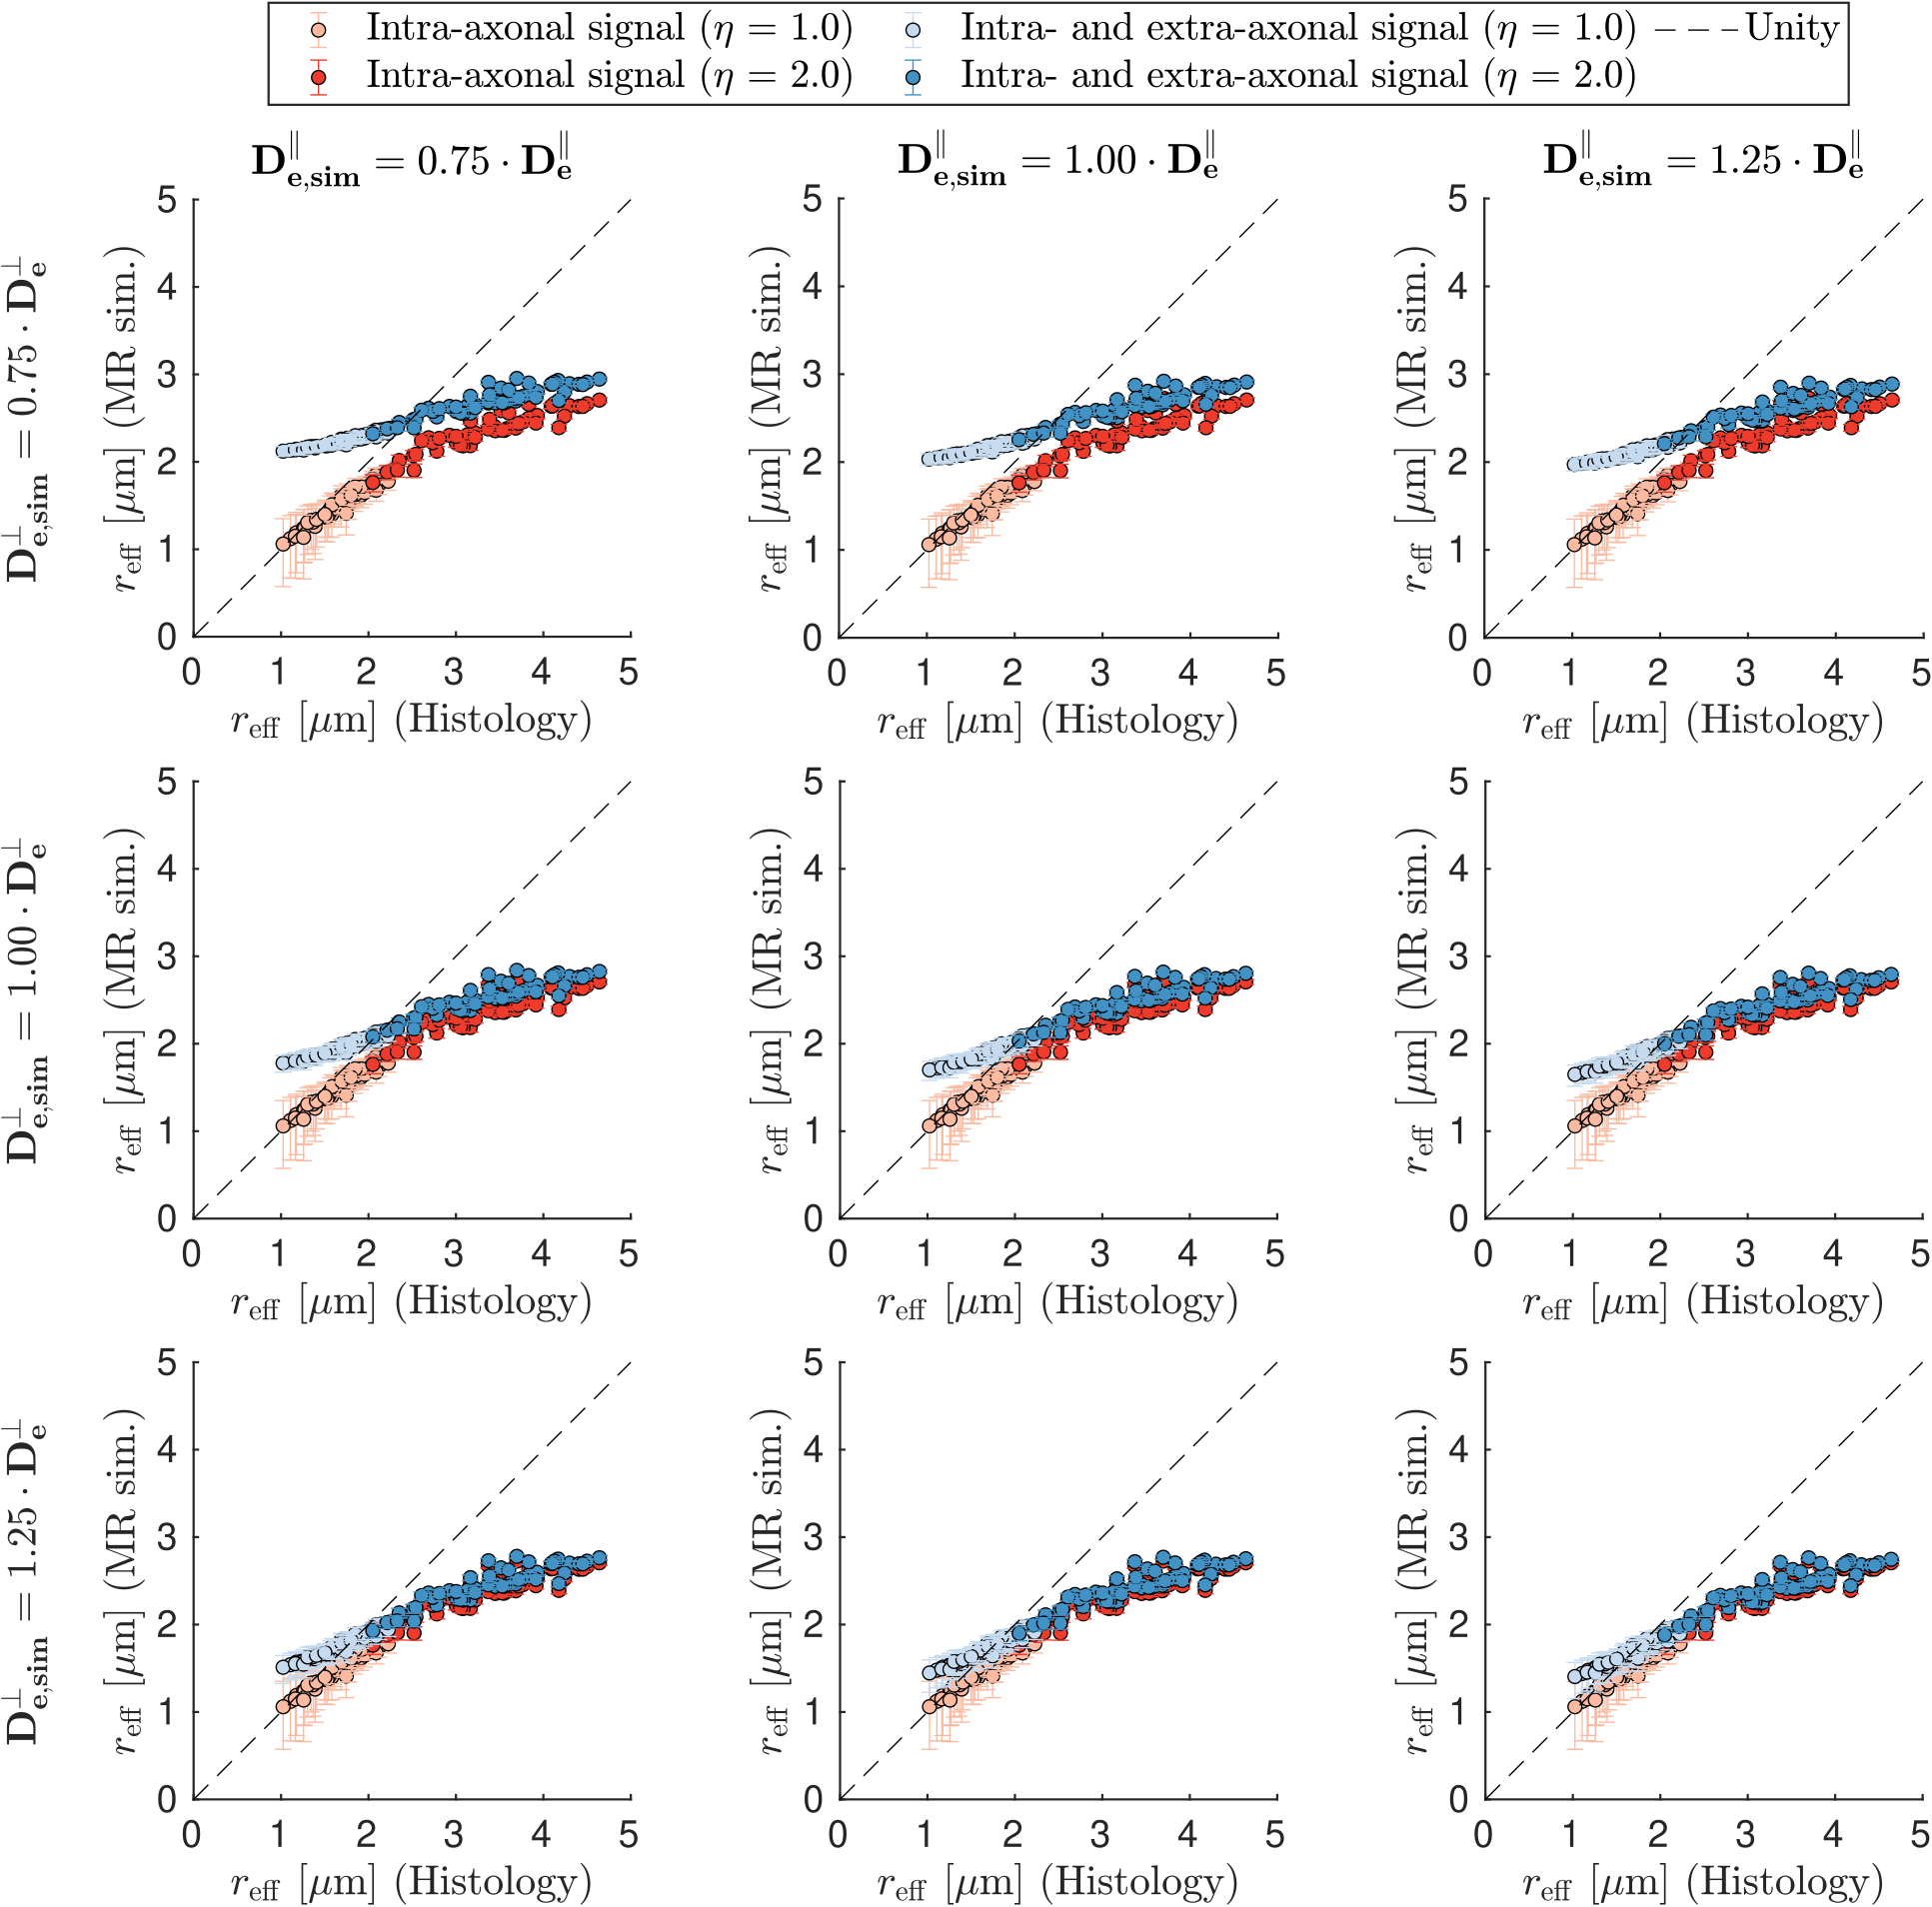
- the impact of residual $$$\text{S}_{\text{e}}(\vec{g},b)$$$: Eq.2 with $$$\text{D}_{\text{e,sim}}^{\parallel} \in [\text{D}_{\text{e}}^{\parallel} \pm$$$ 25%], $$$\text{D}_{\text{e,sim}}^{\perp} \in [\text{D}_{\text{e}}^{\perp} \pm$$$ 25%] and SNR = inf,
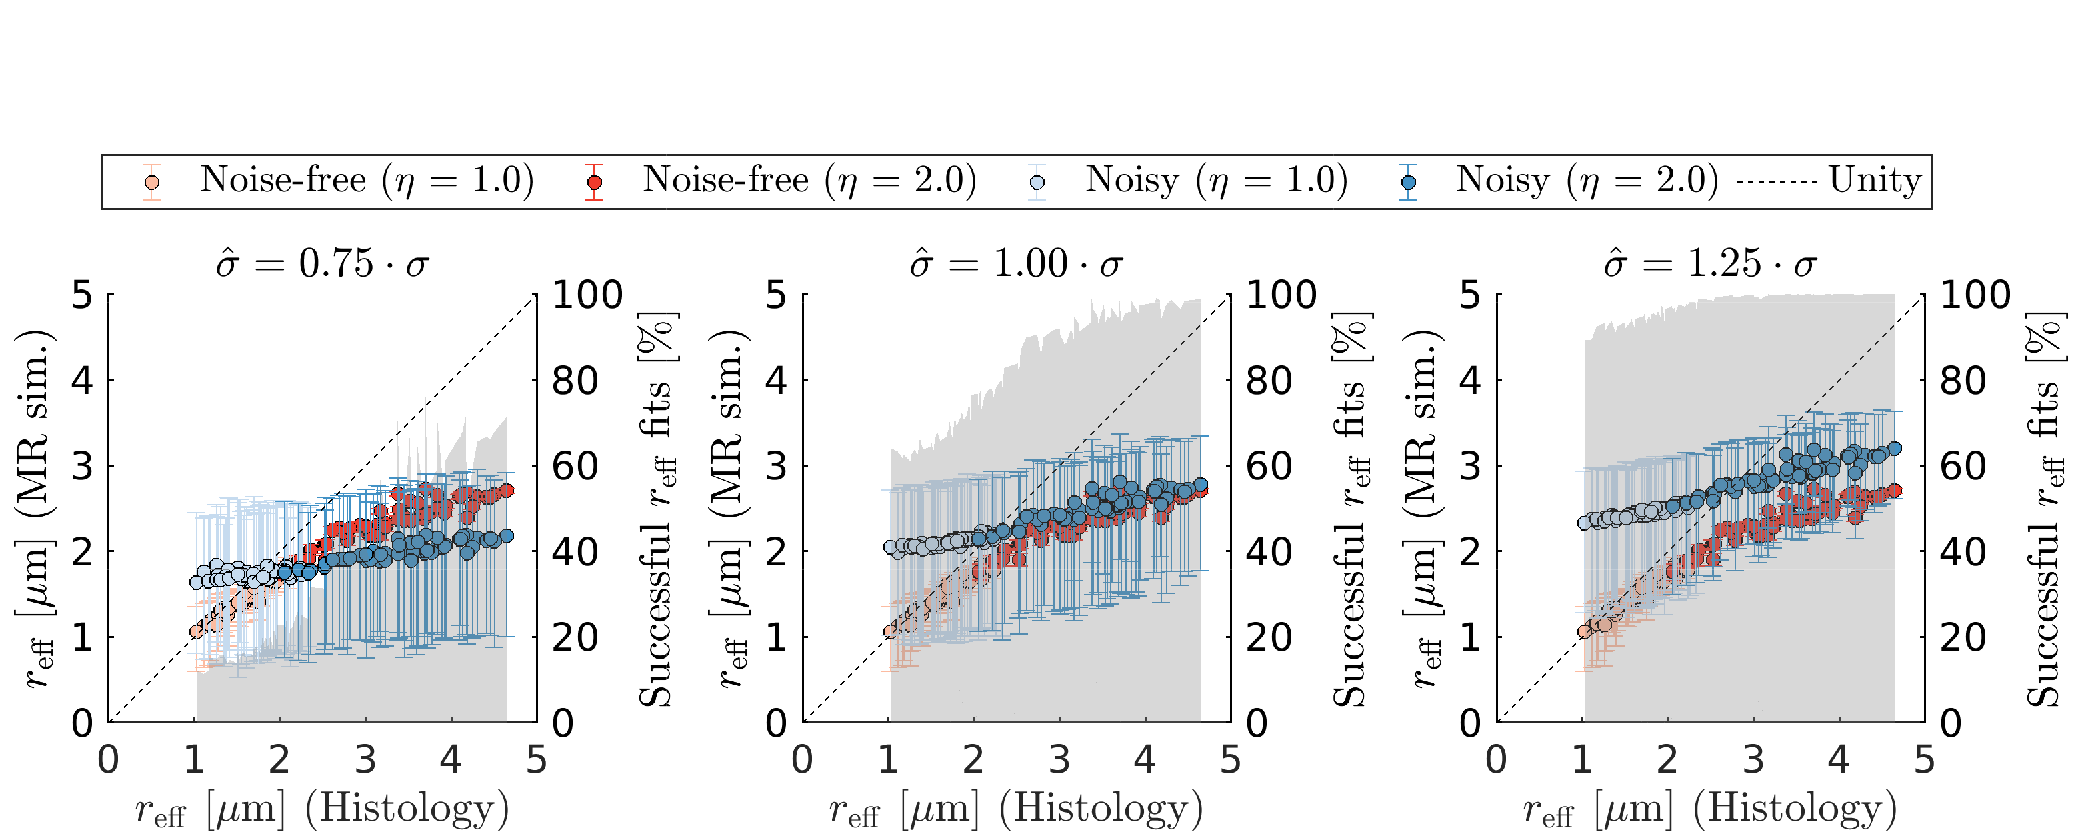
- the impact of imperfect Rician bias correction: Eq.2 with $$$\text{S}_{\text{e}}(\vec{g},b) = 0$$$, added Rician noise with noise level σ, and biased estimated Rician noise level $$$\hat{\sigma} \in [\sigma \pm$$$ 25%] for spherical averaging,
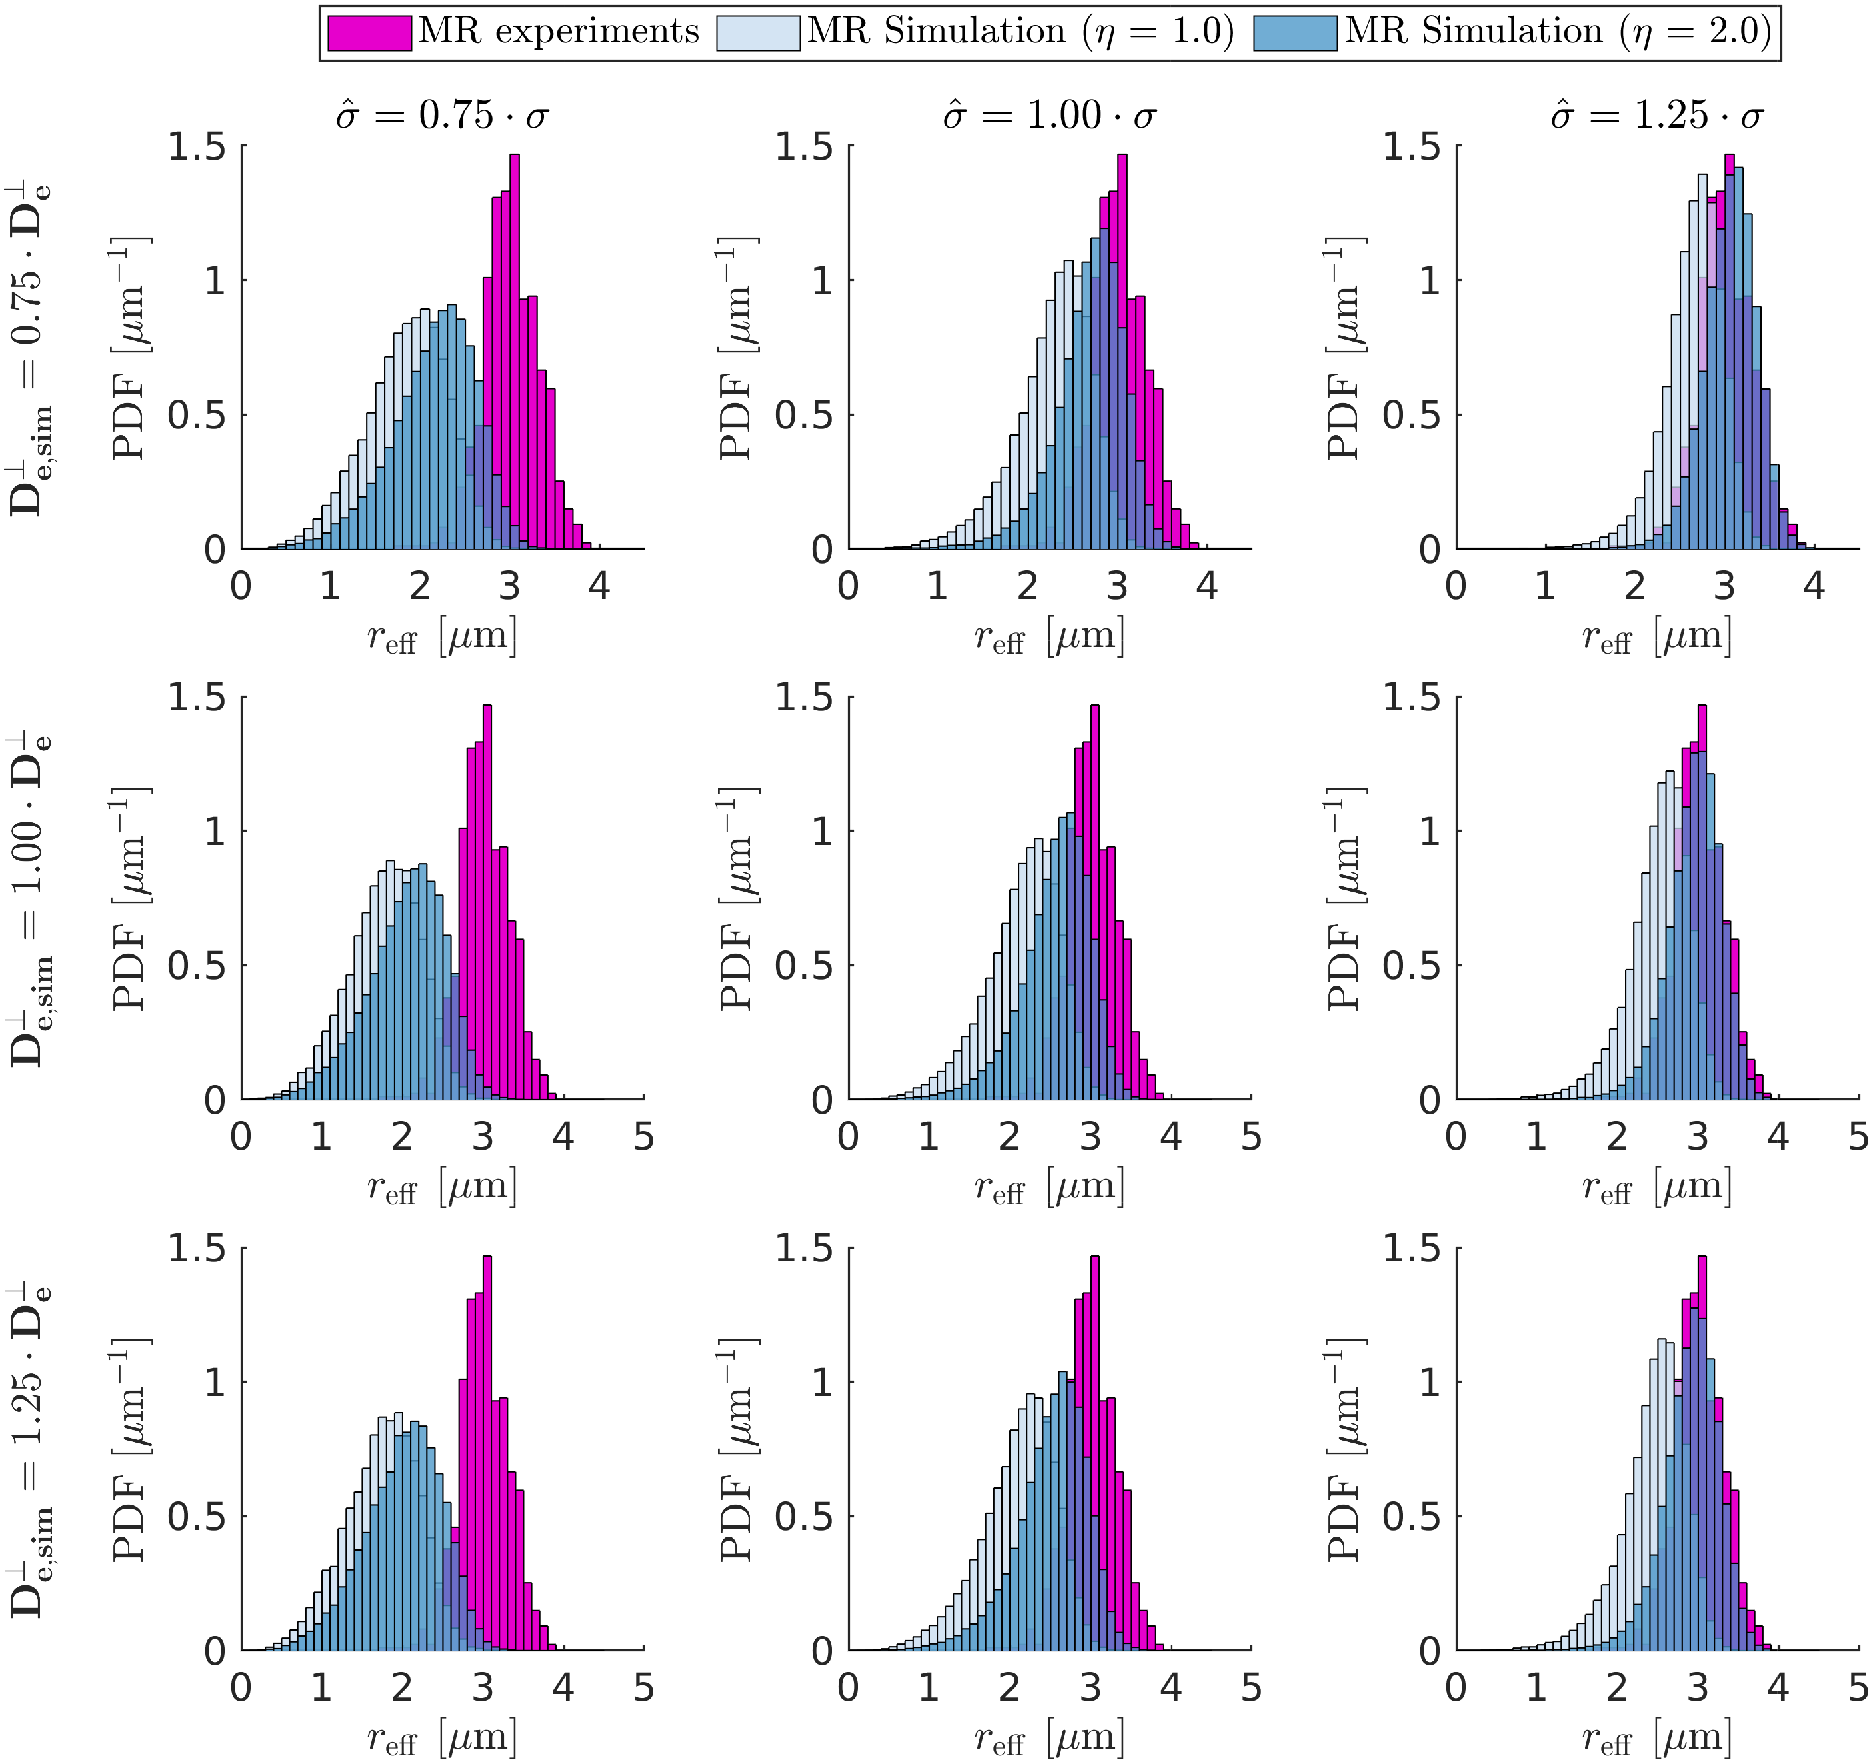
- differences between in vivo MR experiments and simulations: we combined major confounders identified in (2)-(3), i.e., $$$\text{D}_{\text{e,sim}}^{\perp}$$$ and $$$\hat{\sigma}$$$.
Results
Figure 1 shows that in vivo $$$r_{\text{eff}}$$$ of histology-based axon radii distributions differ significantly from single-axon $$$r_{\text{eff}}$$$, revealing a bias for larger $$$r_{\text{eff}}$$$.When including extra-axonal signal in the simulations (see Figure 2), small $$$r_{\text{eff}}$$$ are overestimated mainly as a function of $$$\text{D}_{\text{e}}^{\perp}$$$. Imperfect Rician bias correction (see Figure 3) can cause either under- or overestimation of $$$r_{\text{eff}}$$$, which is inherited from the bias in noise level estimation ($$$\hat{\sigma}$$$). When $$$\hat{\sigma}$$$ is underestimated, $$$r_{\text{eff}}$$$ fitting is likely to fail for small $$$r_{\text{eff}}$$$. Compared to $$$r_{\text{eff}}$$$ from in vivo MR experiments (see Figure 4), simulated $$$r_{\text{eff}}$$$ distributions are wider and have smaller modes; their appearance depends mostly on $$$\hat{\sigma}$$$. In the presence of strong extra-axonal signal (low $$$\text{D}_{\text{e}}^{\perp}$$$) and overestimated $$$\hat{\sigma}$$$, $$$r_{\text{eff}}$$$ distributions of MR experiments and simulations resemble each other, implying that the in vivo maps may be biased.Discussion
We demonstrated through MR simulations that $$$r_{\text{eff}}$$$ of realistic human axon radii distributions are biased for large $$$r_{\text{eff}}$$$. Combined with additional confounders, specifically, residual extra-axonal signal and Rician noise bias, the narrow $$$r_{\text{eff}}$$$ range of in vivo MR experiments can be reproduced. However, there remain several confounders not discussed here, e.g., glial cells24 or along-axon radius variation25-26. Even though we corrected for tissue shrinkage with values outside (from no shrinkage to radii twice as large) the reported range5,27-29, our results show that confounders can make the influence of tissue shrinkage negligible.Conclusion
To improve sensitivity to $$$r_{\text{eff}}$$$, MR protocols should be optimized for realistic axon radii distributions instead of single axon approximations and the need for Rician bias correction should be eliminated by, e.g., getting Gaussian-distributed real data from complex MR images30.Acknowledgements
The research leading to these results has received funding from the European Research Council under the European Union's Seventh Framework Programme (FP7/2007-2013) / ERC grant agreement n° 616905.This work was supported by the German Research Foundation (DFG Priority Program 2041 "Computational Connectomics”, [MO 2397/5-1; MO 2397/5-2], by the Emmy Noether Stipend: MO 2397/4-1; MO 2397/4-2) and by the BMBF (01EW1711A and B) in the framework of ERA-NET NEURON and the Forschungszentrums Medizintechnik Hamburg (fmthh; grant 01fmthh2017).References
[1] L. M. Burcaw, E. Fieremans, and D. S. Novikov, “Mesoscopic structure of neuronal tracts from time-dependent diffusion,” NeuroImage, vol. 114, pp. 18–37, Jul. 2015, doi: 10.1016/j.neuroimage.2015.03.061.
[2] J. Veraart et al., “Noninvasive quantification of axon radii using diffusion MRI,” eLife, vol. 9, p. e49855, Feb. 2020, doi: 10.7554/eLife.49855.
[3] D. C. Alexander et al., “Orientationally invariant indices of axon diameter and density from diffusion MRI,” NeuroImage, vol. 52, no. 4, pp. 1374–1389, Oct. 2010, doi: 10.1016/j.neuroimage.2010.05.043.
[4] A. Horowitz, D. Barazany, I. Tavor, M. Bernstein, G. Yovel, and Y. Assaf, “In vivo correlation between axon diameter and conduction velocity in the human brain,” Brain Struct. Funct., vol. 220, no. 3, pp. 1777–1788, May 2015, doi: 10.1007/s00429-014-0871-0.
[5] F. Aboitiz, A. B. Scheibel, R. S. Fisher, and E. Zaidel, “Fiber composition of the human corpus callosum,” Brain Res., vol. 598, no. 1, pp. 143–153, Dec. 1992, doi: 10.1016/0006-8993(92)90178-C.
[6] D. Liewald, R. Miller, N. Logothetis, H.-J. Wagner, and A. Schüz, “Distribution of axon diameters in cortical white matter: an electron-microscopic study on three human brains and a macaque,” Biol. Cybern., vol. 108, no. 5, pp. 541–557, Oct. 2014, doi: 10.1007/s00422-014-0626-2.
[7] R. Caminiti, H. Ghaziri, R. Galuske, P. R. Hof, and G. M. Innocenti, “Evolution amplified processing with temporally dispersed slow neuronal connectivity in primates,” Proc. Natl. Acad. Sci. U. S. A., vol. 106, no. 46, pp. 19551–19556, Nov. 2009, doi: 10.1073/pnas.0907655106.
[8] L. Mordhorst et al., “Reliable estimation of the MRI-visible effective axon radius using light microscopy: the need for large field-of-views,” in ISMRM 2021, May 2021.
[9] J. Veraart, E. P. Raven, L. J. Edwards, N. Weiskopf, and D. K. Jones, “The variability of MR axon radii estimates in the human white matter,” Hum. Brain Mapp., vol. 42, no. 7, pp. 2201–2213, May 2021, doi: 10.1002/hbm.25359.
[10] L. Mordhorst et al., “Towards a representative reference for MRI-based human axon radius assessment using light microscopy,” NeuroImage, vol. 249, p. 118906, Apr. 2022, doi: 10.1016/j.neuroimage.2022.118906.
[11] K. J. Packer and C. Rees, “Pulsed NMR studies of restricted diffusion. I. Droplet size distributions in emulsions,” J. Colloid Interface Sci., vol. 40, no. 2, pp. 206–218, Aug. 1972, doi: 10.1016/0021-9797(72)90010-0.
[12] P. Van Gelderen, D. Despres, P. C. M. Vanzijl, and C. T. W. Moonen, “Evaluation of Restricted Diffusion in Cylinders. Phosphocreatine in Rabbit Leg Muscle,” J. Magn. Reson. B, vol. 103, no. 3, pp. 255–260, Mar. 1994, doi: 10.1006/jmrb.1994.1038.
[13] D. S. Novikov, J. Veraart, I. O. Jelescu, and E. Fieremans, “Rotationally-invariant mapping of scalar and orientational metrics of neuronal microstructure with diffusion MRI,” NeuroImage, vol. 174, pp. 518–538, Jul. 2018, doi: 10.1016/j.neuroimage.2018.03.006.
[14] J. Veraart, E. Fieremans, and D. S. Novikov, “On the scaling behavior of water diffusion in human brain white matter,” NeuroImage, vol. 185, pp. 379–387, Jan. 2019, doi: 10.1016/j.neuroimage.2018.09.075.
[15] M. Pizzolato, E. J. Canales-Rodríguez, M. Andersson, and T. B. Dyrby, “Axial and radial axonal diffusivities and radii from single encoding strongly diffusion-weighted MRI,” Med. Image Anal., vol. 86, p. 102767, May 2023, doi: 10.1016/j.media.2023.102767.
[16] E. Kellner, B. Dhital, V. G. Kiselev, and M. Reisert, “Gibbs-ringing artifact removal based on local subvoxel-shifts,” Magn. Reson. Med., vol. 76, no. 5, pp. 1574–1581, Nov. 2016, doi: 10.1002/mrm.26054.
[17] J. L. R. Andersson, M. S. Graham, E. Zsoldos, and S. N. Sotiropoulos, “Incorporating outlier detection and replacement into a non-parametric framework for movement and distortion correction of diffusion MR images,” NeuroImage, vol. 141, pp. 556–572, Nov. 2016, doi: 10.1016/j.neuroimage.2016.06.058.
[18] J. L. R. Andersson and S. N. Sotiropoulos, “An integrated approach to correction for off-resonance effects and subject movement in diffusion MR imaging,” NeuroImage, vol. 125, pp. 1063–1078, Jan. 2016, doi: 10.1016/j.neuroimage.2015.10.019.
[19] J.-D. Tournier et al., “MRtrix3: A fast, flexible and open software framework for medical image processing and visualisation,” NeuroImage, vol. 202, p. 116137, Nov. 2019, doi: 10.1016/j.neuroimage.2019.116137.
[20] H. Zhang, T. Schneider, C. A. Wheeler-Kingshott, and D. C. Alexander, “NODDI: Practical in vivo neurite orientation dispersion and density imaging of the human brain,” NeuroImage, vol. 61, no. 4, pp. 1000–1016, Jul. 2012, doi: 10.1016/j.neuroimage.2012.03.072.
[21] J. Sijbers, A. J. den Dekker, P. Scheunders, and D. Van Dyck, “Maximum-likelihood estimation of Rician distribution parameters,” IEEE Trans. Med. Imaging, vol. 17, no. 3, pp. 357–361, Jun. 1998, doi: 10.1109/42.712125.
[22] J. Veraart, D. S. Novikov, D. Christiaens, B. Ades-Aron, J. Sijbers, and E. Fieremans, “Denoising of diffusion MRI using random matrix theory,” NeuroImage, vol. 142, pp. 394–406, Nov. 2016, doi: 10.1016/j.neuroimage.2016.08.016.
[23] L. Cordero-Grande, D. Christiaens, J. Hutter, A. N. Price, and J. V. Hajnal, “Complex diffusion-weighted image estimation via matrix recovery under general noise models,” NeuroImage, vol. 200, pp. 391–404, Oct. 2019, doi: 10.1016/j.neuroimage.2019.06.039.
[24] Veraart, Jelle, Raven, Erika P., Jones, Derek K., and Palombo, Marco, “Axon diameter mapping is confounded by glial cells,” in ISMRM 2023, Jun. 2023.
[25] H.-H. Lee, A. Papaioannou, S.-L. Kim, D. S. Novikov, and E. Fieremans, “A time-dependent diffusion MRI signature of axon caliber variations and beading,” Commun. Biol., vol. 3, no. 1, pp. 1–13, Jul. 2020, doi: 10.1038/s42003-020-1050-x.
[26] M. Andersson et al., “Axon morphology is modulated by the local environment and impacts the noninvasive investigation of its structure-function relationship,” Proc. Natl. Acad. Sci. U. S. A., vol. 117, no. 52, pp. 33649–33659, Dec. 2020, doi: 10.1073/pnas.2012533117.
[27] Y. Tang and J. R. Nyengaard, “A stereological method for estimating the total length and size of myelin fibers in human brain white matter,” J. Neurosci. Methods, vol. 73, no. 2, pp. 193–200, May 1997, doi: 10.1016/S0165-0270(97)02228-0.
[28] Y. Tang, J. R. Nyengaard, B. Pakkenberg, and H. J. G. Gundersen, “Age-Induced White Matter Changes in the Human Brain: A Stereological Investigation,” Neurobiol. Aging, vol. 18, no. 6, pp. 609–615, Nov. 1997, doi: 10.1016/S0197-4580(97)00155-3.
[29] J.-C. Houzel, C. Milleret, and G. Innocenti, “Morphology of Callosal Axons Interconnecting Areas 17 and 18 of the Cat,” Eur. J. Neurosci., vol. 6, no. 6, pp. 898–917, 1994, doi: 10.1111/j.1460-9568.1994.tb00585.x.
[30] C. Eichner et al., “Real diffusion-weighted MRI enabling true signal averaging and increased diffusion contrast,” NeuroImage, vol. 122, pp. 373–384, Nov. 2015, doi: 10.1016/j.neuroimage.2015.07.074.
[31] J. Veraart, D. S. Novikov, and E. Fieremans, “TE dependent Diffusion Imaging (TEdDI) distinguishes between compartmental T2 relaxation times,” NeuroImage, vol. 182, pp. 360–369, Nov. 2018, doi: 10.1016/j.neuroimage.2017.09.030.
[32] M. Andersson, M. Pizzolato, H. M. Kjer, K. F. Skodborg, H. Lundell, and T. B. Dyrby, “Does powder averaging remove dispersion bias in diffusion MRI diameter estimates within real 3D axonal architectures?,” NeuroImage, vol. 248, p. 118718, Mar. 2022, doi: 10.1016/j.neuroimage.2021.118718.
Figures