3660
Tract-specific g-ratio using COMMIT: comparison with conventional g-ratio tractometry1Biomedical Engineering, McGill University, Montreal, QC, Canada, 2McConnell Brain Imaging Centre, Montreal Neurological Institute-Hospital, Montreal, QC, Canada, 3Integrated Program in Neuroscience, McGill University, Montreal, QC, Canada, 4ASG Superconductors S.p.A., Genoa, Italy, 5Department of Physics and Astronomy, McMaster University, Hamilton, ON, Canada, 6Departments of Radiology and Clinical Neuroscience, Hotchkiss Brain Institute, University of Calgary, Calgary, AB, Canada, 7Department of Computer Science, University of Verona, Verona, Italy
Synopsis
Keywords: Microstructure, Microstructure
Motivation: Tractometry is used to estimate the microstructural properties of white matter tracts from volumetric images. However, it has significant limitations due to multi-fiber voxels that bias tract measurements.
Goal(s): We aim to estimate the tract-specific g-ratio, a ratio of the inner and outer radius of the myelin sheath.
Approach: Building on the COMMIT framework, we disentangle the microstructural features of individual white matter tracts to estimate tract-specific g-ratio.
Results: Tract-specific g-ratio had higher contrast between tracts and had a stronger correlation with tract caliber (i.e. the axonal cross-sectional area between two nodes derived from COMMIT) and length in comparison to tractometry.
Impact: By using this novel COMMIT-based pipeline to analyze diffusion and myelin-sensitive MRI data, we anticipate that tract-specific g-ratio measures will be more sensitive to subtle differences in g-ratio across tracts and individuals due to the elimination of partial volume effects.
Introduction
MRI contrasts offer complementary information about the brain’s macro- and microstructure. For instance, diffusion-weighted imaging (DWI) is sensitive to microstructural features and orientation of white matter fiber bundles, and magnetization transfer (MT) is sensitive to the myelin content of brain tissue. The myelination of white matter tracts can be estimated using an analysis pipeline known as tractometry1, where quantitative MRI maps are projected onto reconstructed streamlines to investigate mirostructural properties along a tract or differences between tracts. Tractometry is widely used2-4, yet there are limitations associated with this technique; 60-90% of image voxels in the white matter contain multi-fiber configurations5, leading to partial volume effects that bias the measurements of each fiber and conceal potential fiber differences. The convex optimization modeling for microstructure informed tractography (COMMIT) framework has been used to map tract-specific total intra-axonal and myelin volumes while minimizing the bias stemming from crossing fibers6-8. We build on this work to calculate tract-specific g-ratio. The aggregate g-ratio of a voxel can be calculated from the axonal volume fraction (AVF) and myelin volume fraction (MVF) of the voxel, estimated from diffusion and myelin-sensitive data, respectively9-11. Here, we compare g-ratio tractometry to a novel pipeline that dissociates the g-ratio of individual white matter tracts, effectively obtaining tract-specific aggregate g-ratio values.Methods
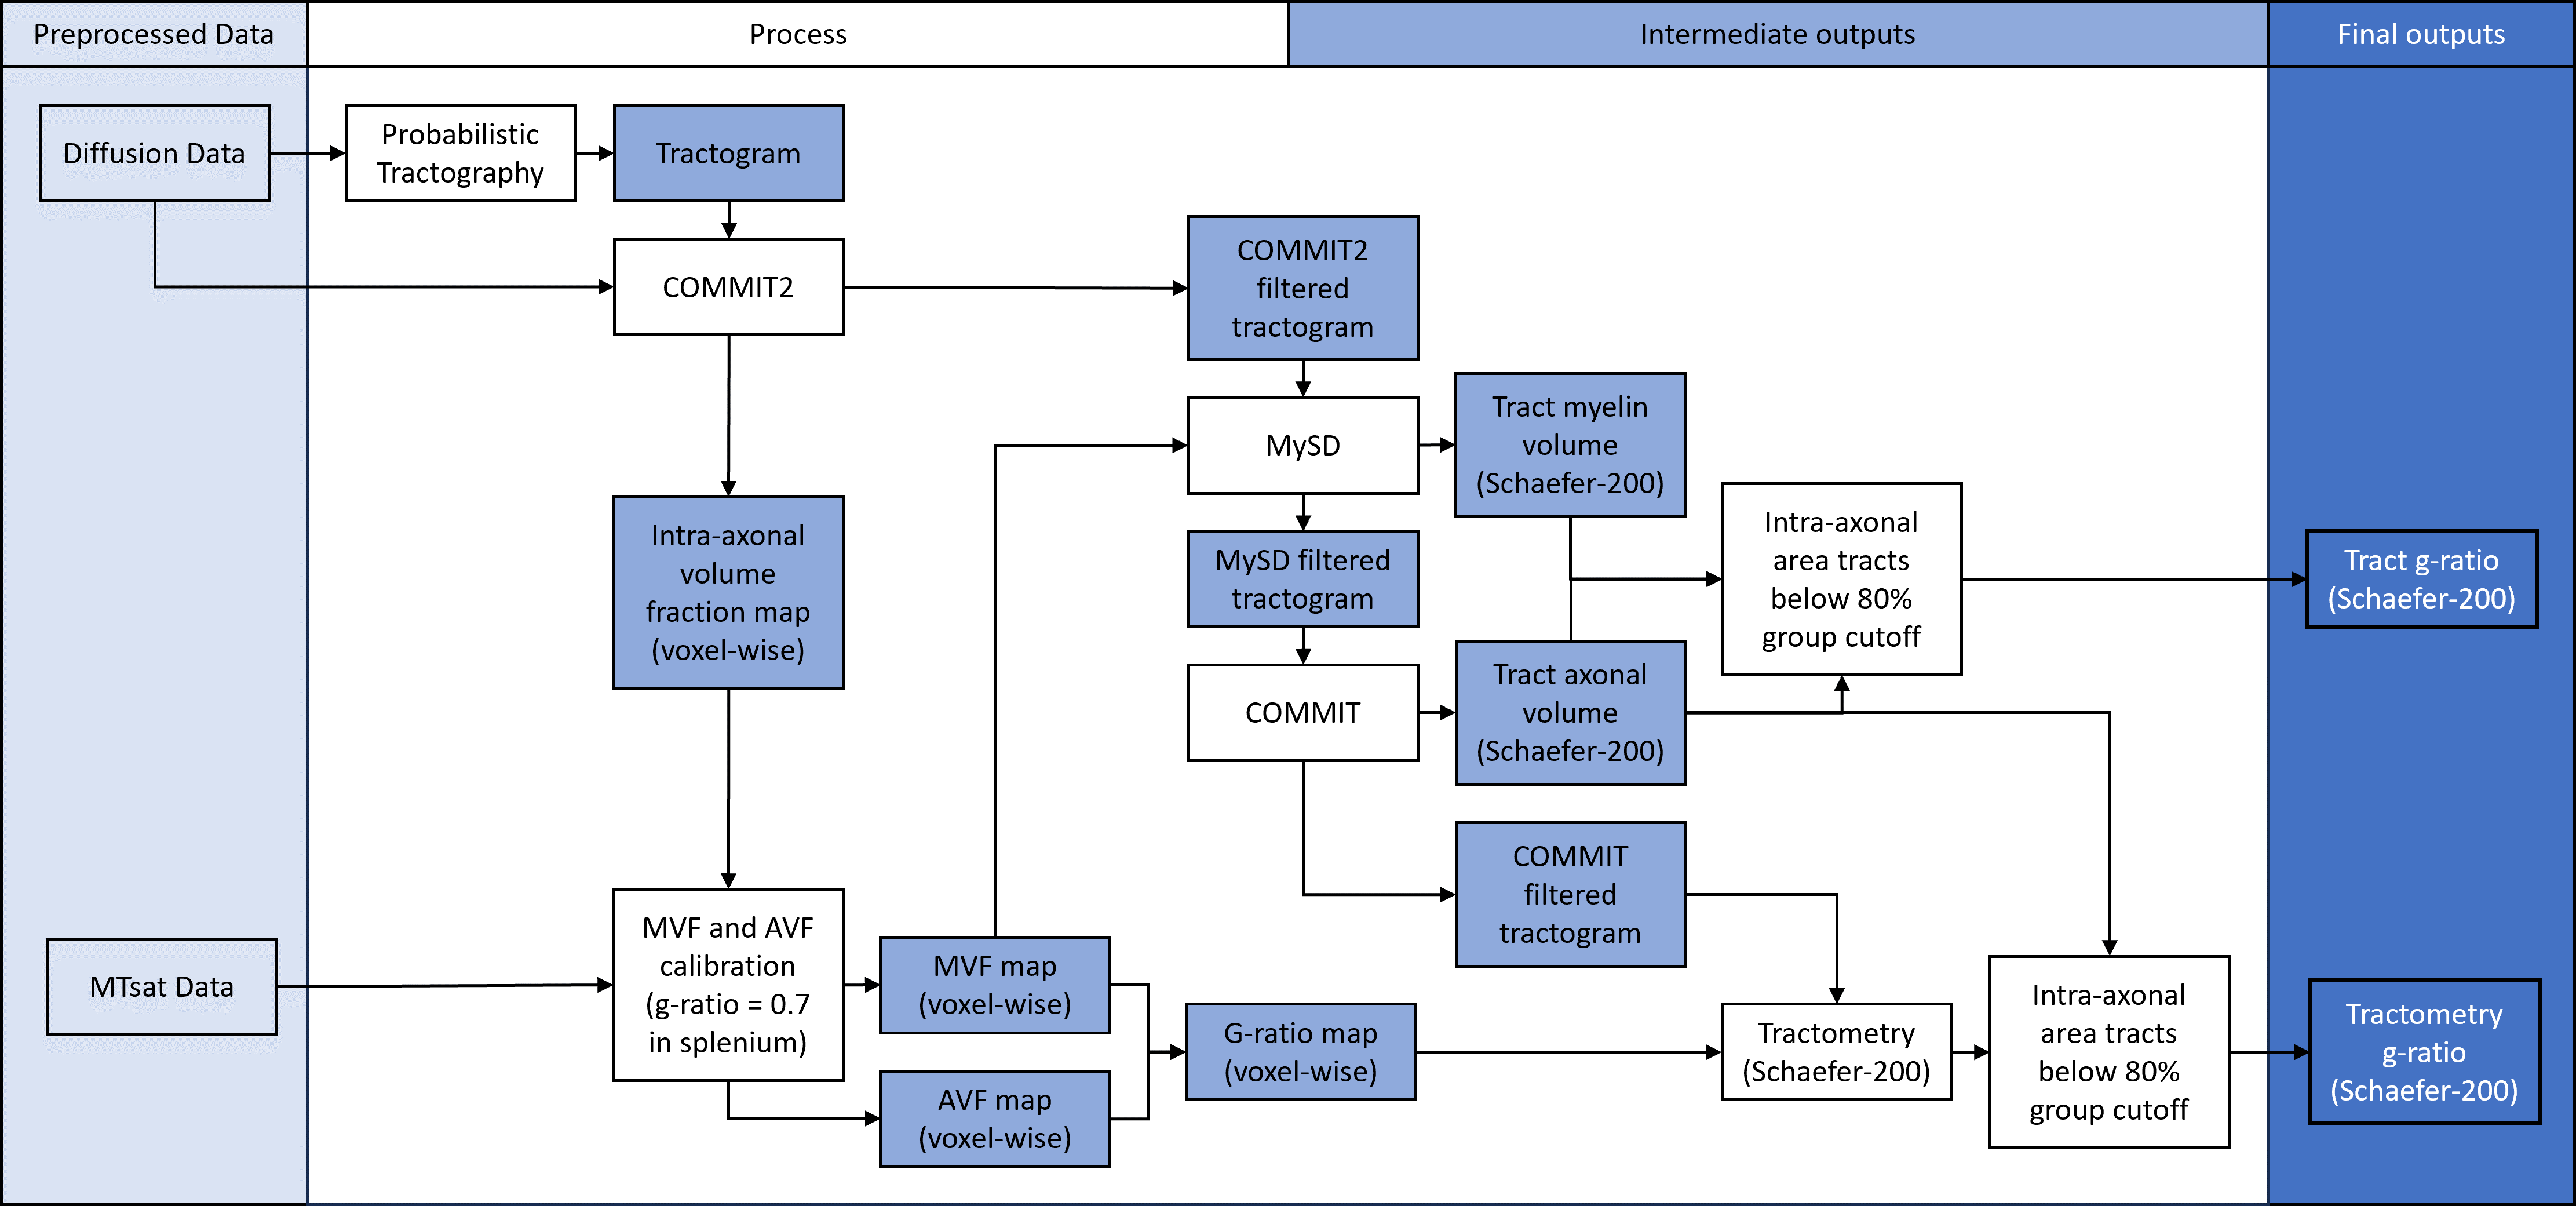
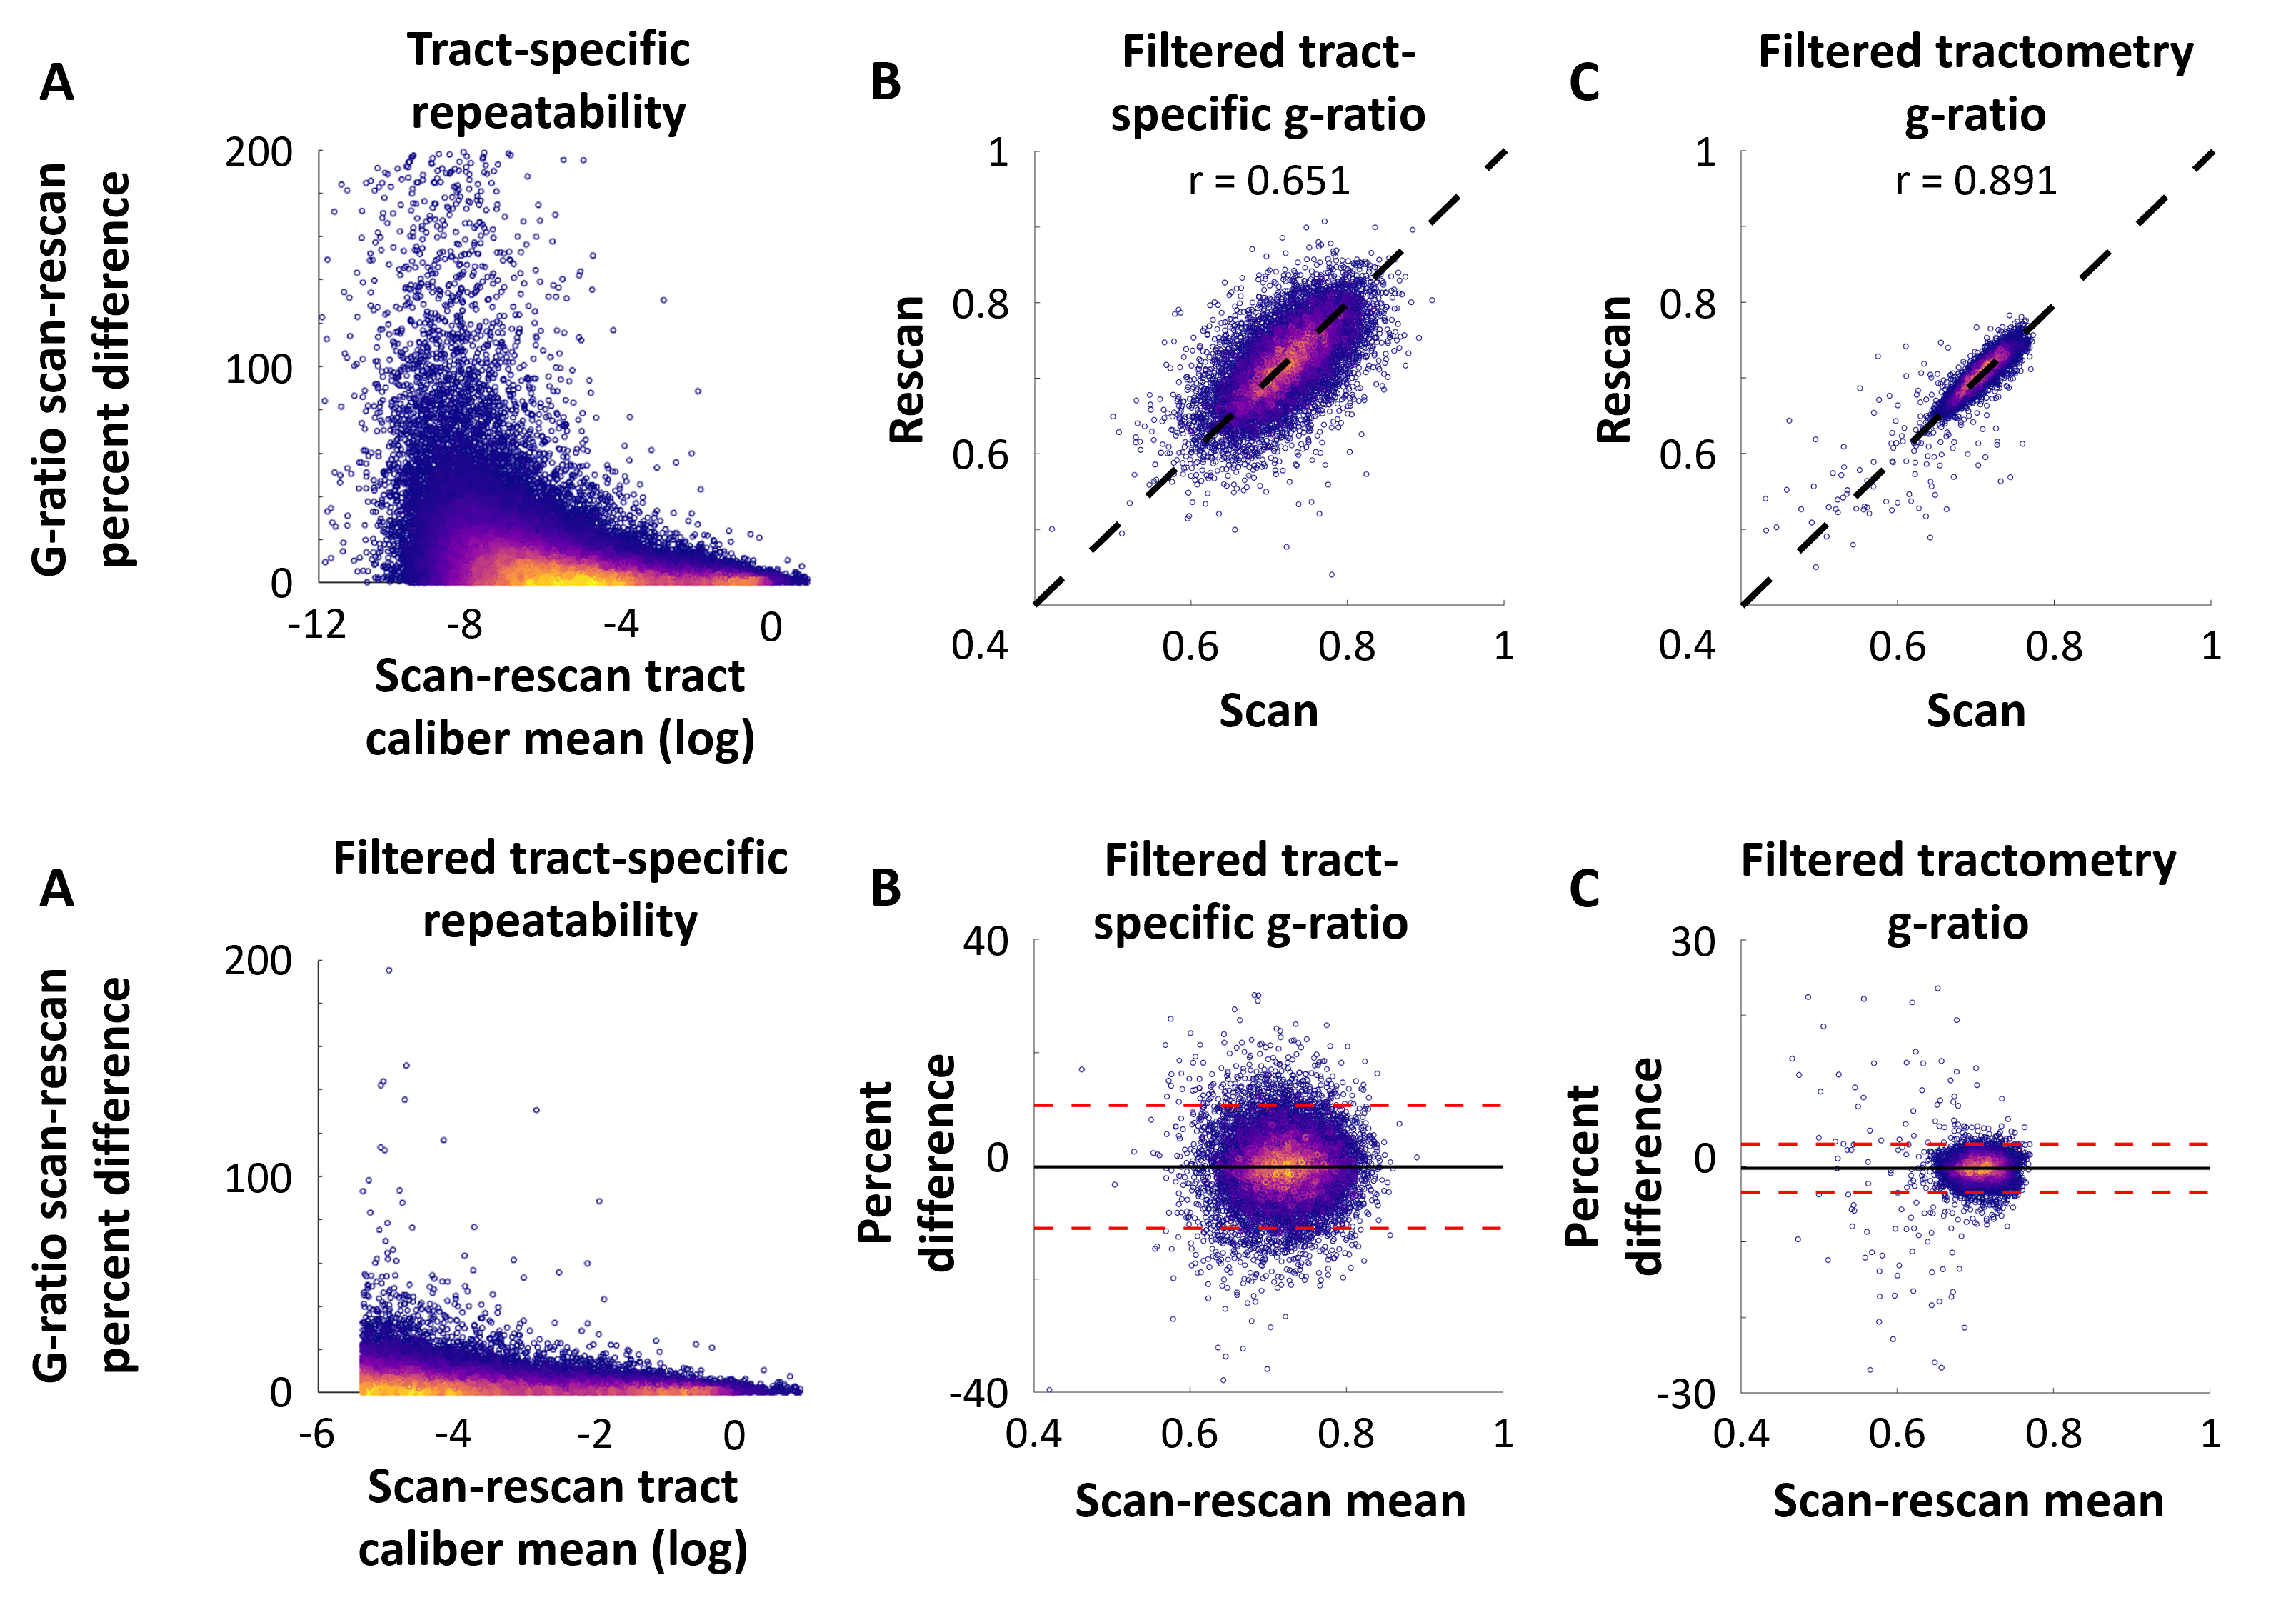
10 healthy subjects (6 males, 29.2± 6.29 years old) were scanned and rescanned (< 3 weeks inter-scan interval) on a 3 Tesla Siemens Prisma-Fit scanner. Each session included: 1 mm3 T1-weighted MPRAGE image, (2.6 mm)3 DWI for a total of 108 directions at b=0,300,1000,2000 s/mm2, and 1 mm3 MTsat image computed from three gradient echo images with T1-, PD- and MT-weighting, and a B1 map.The T1-weighted images and the DWI were preprocessed using micapipe12. A 3M-streamline tractogram was generated using probabilistic tractography13. The MVF map was derived from the MTsat image, calibrated using the splenium of the corpus callosum where the g-ratio was assumed to be 0.714. Axonal and myelin volumes were associated to each streamline following a three-stage COMMIT filtering pipeline illustrated in Figure 16-8. The tract-specific g-ratio connectivity matrices were calculated from the streamline volumes using the Schaefer-200 parcellation15. For comparison, conventional g-ratio tractometry was computed using the same streamlines and voxel-wise g-ratio estimates computed from the AVF and MVF maps14. The scan-rescan repeatability was poor for small caliber tracts (i.e. low total axonal cross-sectional area derived from COMMIT) and were thus excluded from subsequent analyses using an 80th percentile tract cutoff across all subjects, applied to both the tract-specific and tractometry g-ratio results.
Results and Discussion
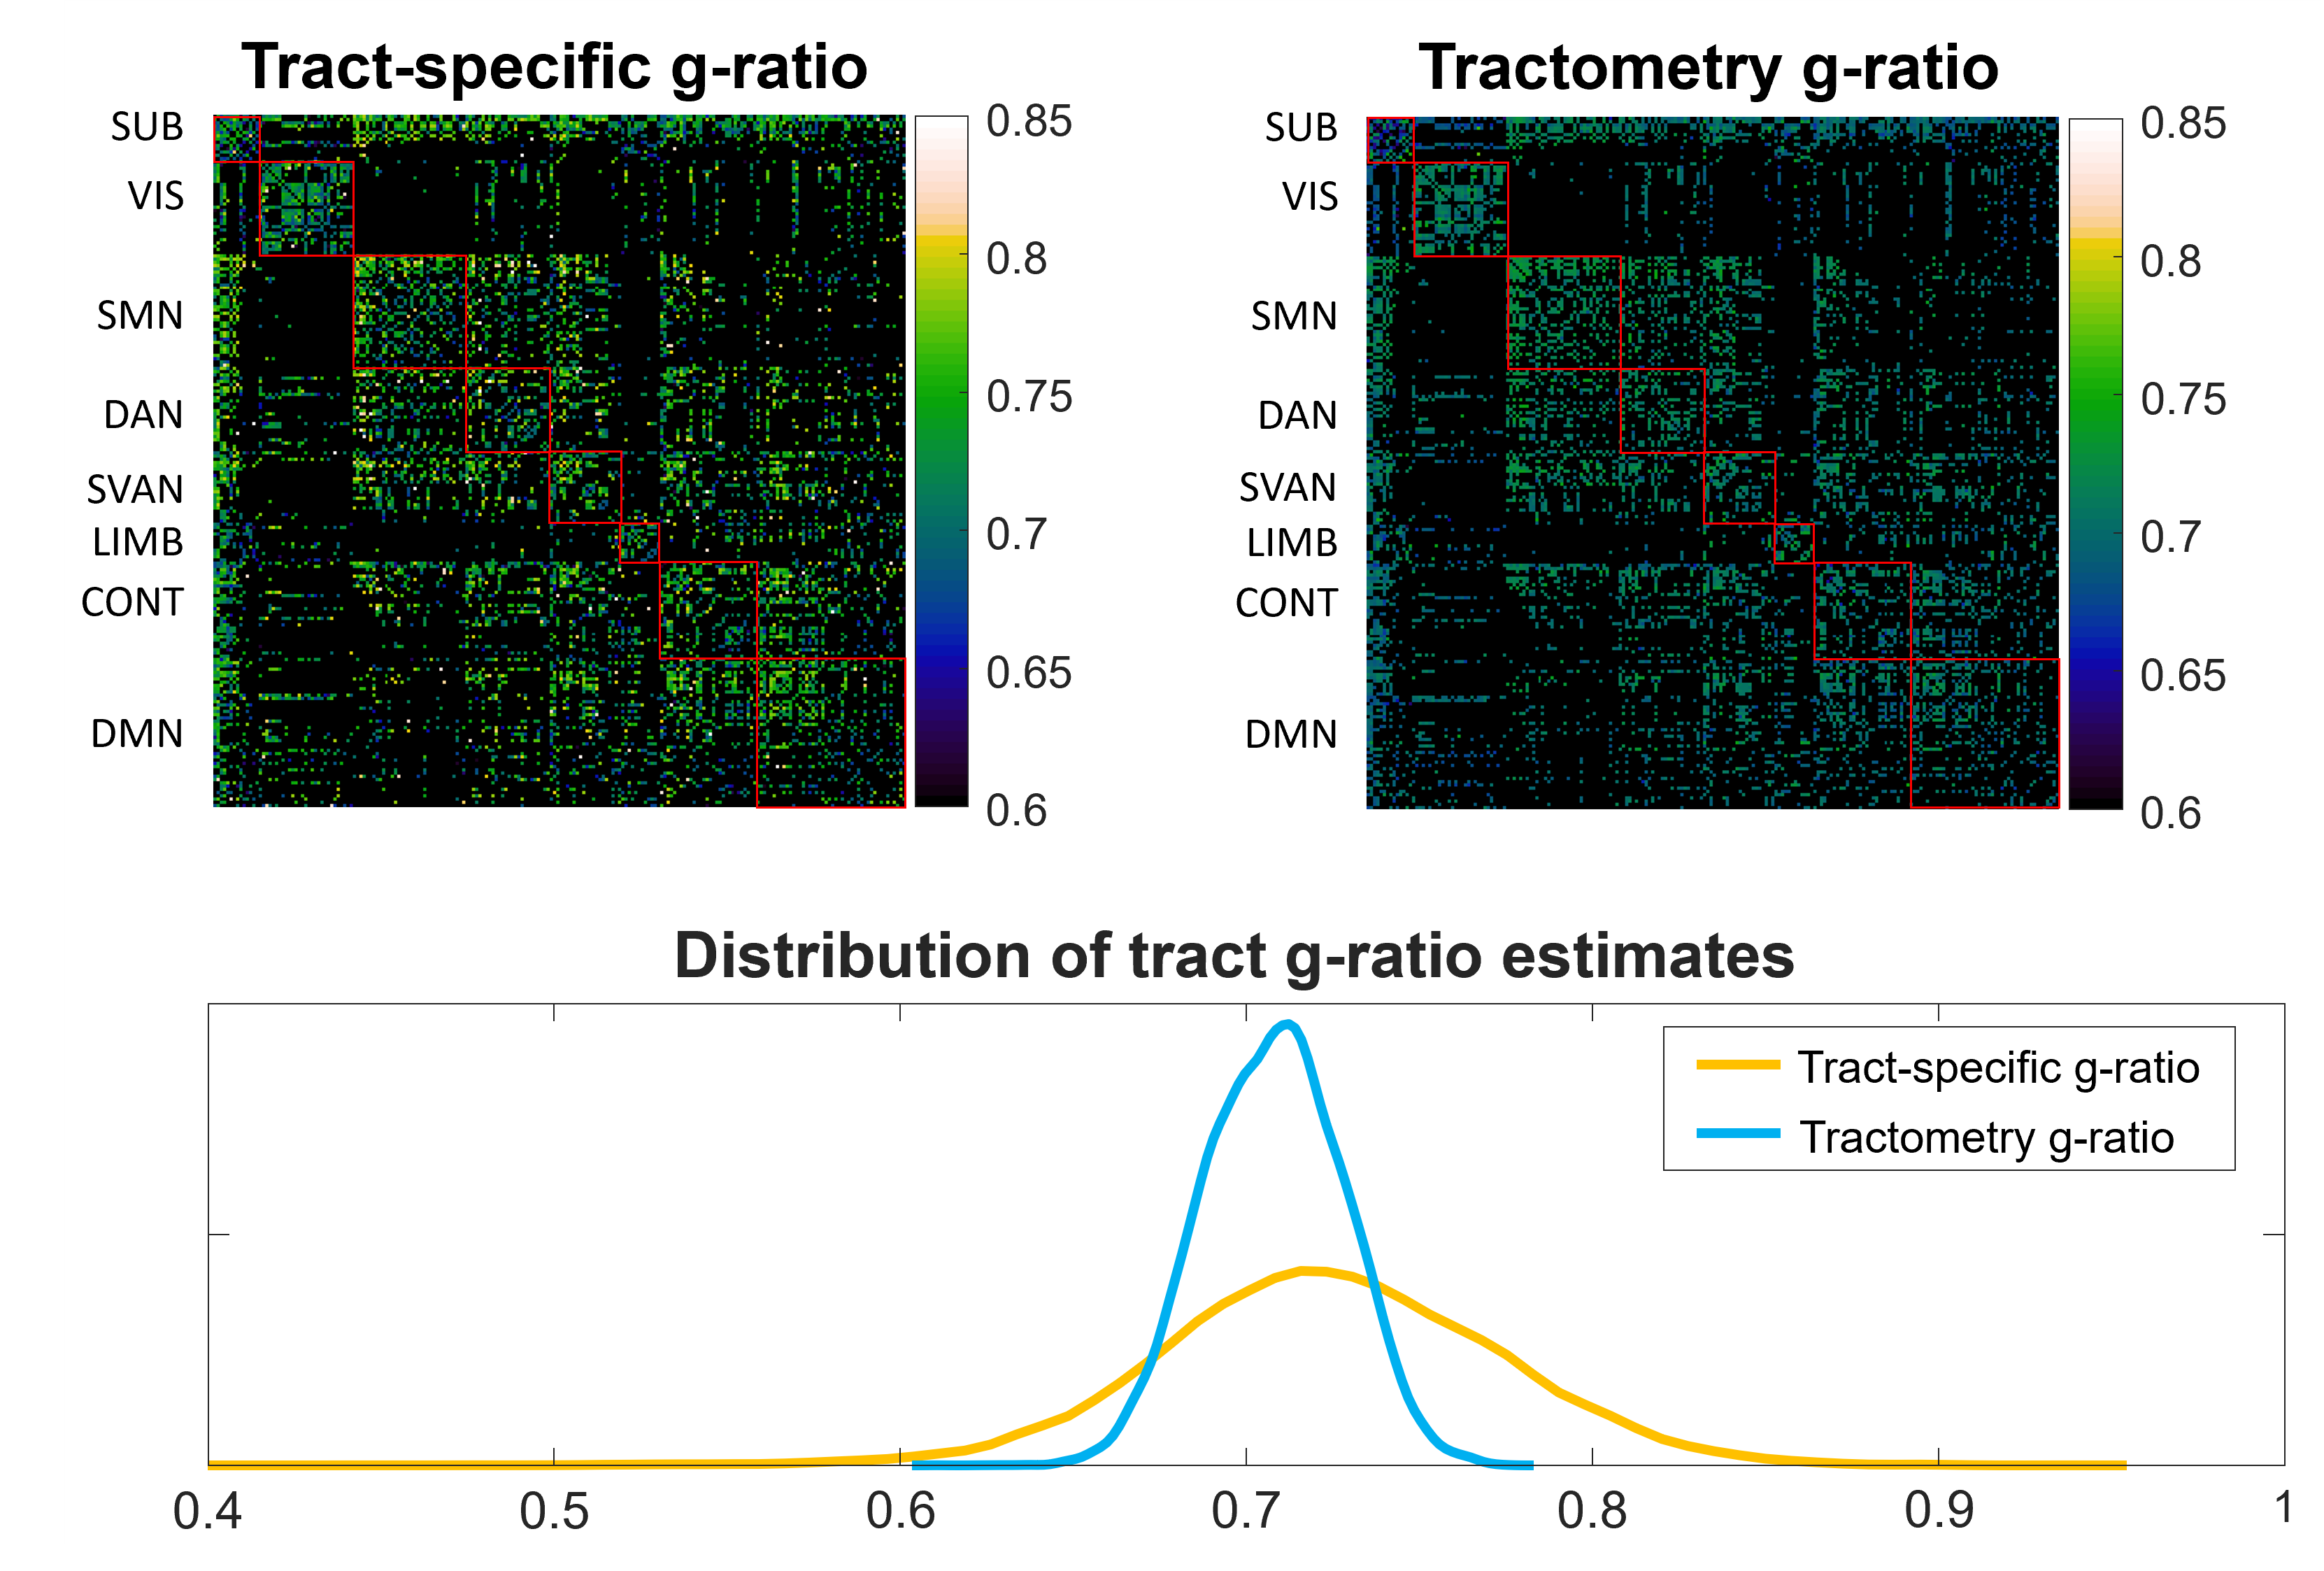
The group-level g-ratio connectivity matrices and distribution of g-ratio estimates are presented in Figure 2. The tract-specific data is characterized by a greater dynamic range in comparison to tractometry. This is expected due to the removal of partial volume effects that cause a smoothing effect in tractometry, as seen in previous work where the g-ratio of multiple tracts are very similar4,16.The repeatability of tract-specific g-ratio estimates is high for medium to large caliber tracts. As shown in Figure 3, the small caliber tracts do not yield repeatable g-ratio estimates and are therefore excluded from subsequent analyses. The remaining 20% of the tracts are very repeatable with a scan-rescan correlation coefficient of 0.651, with the Bland-Altman plot indicating good levels of agreement between scan-rescan. The repeatability of tractometry is higher at the cost of anatomical specificity.
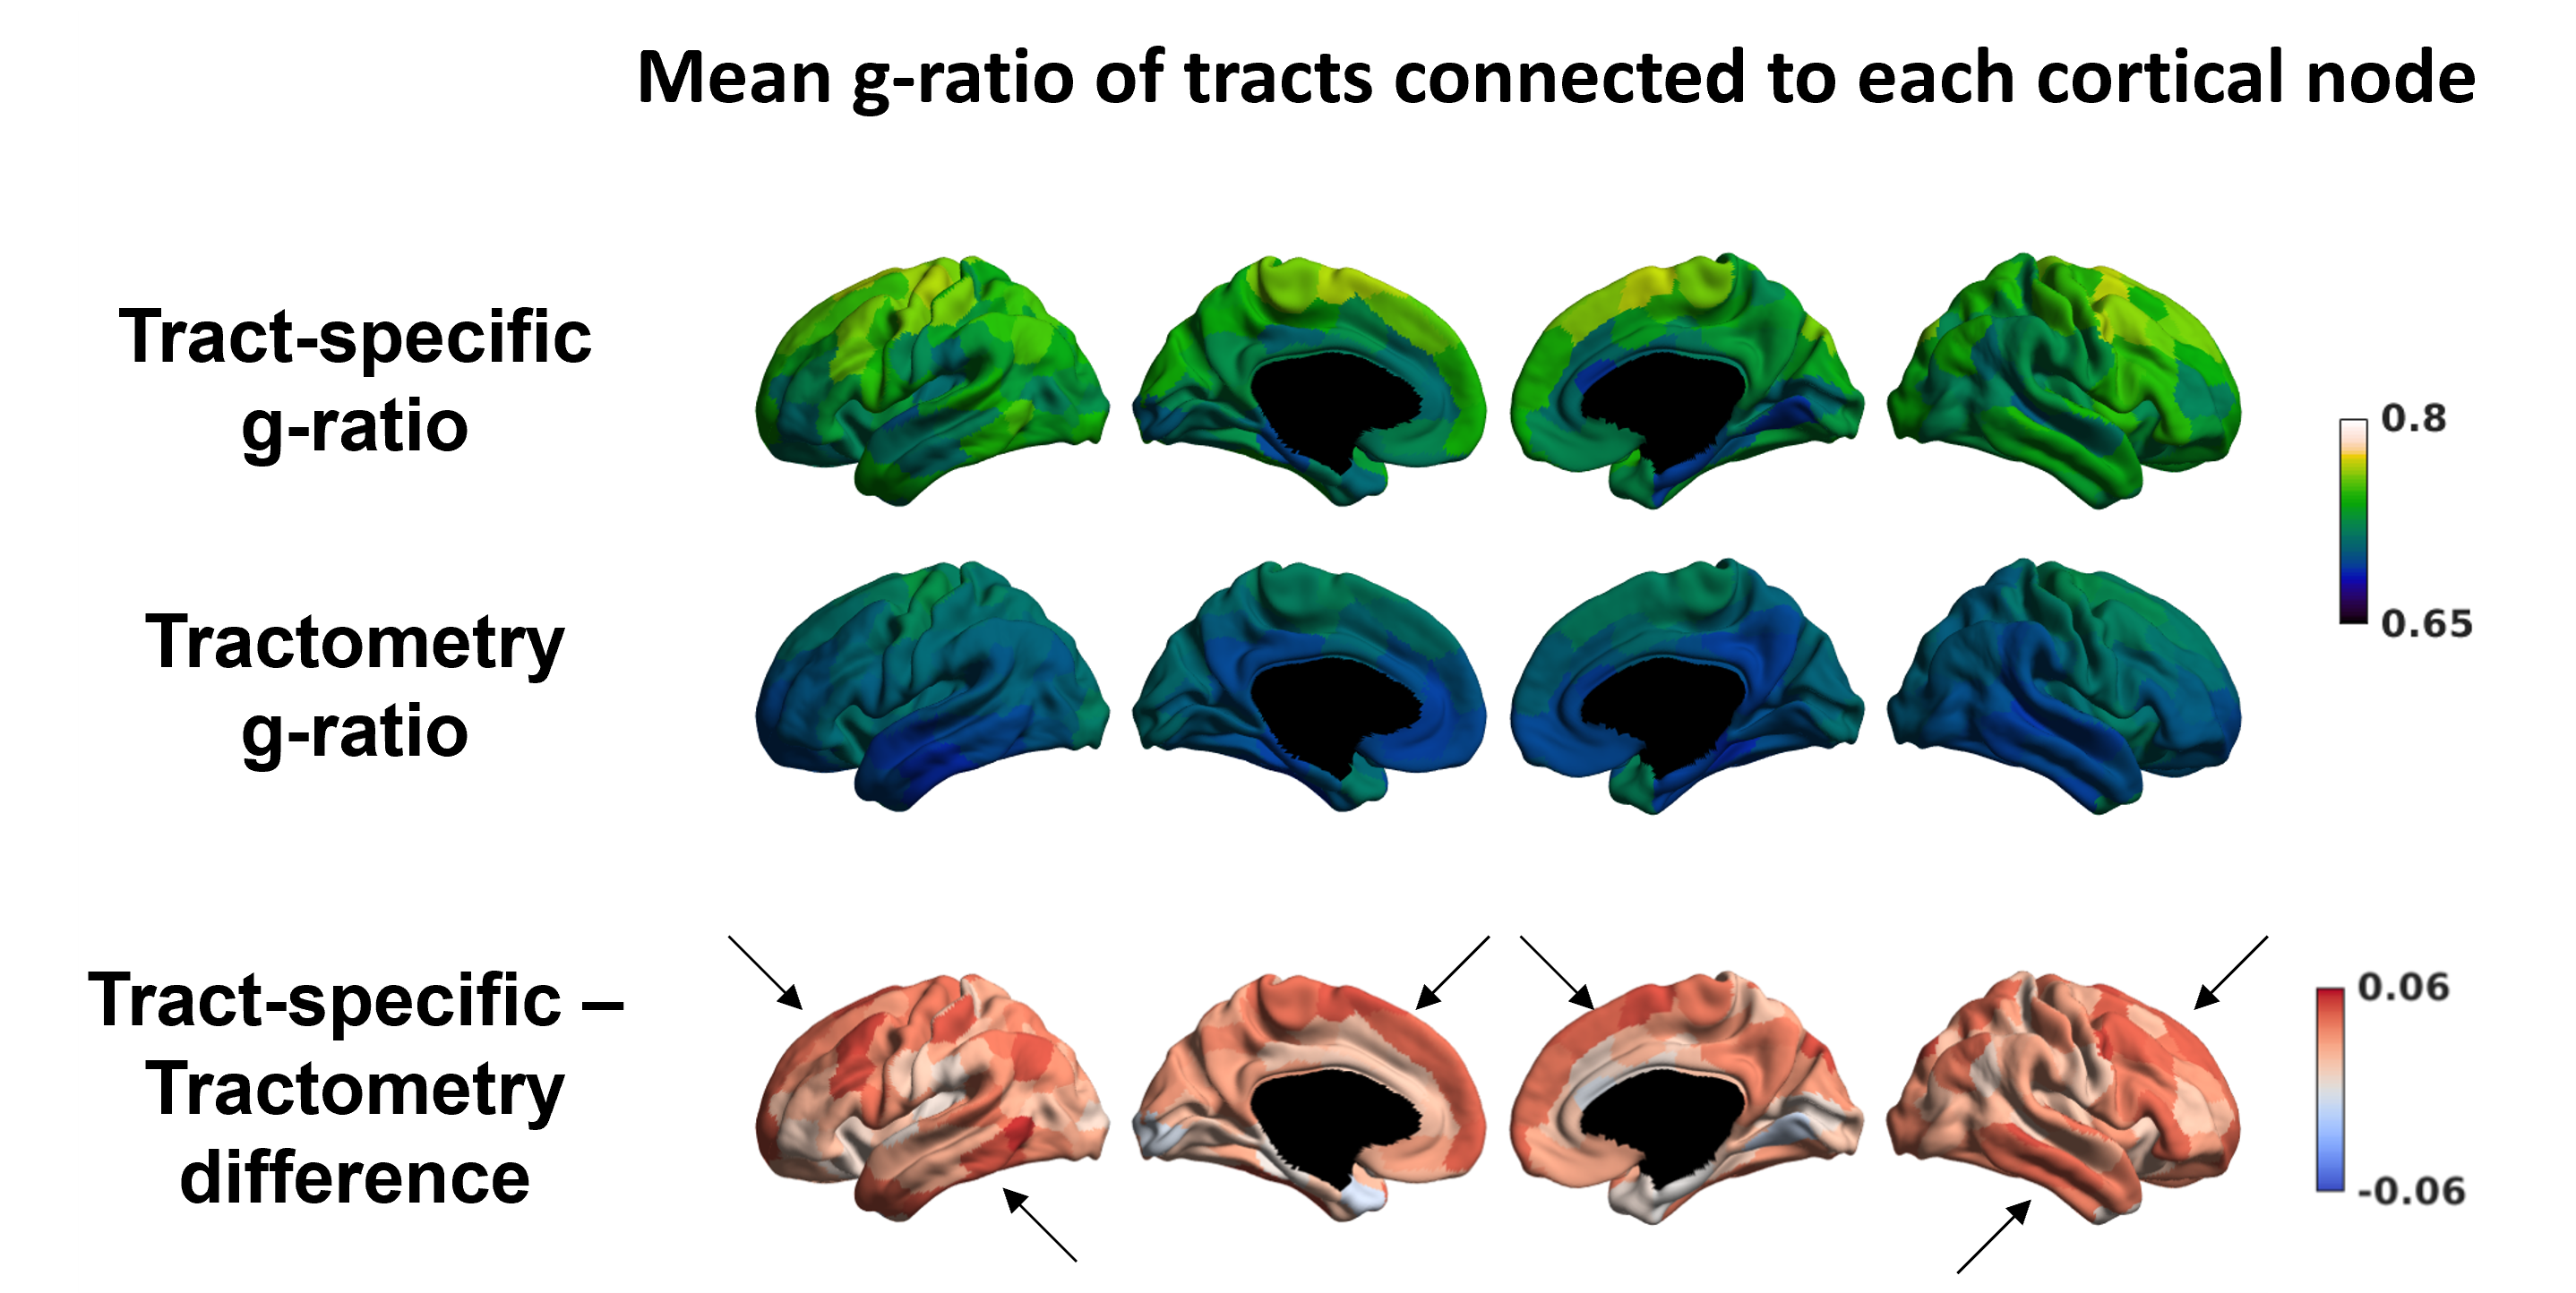
Figure 4 illustrates a group cortical representation of the mean g-ratio of the tracts connected to each node17. The differences between tract-specific and tractometry g-ratio are greatest in the temporal and frontal regions.
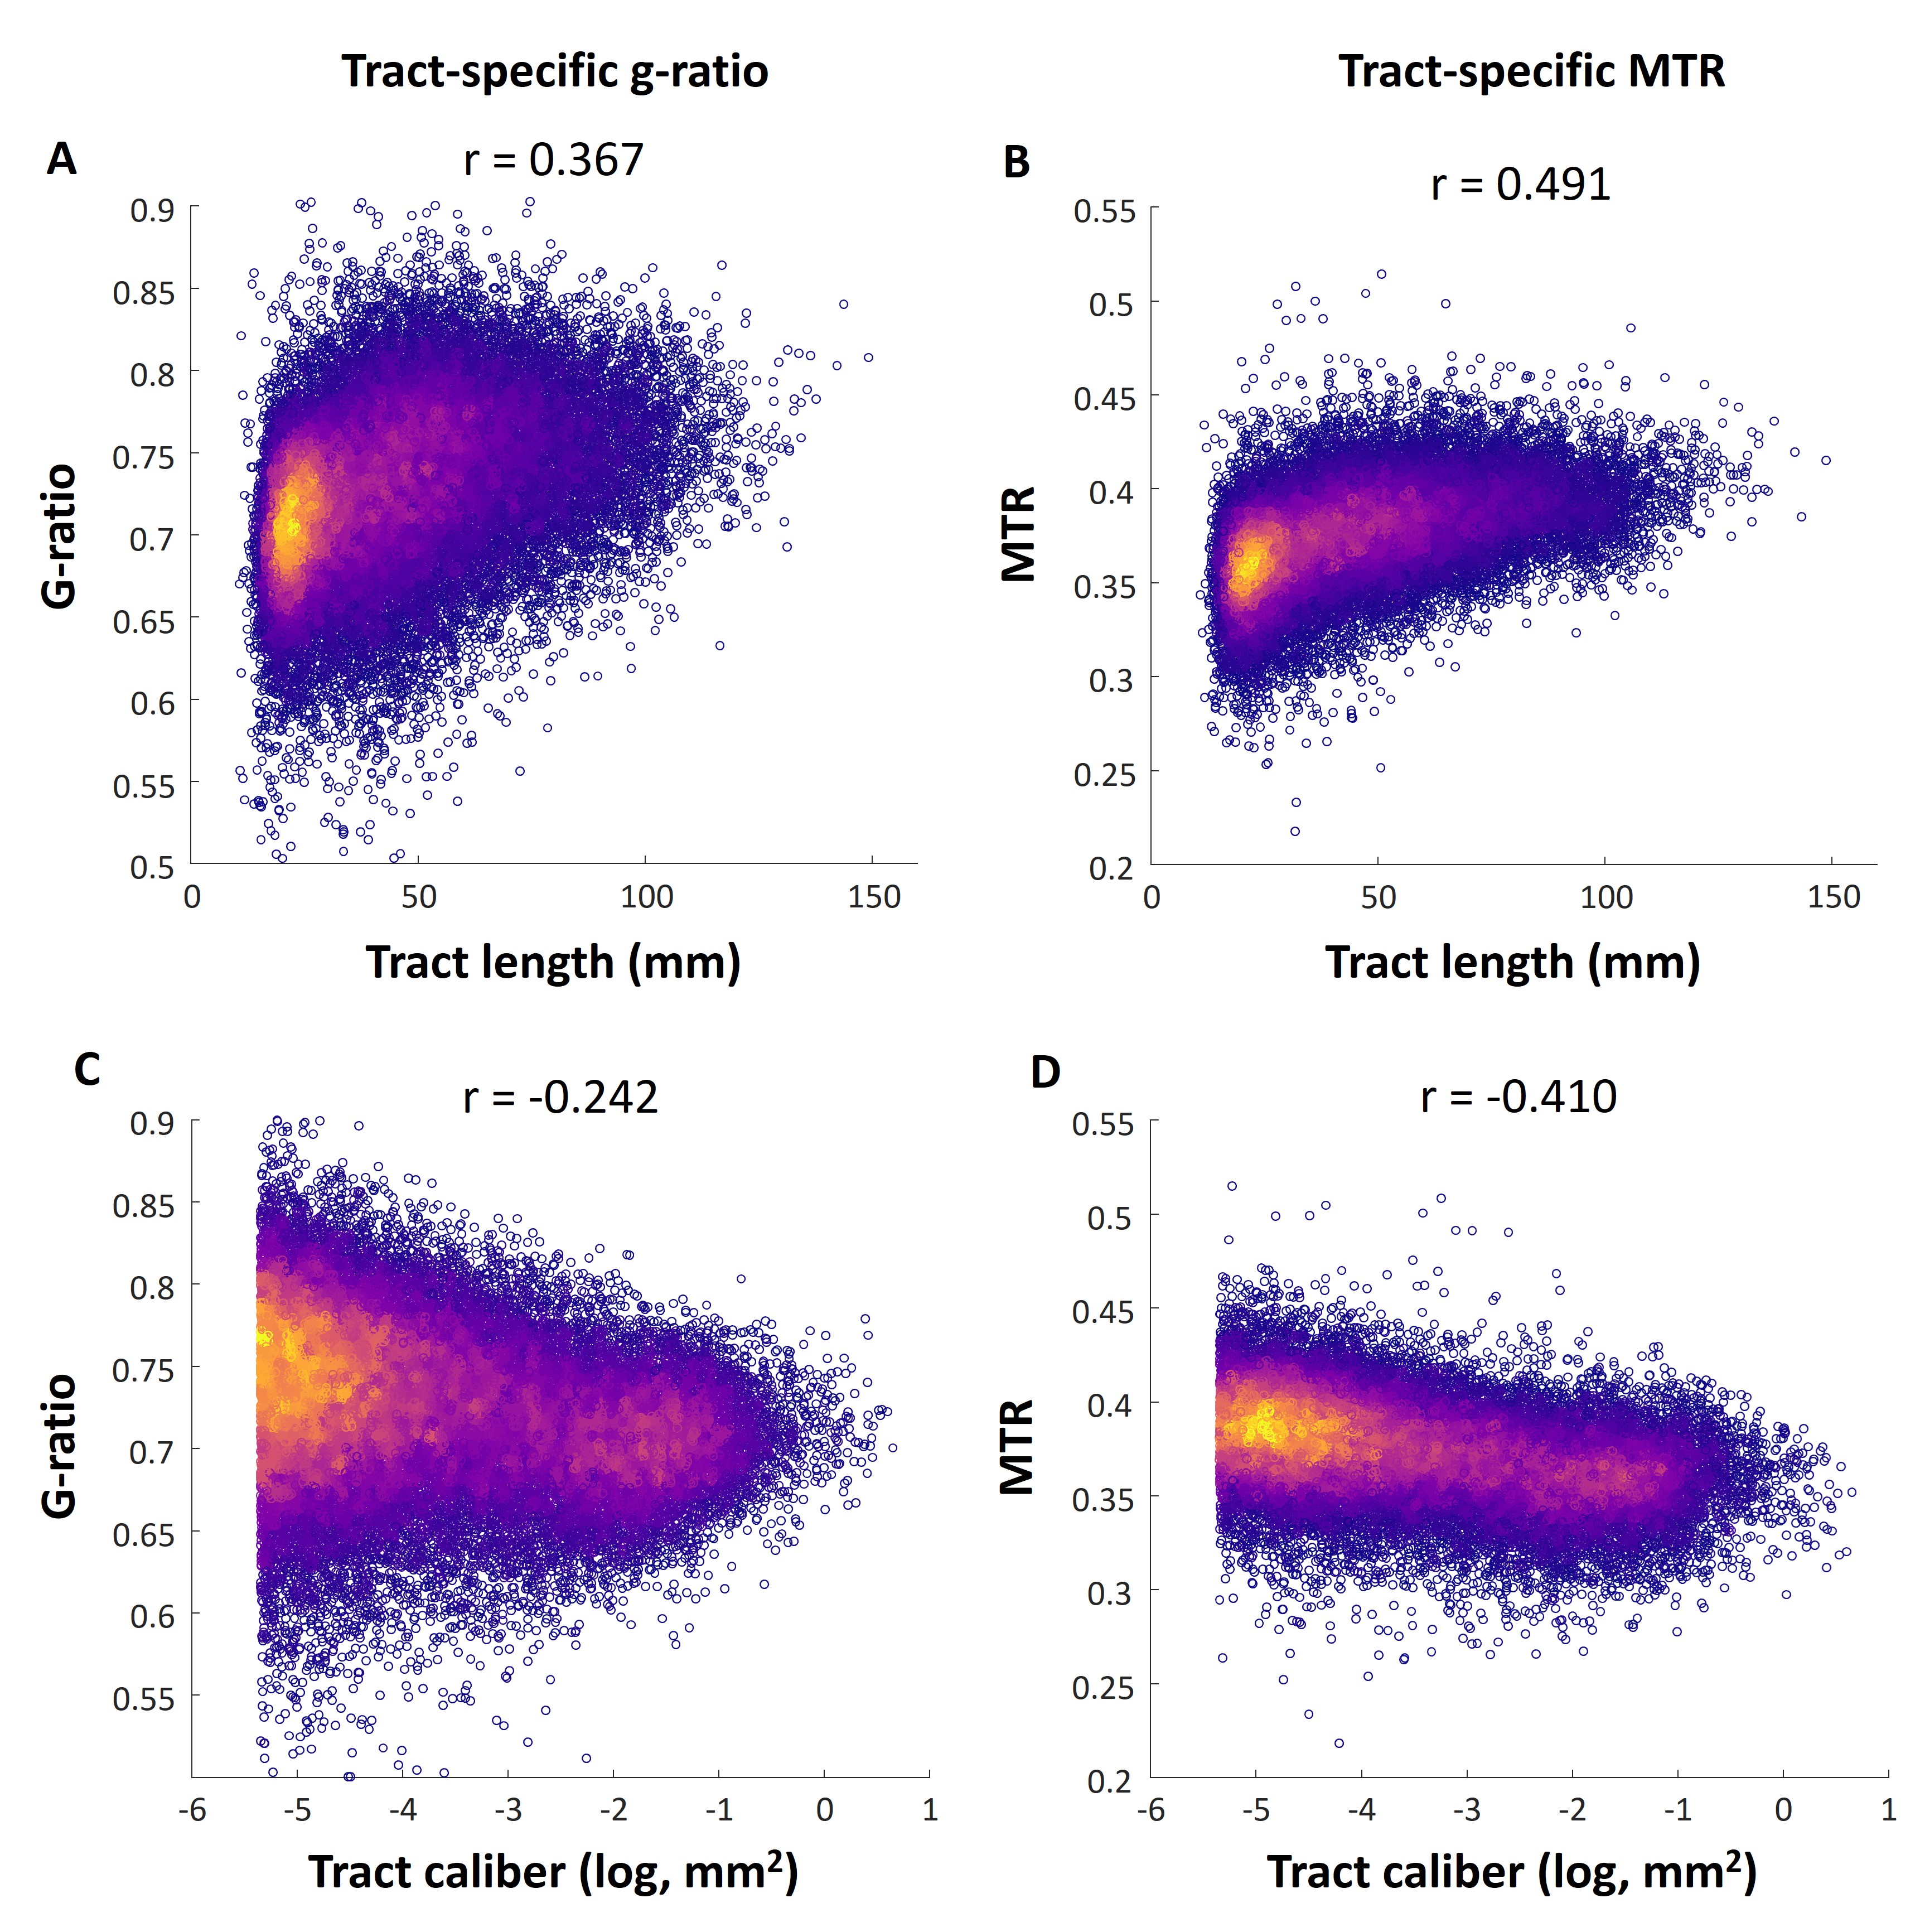
We observe a relationship between tract-specific g-ratio and tract length and caliber in Figure 5: g-ratio is higher for longer tracts and lower for tracts with larger caliber. These results imply that the longer and smaller caliber tracts are associated with thinner myelin sheaths relative to axon caliber. This relationship is not seen in the case of tractometry where g-ratio does not change with respect to both tract length and caliber.
Conclusion
Our novel processing pipeline produced tract-specific g-ratio connectivity matrices with a wider g-ratio dynamic range compared to conventional g-ratio tractometry. Tracts connected to frontal and temporal regions showed the greatest differences with tractometry. By disentangling the g-ratio of tracts crossing throughout the brain, we were able to detect relationships between g-ratio and tract length and caliber that were previously concealed.Acknowledgements
This work was supported by: the Quebec Bio-Imaging Network, the Transforming Autism Care Consortium, the Montreal Neurological Institute, the Brain Canada Foundation, Healthy Brains for Healthy Lives, and Fonds de Recherche du Québec - Santé.References
1. S. Bells et al., "Tractometry–comprehensive multi-modal quantitative assessment of white matter along specific tracts," in Proc. ISMRM, 2011, vol. 678, p. 1.
2. E. Messaritaki et al., "Predicting MEG resting-state functional connectivity from microstructural information," Network Neuroscience, vol. 5, no. 2, pp. 477-504, 2021.
3. T. Boshkovski et al., "The R1-weighted connectome: complementing brain networks with a myelin-sensitive measure," Network Neuroscience, vol. 5, no. 2, pp. 358-372, 2021.
4. D. A. Slater, L. Melie‐Garcia, M. Preisig, F. Kherif, A. Lutti, and B. Draganski, "Evolution of white matter tract microstructure across the life span," Human brain mapping, vol. 40, no. 7, pp. 2252-2268, 2019.
5. B. Jeurissen, A. Leemans, J. D. Tournier, D. K. Jones, and J. Sijbers, "Investigating the prevalence of complex fiber configurations in white matter tissue with diffusion magnetic resonance imaging," (in eng), Hum Brain Mapp, vol. 34, no. 11, pp. 2747-66, Nov 2013, doi: 10.1002/hbm.22099.
6. S. Schiavi et al., "Bundle myelin fraction (BMF) mapping of different white matter connections using microstructure informed tractography," Neuroimage, vol. 249, p. 118922, 2022.
7. A. Daducci, A. Dal Palù, A. Lemkaddem, and J. P. Thiran, "COMMIT: Convex optimization modeling for microstructure informed tractography," (in eng), IEEE Trans Med Imaging, vol. 34, no. 1, pp. 246-57, Jan 2015, doi: 10.1109/tmi.2014.2352414.
8. S. Schiavi et al., "A new method for accurate in vivo mapping of human brain connections using microstructural and anatomical information," Science advances, vol. 6, no. 31, p. eaba8245, 2020.
9. N. Stikov et al., "Bound pool fractions complement diffusion measures to describe white matter micro and macrostructure," (in eng), Neuroimage, vol. 54, no. 2, pp. 1112-21, Jan 15 2011, doi: 10.1016/j.neuroimage.2010.08.068.
10. N. Stikov et al., "In vivo histology of the myelin g-ratio with magnetic resonance imaging," (in eng), Neuroimage, vol. 118, pp. 397-405, Sep 2015, doi: 10.1016/j.neuroimage.2015.05.023.
11. J. S. Campbell et al., "Promise and pitfalls of g-ratio estimation with MRI," Neuroimage, vol. 182, pp. 80-96, 2018.
12. R. R. Cruces et al., "Micapipe: a pipeline for multimodal neuroimaging and connectome analysis," Neuroimage, vol. 263, p. 119612, 2022.
13. J. D. Tournier, F. Calamante, and A. Connelly, "Improved probabilistic streamlines tractography by 2nd order integration over fibre orientation distributions," in Proceedings of the international society for magnetic resonance in medicine, 2010, vol. 1670: John Wiley & Sons, Inc, New Jersey.
14. S. Mohammadi et al., "Whole-brain in-vivo measurements of the axonal g-ratio in a group of 37 healthy volunteers," Frontiers in neuroscience, vol. 9, p. 441, 2015.
15. A. Schaefer et al., "Local-global parcellation of the human cerebral cortex from intrinsic functional connectivity MRI," Cerebral cortex, vol. 28, no. 9, pp. 3095-3114, 2018.
16. M. Mancini et al., "Introducing axonal myelination in connectomics: A preliminary analysis of g-ratio distribution in healthy subjects," NeuroImage, vol. 182, pp. 351-359, 2018.
17. R. Vos de Wael et al., "BrainSpace: a toolbox for the analysis of macroscale gradients in neuroimaging and connectomics datasets," Communications biology, vol. 3, no. 1, p. 103, 2020.
Figures