3659
Treatment Monitoring of Irreversible Electroporation in a Potato Model with a two-shot CP/CPMG-RARE Sequence and Spiral Sampling1Institute of Diagnostic and Interventional Radiology, Hannover Medical School, Hannover, Germany, 2Research Campus Stimulate, Magdeburg, Germany, 3Department of Healthcare Telematics and Medical Engineering, Otto-von-Guericke University, Magdeburg, Germany, 4Department of High-Frequency- and Communication Technologies, Otto-von-Guericke University, Magdeburg, Germany, 5Department of Biomedical Magnetic Resonance, Otto-von-Guericke University, Magdeburg, Germany
Synopsis
Keywords: MR-Guided Interventions, MR-Guided Interventions, Irreversible Electroporation
Motivation: Treatment monitoring of irreversible electroporation (IRE) is only feasible on small animal MRI systems.
Goal(s): Demonstrate Current Density Imaging capabilities of the two-shot CP/CPMG-RARE with spiral sampling by monitoring IRE of a potato in a clinical MR scanner.
Approach: A potato is irreversibly electroporated, while the two-shot CP/CPMG-RARE sequence is acquiring. The electric field is simulated, and the current density is projected using the MRCI toolbox. T1 maps are calculated from inversion recovery sequences.
Results: Simulated and projected current density fields are in good agreement. IRE monitoring in single slices is feasible in clinical MR scanners in optimal conditions.
Impact: Irreversible Electroporation is a promising non-thermal ablation therapy without in-situ validation available. This work presents a step towards implementing treatment monitoring on clinical MR scanners utilizing a two-shot CP/CPMG-RARE with spiral sampling as Current Density Imaging sequence.
Introduction
Most ablative interventions are thermal ablations, with the primary method of cell destruction being heat-induced coagulation necrosis. Irreversible electroporation (IRE) is raising increasing interest. It causes irreversible cell membrane defects, leading to cell destruction by apoptosis. Therefore, it is commonly labeled a non-thermal ablative modality despite heat-induced destruction being partially observed1.Currently, clinical treatment planning of IRE is based on simulations without in-situ validation of the applied electrical fields2. Current density imaging (CDI) with Cartesian sampled two-shot CP/CPMG-RARE (Carr-Purcell/Carr-Purcell-Meiboom-Gill Rapid Acquisition with Relaxation Enhancement) imaging has been shown to allow intra-operative treatment monitoring on small animal MR systems3. Transferring the Cartesian two-shot CP/CPMG-RARE to clinical MR systems is challenging as the long echo train length (ETL) leads to significant signal decay. Thus, a large field of view (FoV) does not appear feasible with adequate image quality. The presented two-shot CP/CPMG-RARE with spiral sampling significantly reduces the ETL due to more efficient k-space sampling. The CDI capabilities of the sequence are demonstrated by monitoring the IRE of a potato in a clinical MR.
Methods
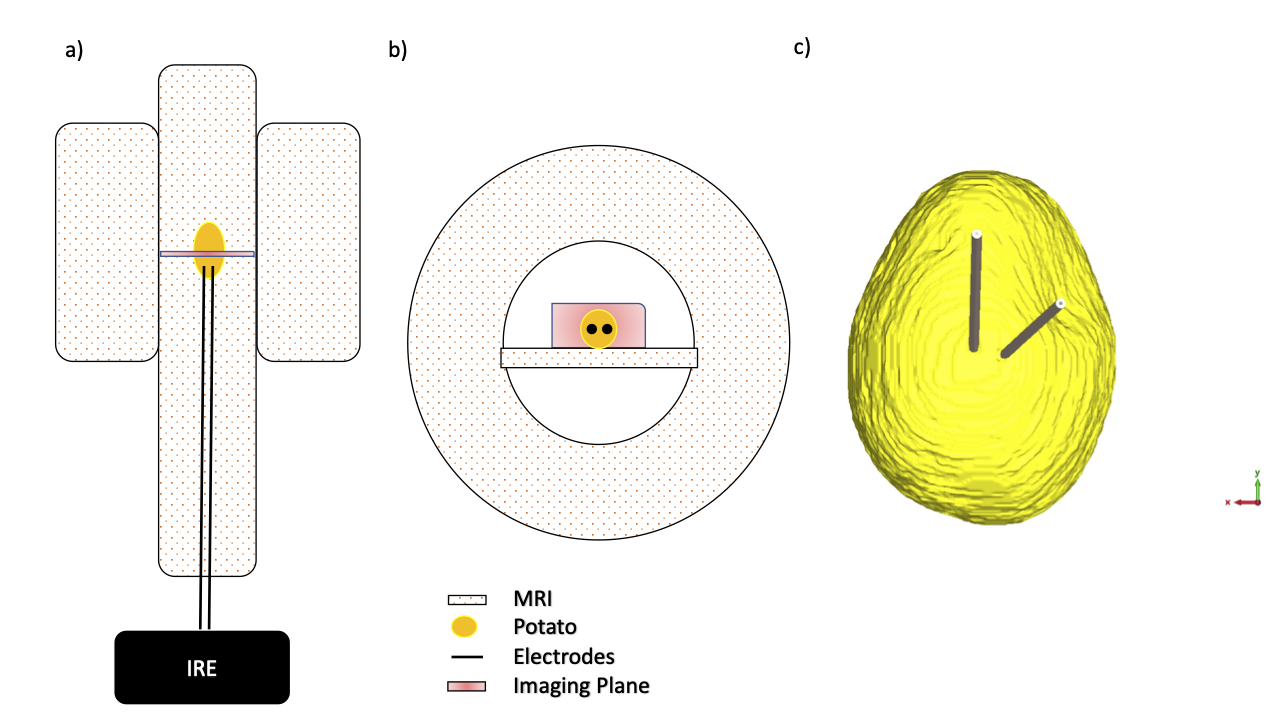
To monitor the application of the IRE pulses in a potato (Solanum tuberosum var. Belana), we have implemented a triggered two-shot CP/CPMG-RARE with spiral sampling4 (FoV: 240x240x4 mm3, TE: 10 ms, resolution: 1.5x1.5x4 mm3, center of imaged plane 4mm below the electrodes) on a Siemens Skyra (Siemens Healthineers, Germany). The echo train of the first shot strictly coheres to Carr-Purcell-Meiboom-Gill (CPMG) conditions. The second shot’s echo train purposefully violates these conditions because the excitation pulse’s phase equals the refocusing pulses' phase3 (CP conditions). The images are combined to calculate magnetic field maps (Bz) from the phase variations originating from B0 off-resonances. The MR sequence triggers the IRE generator5 between the excitation and first refocusing pulse, which applies an electric field (1000 V/cm, frequency 5 kHz, 50% duty cycle, 70 pulses). The experimental setup is shown in [Fig. 1 a)/b)].The applied electric field was simulated in a CAD model [Fig. 1c)], created after manual segmentation of the potato and the electrodes using 3D gradient echo imaging and ITKsnap6, utilizing the LF-time-domain-EQS-solver of the commercially available software CST (Dassault Systèmes, France). The current density images were calculated using the Bz-maps, the electromagnetic field simulations, and the projected current density algorithm of the MRCI toolbox7.
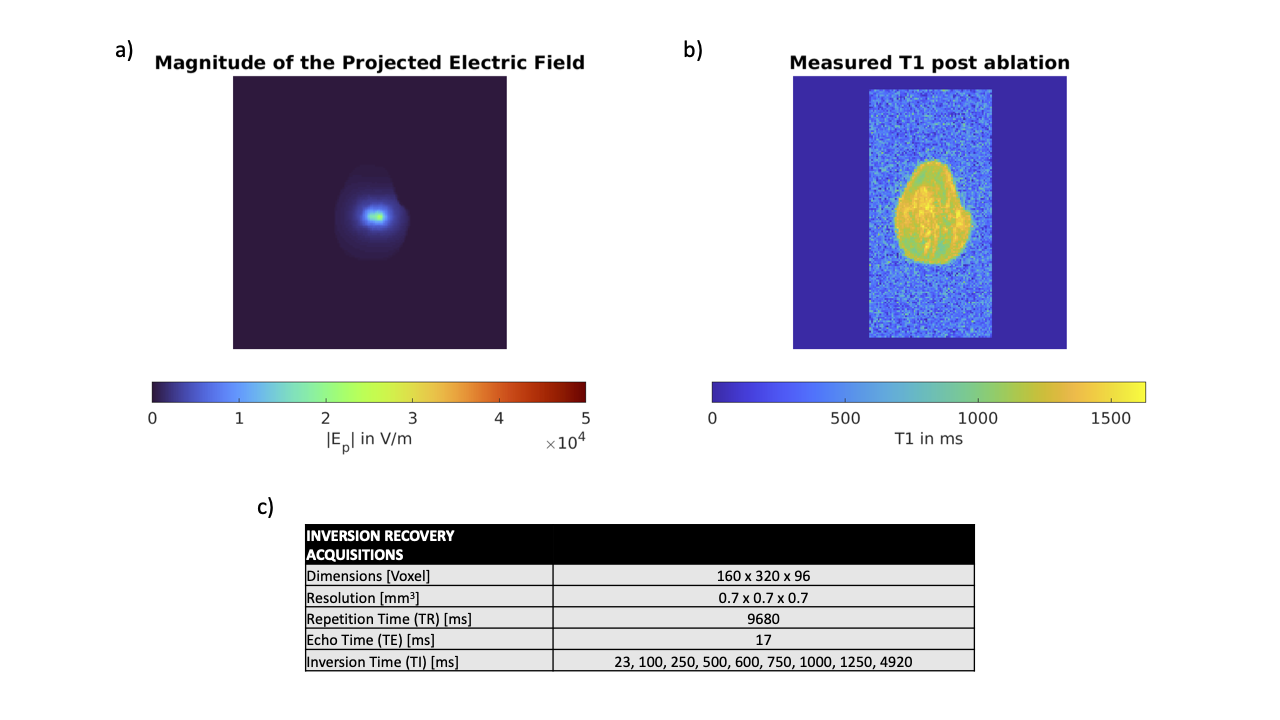
The T1 relaxation of irreversibly electroporated potato decreases by approximately 30%8. Therefore, T1 maps of the potato using inversion recovery acquisitions (IR) with varying inversion times (TI) [Fig.5 c)] were created approximately four hours after electroporation.
Results
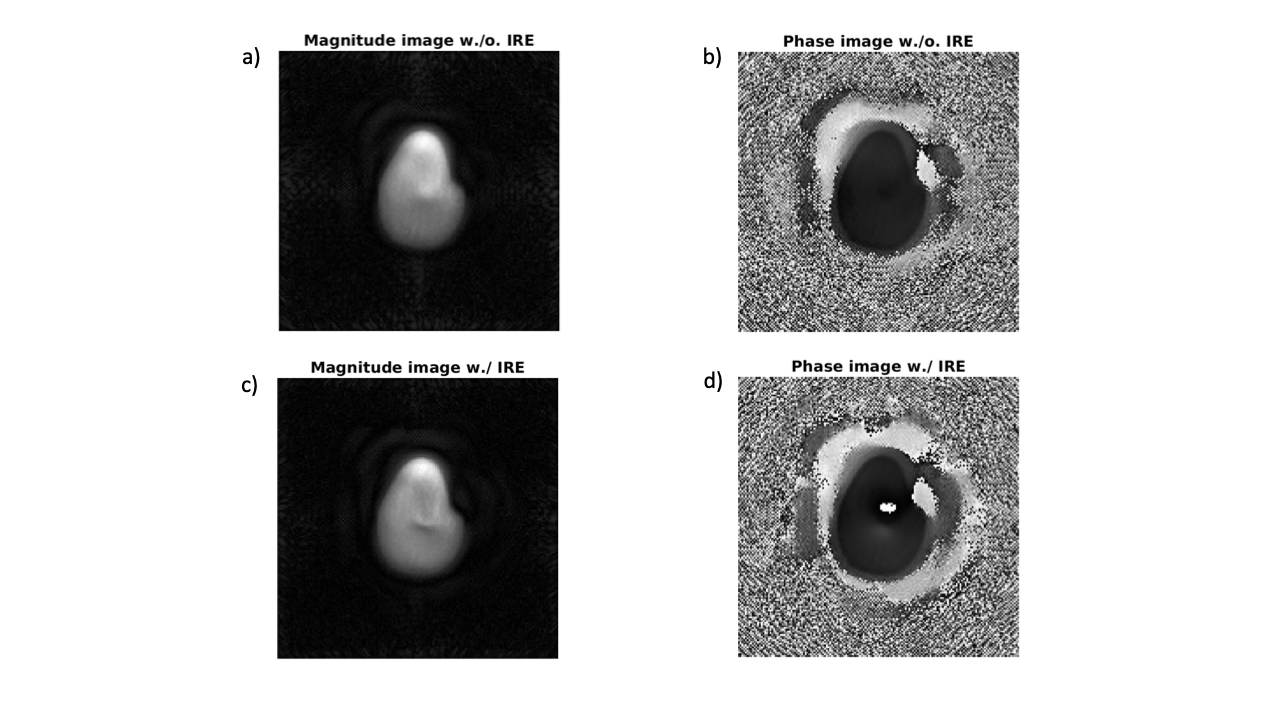
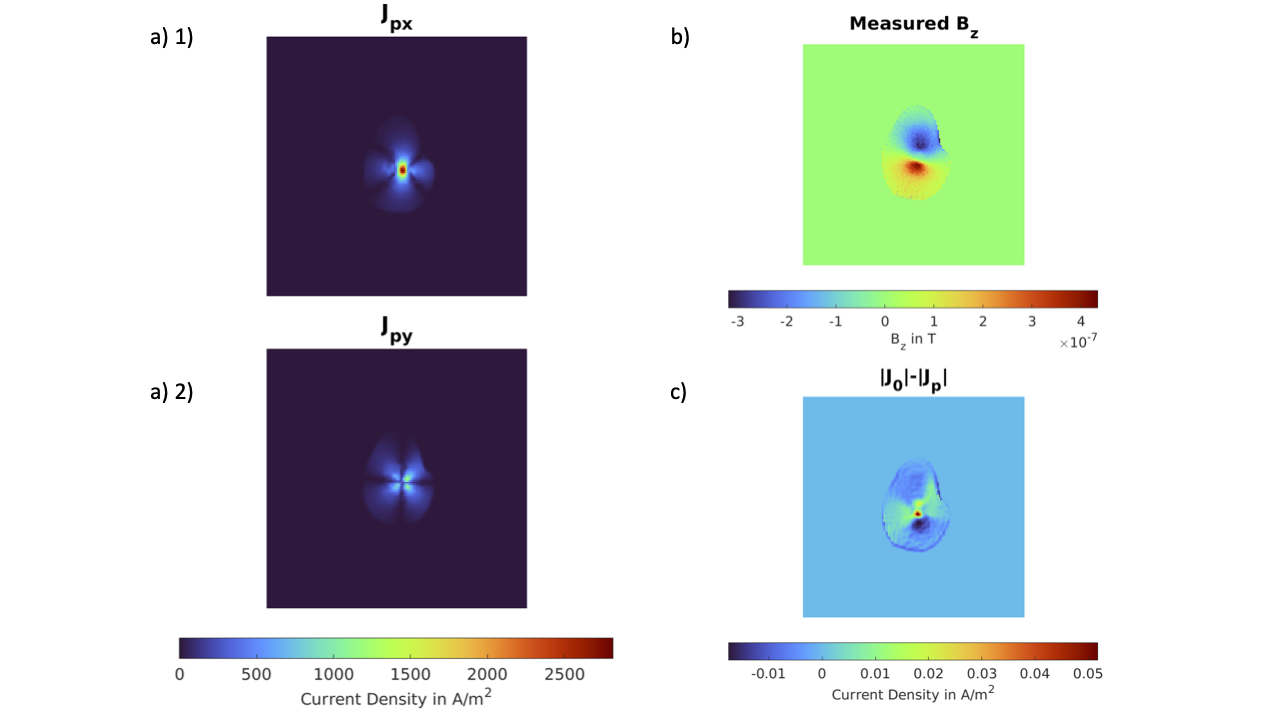
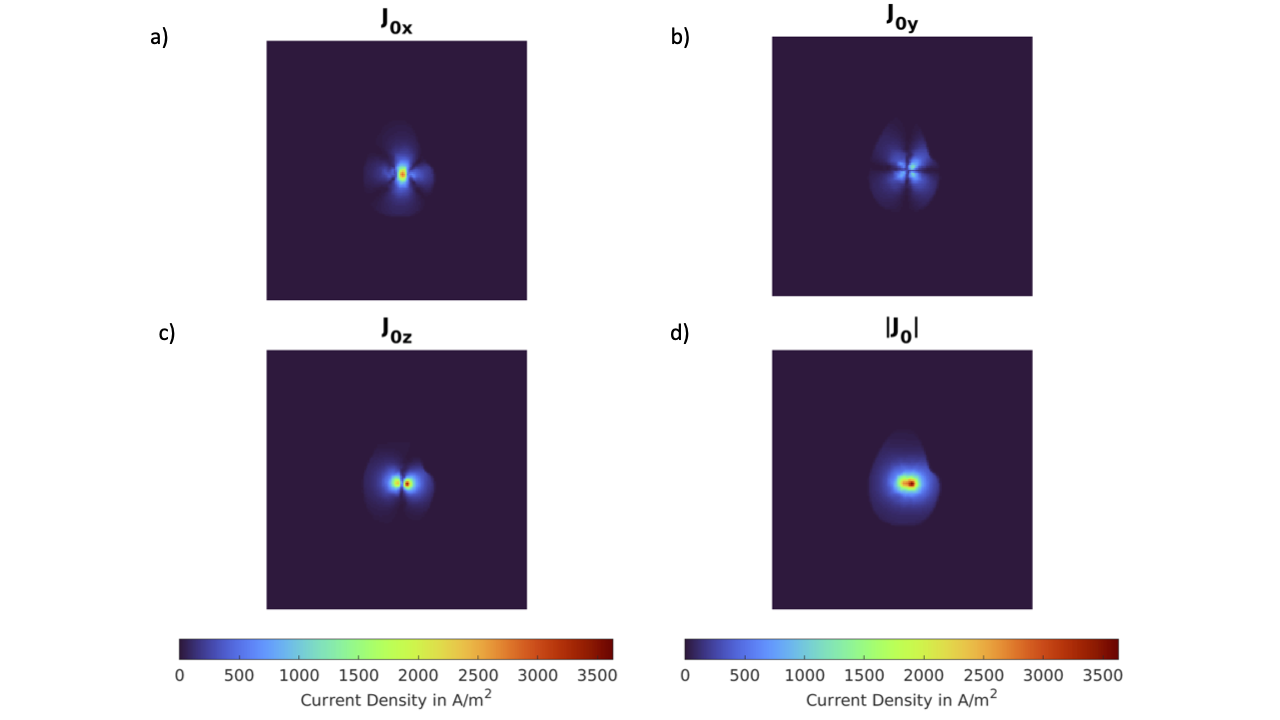
Without the IRE generator active, the magnitude image of the two-shot CP/CPMG-RARE shows minor artifacts [Fig. 2 a), c)]. If IRE pulses are applied, the induced magnetic field is visible in the magnitude and phase image [Fig 2 b) d)]. The calculated Bz-map [Fig. 3 b)] is consistent with the results from the simulation. Further, the deduction of the projected [Fig. 3. a) 1), 2)] and simulated current densities [Fig. 4] shows only minor differences [Fig. 3 c)]. Using that discoloration due to electroporation in a potato occurs at approximately 530 V/cm9, the projected current density algorithm predicts no ablated tissue in the imaged slice [Fig. 5) a)]. After four hours, T1 maps of the potato show T1 values greater than 900 ms [Fig. 5) b)].Discussion
The image quality of the two-shot CP/CPMG-RARE is acceptable. CDI only detects effects in the MR scanner’s x-y plane, as MRI only detects changes in magnetization along the B0-axis. Due to the orthogonality of electric and induced magnetic fields, only the x and y components can be measured. The experimental setup was chosen to maximize the effects of IRE pulses as the current flows mainly in the MR scanner's x-y-plane. Potatoes, with their homogeneous interior structure, were used for simulations, which agreed with the projected current density. T1 maps showed no significant T1 decrease in the imaging plane, indicating that the electroporation area did not extend into the imaged plane.Conclusion
The two-shot CP/CPMG-RARE with spiral sampling enables monitoring IRE on clinical MRI scanners. CDI and T1 mapping agree that no changes are induced in the imaged potato slice. Future work will involve more challenging setup geometries with the imaging plane closer to the electrodes and focus on improving image quality and acquiring multiple slices.Disclaimer
The author, M.J. Hubmann, is employed at Siemens Healthcare GmbH, Germany. His contributions to this work are unrelated to his employment at Siemens Healthcare.Acknowledgements
This work was funded by the (German) Federal Ministry of Education and Research within the Research Campus STIMULATE under the numbers ‘13GW0473A’ and ‘13GW0473B’.References
[1] Siddiqui I.A. et al. Induction of rapid, reproducible hepatic ablations using next-generation, high frequency irreversible electroporation (H-FIRE) in vivo. HPB. 2016; doi:10.1016/j.hpb.2016.06.015
[2] Kranjc M. et al. Predicting irreversible electroporation-induced tissue damage by means of magnetic resonance electrical impedance tomography. Sci Rep. 2017; doi:10.1038/s41598-017-10846-5
[3] Serša I et al. Current density imaging sequence for monitoring current distribution during delivery of electric pulses in irreversible electroporation. BioMed Eng OnLine. 2015; doi:10.1186/1475-925X-14-S3-S6
[4] Hennig J et al. Single shot spiral TSE with annulated segmentation. Magnetic Resonance in Med. 2022; doi:10.1002/mrm.29224
[5] Hubmann J. et al. Design of a System for Magnetic-Resonance-Guided Irreversible Electroporation, 2021 43rd Annual International Conference of the IEEE Engineering in Medicine & Biology Society (EMBC); doi: 10.1109/EMBC46164.2021.9630723.
[6] Yushkevich P.A. et al. User-guided 3D active contour segmentation of anatomical structures: Significantly improved efficiency and reliability. Neuroimage 2006; doi: 10.1016/j.neuroimage.2006.01.015
[7] Sajib S. et al. Software Toolbox for Low-Frequency Conductivity and Current Density Imaging Using MRI. IEEE Trans Biomed Eng. 2017; doi:10.1109/TBME.2017.2732502
[8] Thomas A et al. Finding an effective MRI sequence to visualise the electroporated area in plant-based models by quantitative mapping. Bioelectrochemistry. 2023; doi:10.1016/j.bioelechem.2023.108463
[9] Sieni, Elisabetta et al. (2018). Effect of tissue inhomogeneity on electric field intensity for electrochemotherapy treatment.
Figures
Ablation and IR parameters. A) shows the magnitude of the applied electric field during an IRE pulse calculated with the projected current density. A value of |E| >5e+04 V/m would indicate ablation. B) shows the T1 map calculated with an inversion recovery sequence with the varying inversion times shown in c). A focal decrease of 30% would indicate ablation8. Ablation is neither predicted in a) nor seen in b).