3654
Application of a deep learning reconstruction to routine liver 3D LAVA-Flex acquisitions1GE HealthCare, Boston, MA, United States, 2Department of Radiology, Massachusetts General Hospital, Boston, MA, United States, 3GE HealthCare, Waukesha, WI, United States
Synopsis
Keywords: Liver, Liver, LAVA-Flex, 3D FLEX DL
Motivation: Fat suppressed T1 images, such as LAVA-FLEX, are routinely used in liver imaging, but can suffer from SNR and IQ issues.
Goal(s): Our goal was to validate application of 3D deep learning to 3D LAVA-FLEX in routine adult liver imaging via a reader study and noise characterization.
Approach: DL and conventionally reconstructed images were assessed across several IQ attributes (motion, ringing, edge, vessel) by two radiologists. Noise characteristics were evaluated by calculation of total variation and edge detection.
Results: Based on the calculated odds ratios, the radiologists preferred DL across the various IQ attributes, with decreased noise and improved sharpness in DL images.
Impact: The application of 3D DL to routine 3D LAVA-FLEX imaging provides increased diagnostic quality, and has the potential to improve routine abdominal care in patients who can't hold their breath.
Introduction
3D Liver Acquisition with Volume Acceleration – Flex (LAVA-Flex) is a 3D fast spoiled gradient-recalled echo sequence commonly utilized in many abdominal MRI protocols due to its high spatial resolution and short breath-hold times1,2. This sequence utilizes a dual echo acquisition and a 2-point DIXON reconstruction to provide radiologists with up to four sets of images in one acquisition: Water, Fat, In-phase, and Out-of-phase images1. To help further improve the image quality and signal-to-noise ratio, we applied a deep learning (DL) reconstruction aimed at denoising, deringing, and improving image sharpness. Here we present our comparison of DL reconstructed and non-DL reconstructed coronal post-contrast 3D LAVA-Flex abdominal scans with regards to diagnostic quality and noise characteristics.Methods
38 patients underwent 3D LAVA-Flex scans on either a 3T Premier XT (18 patients) or 1.5T Artist (18 patients) MRI system (GE HealthCare, Waukesha, WI, USA) as part of a routine rapid liver protocol exam with Dotarem contrast. The specific parameters varied across the two field strengths, but all acquisitions were acquired post-contrast and in the coronal plane, except for one in the axial plane. In addition, 8 patients were scanned with a shorter breath-hold protocol, for comparison against the routine breath-hold protocol. Detailed parameters are listed in Table 1. A deep learning reconstruction, based on a Convolutional Neural Network (AIR™ Recon DL, GE Healthcare)3 trained on 3D Flex data to remove ringing, reduce noise, and increase sharpness, was used to retrospectively reconstruct the data with 75% noise reduction.Two radiologists independently evaluated the reconstructed images on a 5-point Likert scale, looking at the following characteristics: motion, ringing, edge, vessel, image quality, and whether the images were diagnosable. The images were anonymized so the readers were blinded to the reconstruction method used.
For both DL and non-DL reconstructions, the signal-to-noise ratio (SNR), global and local Total Variation (TV), and global and local number of edges, were calculated. Since lower TV and fewer detected edges correlate with less image noise and increased sharpness, they were the metrics chosen to analyze noise characteristics after application of DL4–6. The global TV was determined by calculating the gradient across each 2D slice (imgradient function in MATLAB 2022b, MathWorks Inc., Natick, MA) and summing across all voxels. The global number of edges was calculated similarly by using the edge function in MATLAB. The local values were calculated as the mean value within the liver of a representative slice.
Odds ratio (via separate ordinal logistic regression models) and unweighted Kappa were used for reader evaluations; paired t-test for quantitative measures with a p-value ≤ 0.05 considered statistically significant.
Results
Readers preferred the DL images over the non-DL images at both 1.5 and 3T. The odds ratio was greater than 1 from both readers across all the IQ characteristics, indicating that DL measures tended to be higher than non-DL measures. The unweighted kappa showed slight to strong agreement depending on the attribute. The effect of DL appeared more pronounced at 1.5T versus 3T, with the average odds ratio ~2x (3.09 vs. 1.55). Visually, the deep learning reconstruction algorithm was able to reduce image noise and improve sharpness, allowing improved visual conspicuity across the abdomen. Table 2 provides a detailed statistical breakdown of the radiologists’ reads.Figures 1 and 2 show the water, gradient, and edge image for both DL and non-DL reconstruction from a patient at 1.5T and 3T, respectively. From quantitative standpoint, the SNR, TV, and number of edges were all significantly different (p < 0.001), with DL images having greater SNR, lower TV and fewer edges detected, both globally and locally. This allowed a shorter BH sequence to be achieved, with application of DL yielding diagnostic quality images compared to the clinically accepted routine BH images in ~40% shorter BH time (~3x odds ratio for DL shorter BH). See Figure 3 for example images.
Discussion and Conclusion
Deep learning reconstruction of 3D LAVA-Flex yielded superior image quality compared to conventional reconstruction method, according to both qualitative interpretation by two radiologists and quantitative analysis of noise. TV and edge analysis revealed the decreased noise and improved sharpness from application of DL, which in turn led to ~2-3x improved SNR. This allowed lowering the breath-hold time by ~40% in prospective patients, without loss in diagnostic quality. Future work will focus on further optimizing between spatial resolution and breath-hold time, including at 1.5T, where the DL had a greater effect due to inherently less SNR. The findings have the potential to improve the diagnostic accuracy and optimize resource utilization in patients with difficulty in holding their breath.Acknowledgements
No acknowledgement found.References
1. Li et al. XH. Abdominal MRI at 3.0 T: LAVA‐flex compared with conventional fat suppression. Journal of Magnetic Resonance Imaging. 2014;40:58-66.
2. Yoon JH, Nickel MD, Peeters JM, Lee JM. Rapid Imaging: Recent Advances in Abdominal MRI for Reducing Acquisition Time and Its Clinical Applications. Korean Journal of Radiology. 2019;20(12):1597-1615.
3. Lebel RM. Performance characterization of a novel deep learning-based MR image reconstruction pipeline. August 2020. doi:10.48550/arXiv.2008.06559
4. Rudin LI, Osher S, Fatemi E. Nonlinear total variation based noise removal algorithms ☆. Physica D: Nonlinear Phenomena. 60(1-4).
5. Block KT, Uecker M, Frahm J. Suppression of MRI Truncation Artifacts Using Total Variation Constrained Data Extrapolation. International Journal of Biomedical Imaging. 2008;2008.
6. Ruslau MFV, Pratama RA, Asmal S. Edge detection in noisy images with different edge types. IOP Conf Series: Earth and Environmental Science. 2019;343.
Figures
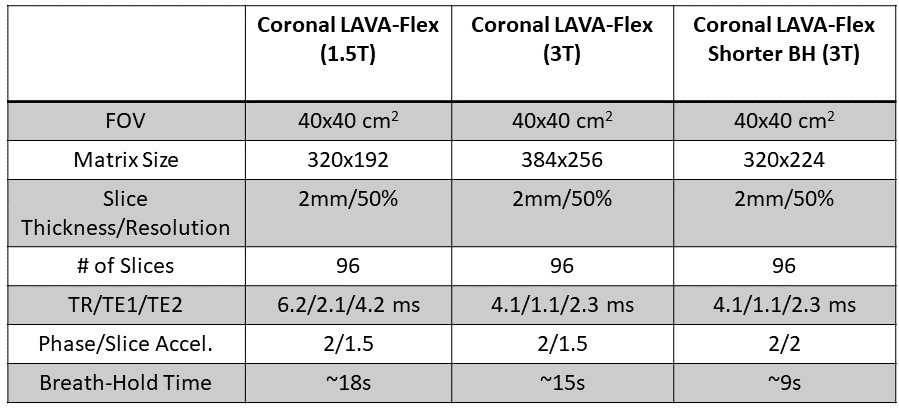
Table 1: Detailed parameters of the BH LAVA-Flex acquisitions used in this study.
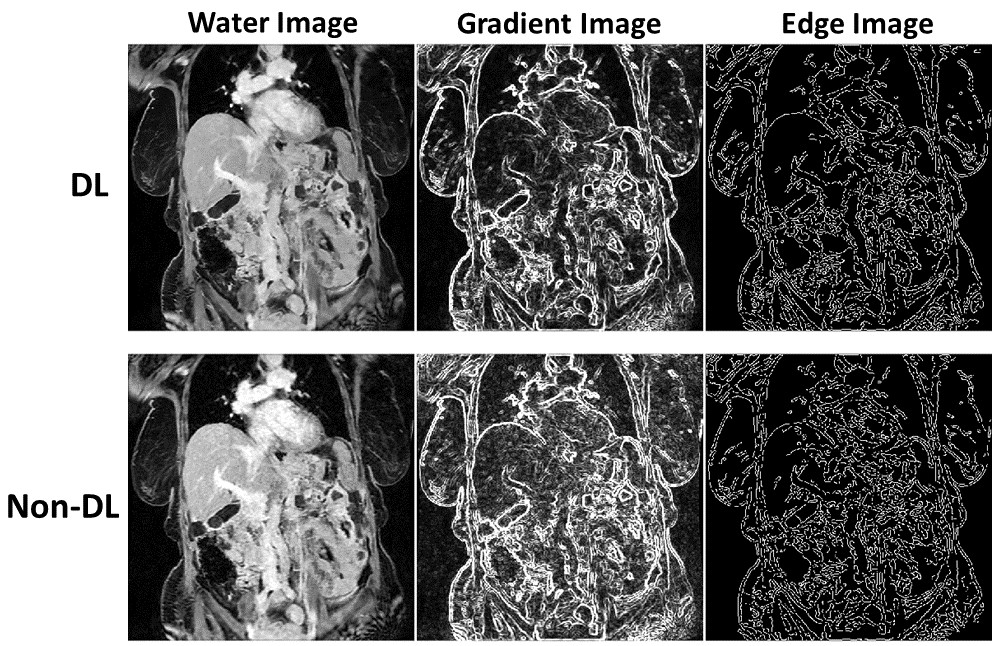
Figure 1: Example DL and non-DL water images from a patient acquired at 1.5T along with the gradient image and edge image. The gradient image shows the lower total variation across the abdomen, particularly in the liver. Similarly, the fewer detected edges in the liver help reveal the hepatic vessels more clearly.
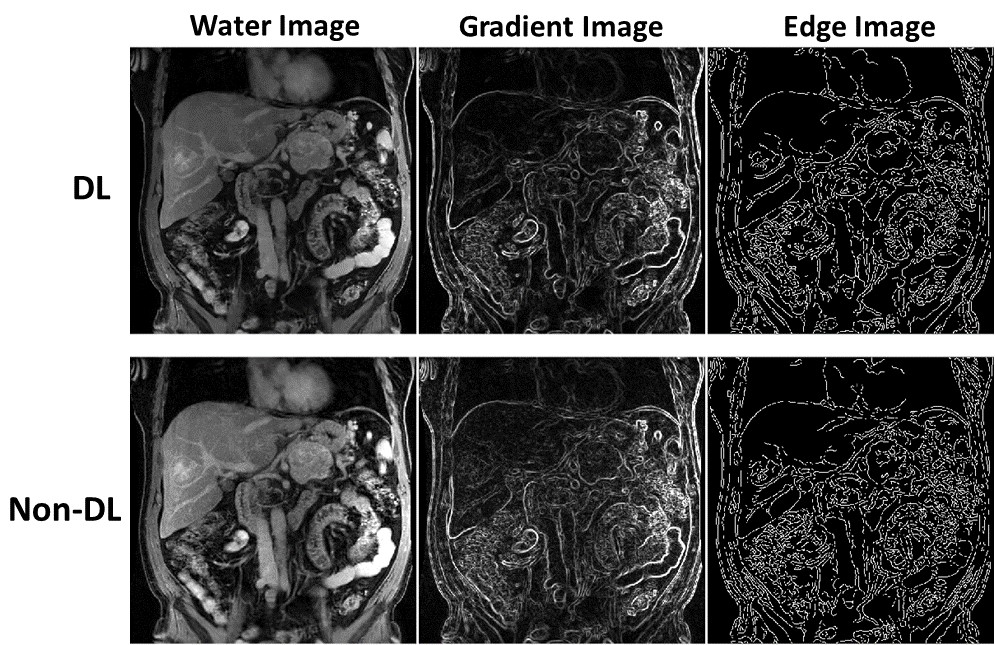
Figure 2: Example DL and non-DL water images from a patient acquired at 3T along with the gradient image and edge image. Similar to 1.5T images, the DL image showed less TV and increased SNR, with slightly fewer edges detected. The effect is less noticeable because of the inherently higher SNR at 3T compared to 1.5T, combined with these images being post-contrast.
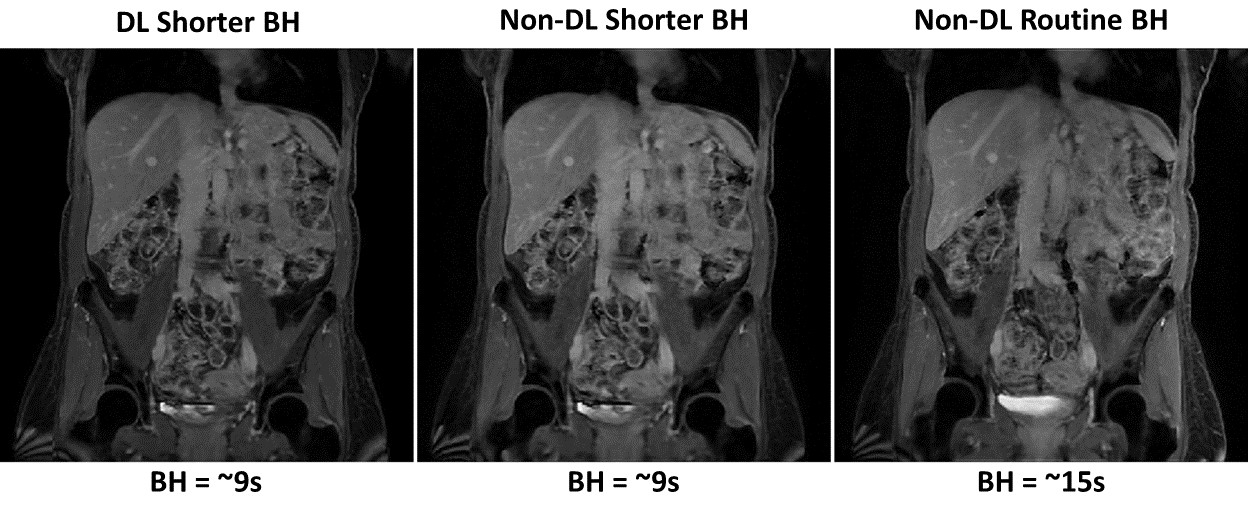
Figure 3: Example DL and non-DL water images from a patient acquired at 3T with a shorter BH in addition to the routine BH. The ~40% decrease in BH still results in diagnostic quality images compared to the clinically accepted routine BH images when DL is applied to help improve SNR and image sharpness.
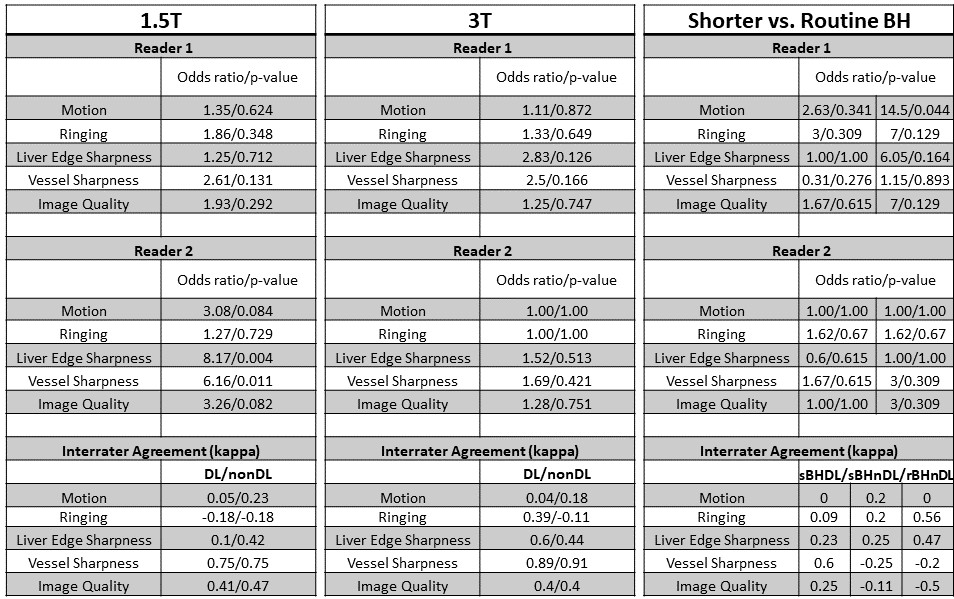
Table 2: Statistical analysis results for the radiologists’ reads. If the odds ratio is > 1, then we can conclude that DL measures tended to be higher than non-DL measures. Here, both readers preferred DL across all the IQ attributes, both at 1.5 and 3T, with higher effect at 1.5T. The kappa showed slight to strong agreement depending on the attribute. Similarly, the shorter BH DL had considerably higher odds ratio over the routine BH (right column in Shorter vs. Routine BH) and was clearly preferred. Shorter BH w/o DL also performed similar to routine BH (left column in Shorter vs. Routine BH).