3653
Distinguishing early liver fibrosis: integrating clinical and elastography features and radiomics signatures from Gd-EOB-DTPA-enhanced MRI1Radiology, Tianjin first central hospital, Tianjin, China, 2Radiology, Tianjin Wuqing People's Hospital, Tianjin, China
Synopsis
Keywords: Liver, Radiomics, Liver fibrosis; Gd-EOB-DTPA-enhanced MRI; nomogram
Motivation: Despite the effectiveness of elastography and serology tests in detecting liver fibrosis, diagnosing early-stage fibrosis remains challenging.
Goal(s): Develop and validate a reliable radiomics model using Gd-EOB-DTPA-enhanced MRI for early liver fibrosis diagnosis.
Approach: Create a radiomics model based on Gd-EOB-DTPA-enhanced MRI and establish a fused nomogram combining clinical characteristics and LSM. Compare the diagnostic performance of the fused model with single models for early-stage liver fibrosis.
Results: Gd-EOB-DTPA-enhanced MRI radiomics model effectively diagnoses early liver fibrosis. The fusion model enhances diagnostic efficiency.
Impact: To develop and validate a fusion model based on Gd-EOB-DTPA-enhanced MRI to identify early-stage liver fibrosis.
Introduction
Liver fibrosis is a progressive pathological change that occurs because of chronic liver disease, stemming from various causes. Currently, liver biopsy remains the "gold standard" for diagnosing fibrosis, but it is invasive and often poorly tolerated by patients.1 In recent years, non-invasive methods like CT, MRI, ultrasound, and lab tests have gained traction in studying liver fibrosis. Techniques such as shear wave elastography (SWE) have shown efficacy in diagnosing moderate to severe fibrosis (S2-4), with an AUC value range of 0.85 to 0.96.2 However, SWE may not be as sensitive in identifying early fibrosis (S0-1). The potential of MRI in non-invasive fibrosis diagnosis is increasingly recognized. T1WI texture analysis, for instance, has demonstrated an AUC value of 0.82 in distinguishing S0-2 from S3-4 fibrosis.3 Gd-EOB-DTPA enhanced MRI, a widely adopted clinical method, has shown promise. Utilizing deep learning and other techniques, some researchers have achieved AUC values of 0.85, 0.84, and 0.84 for diagnosing F2, F3, and F4 fibrosis, respectively.4 Thus, this study aims to extract radiomics characteristics from Gd-EOB-DTPA enhanced MRI texture analysis to enhance the differential diagnosis of early liver fibrosis (S0-1). This endeavor holds potential for providing valuable insights into the early detection and treatment of patients with liver fibrosis, ultimately guiding timely clinical intervention.Method and materials
This retrospective study was approved by the Institutional Review Board of the Tianjin First Central Hospital. All MRI examinations were performed with 3.0T MR scanner (Prisma/Skyra, Siemens Healthcare). Between November 2016 and September 2019, 152 patients with chronic liver disease from Tianjin Second People's Hospital were included as a training cohort and divided into group A (S0-1, n = 38) and group B (S2-4, n = 114). From November 2019 to February 2022, 55 patients from Tianjin First Central Hospital were included in a validation cohort, divided into group A (S0-1, n = 16) and group B (S2-4, n = 41). In the training cohort, radiomics signatures were extracted from the hepatobiliary phase. Radiomics features were selected using the interclass correlation coefficient and least absolute shrinkage and selection operator method. An elastography nomogram was established based on liver stiffness measurement (LSM) from FibroScan, the independent risk factors of early liver fibrosis were analyzed, and a relevant clinical diagnosis model was established through Logistic regression. Three radiomics features were used to establish an MRI fusion radiomics feature model, and a fused radiomics nomogram model of radiomics features and independent risk factors was established. The diagnostic value of the three models in the training cohort was evaluated by ROC analysis and then confirmed in the validation cohort.Results
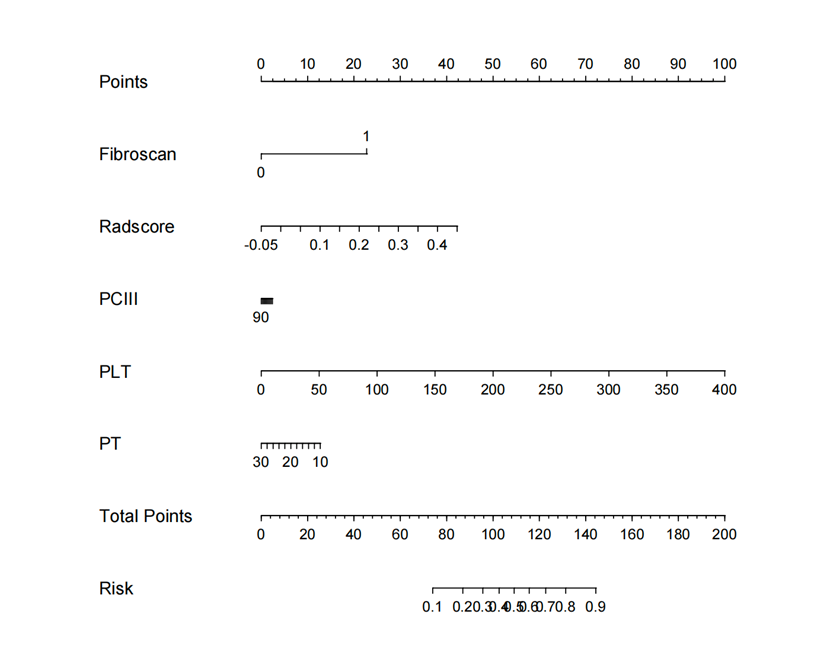
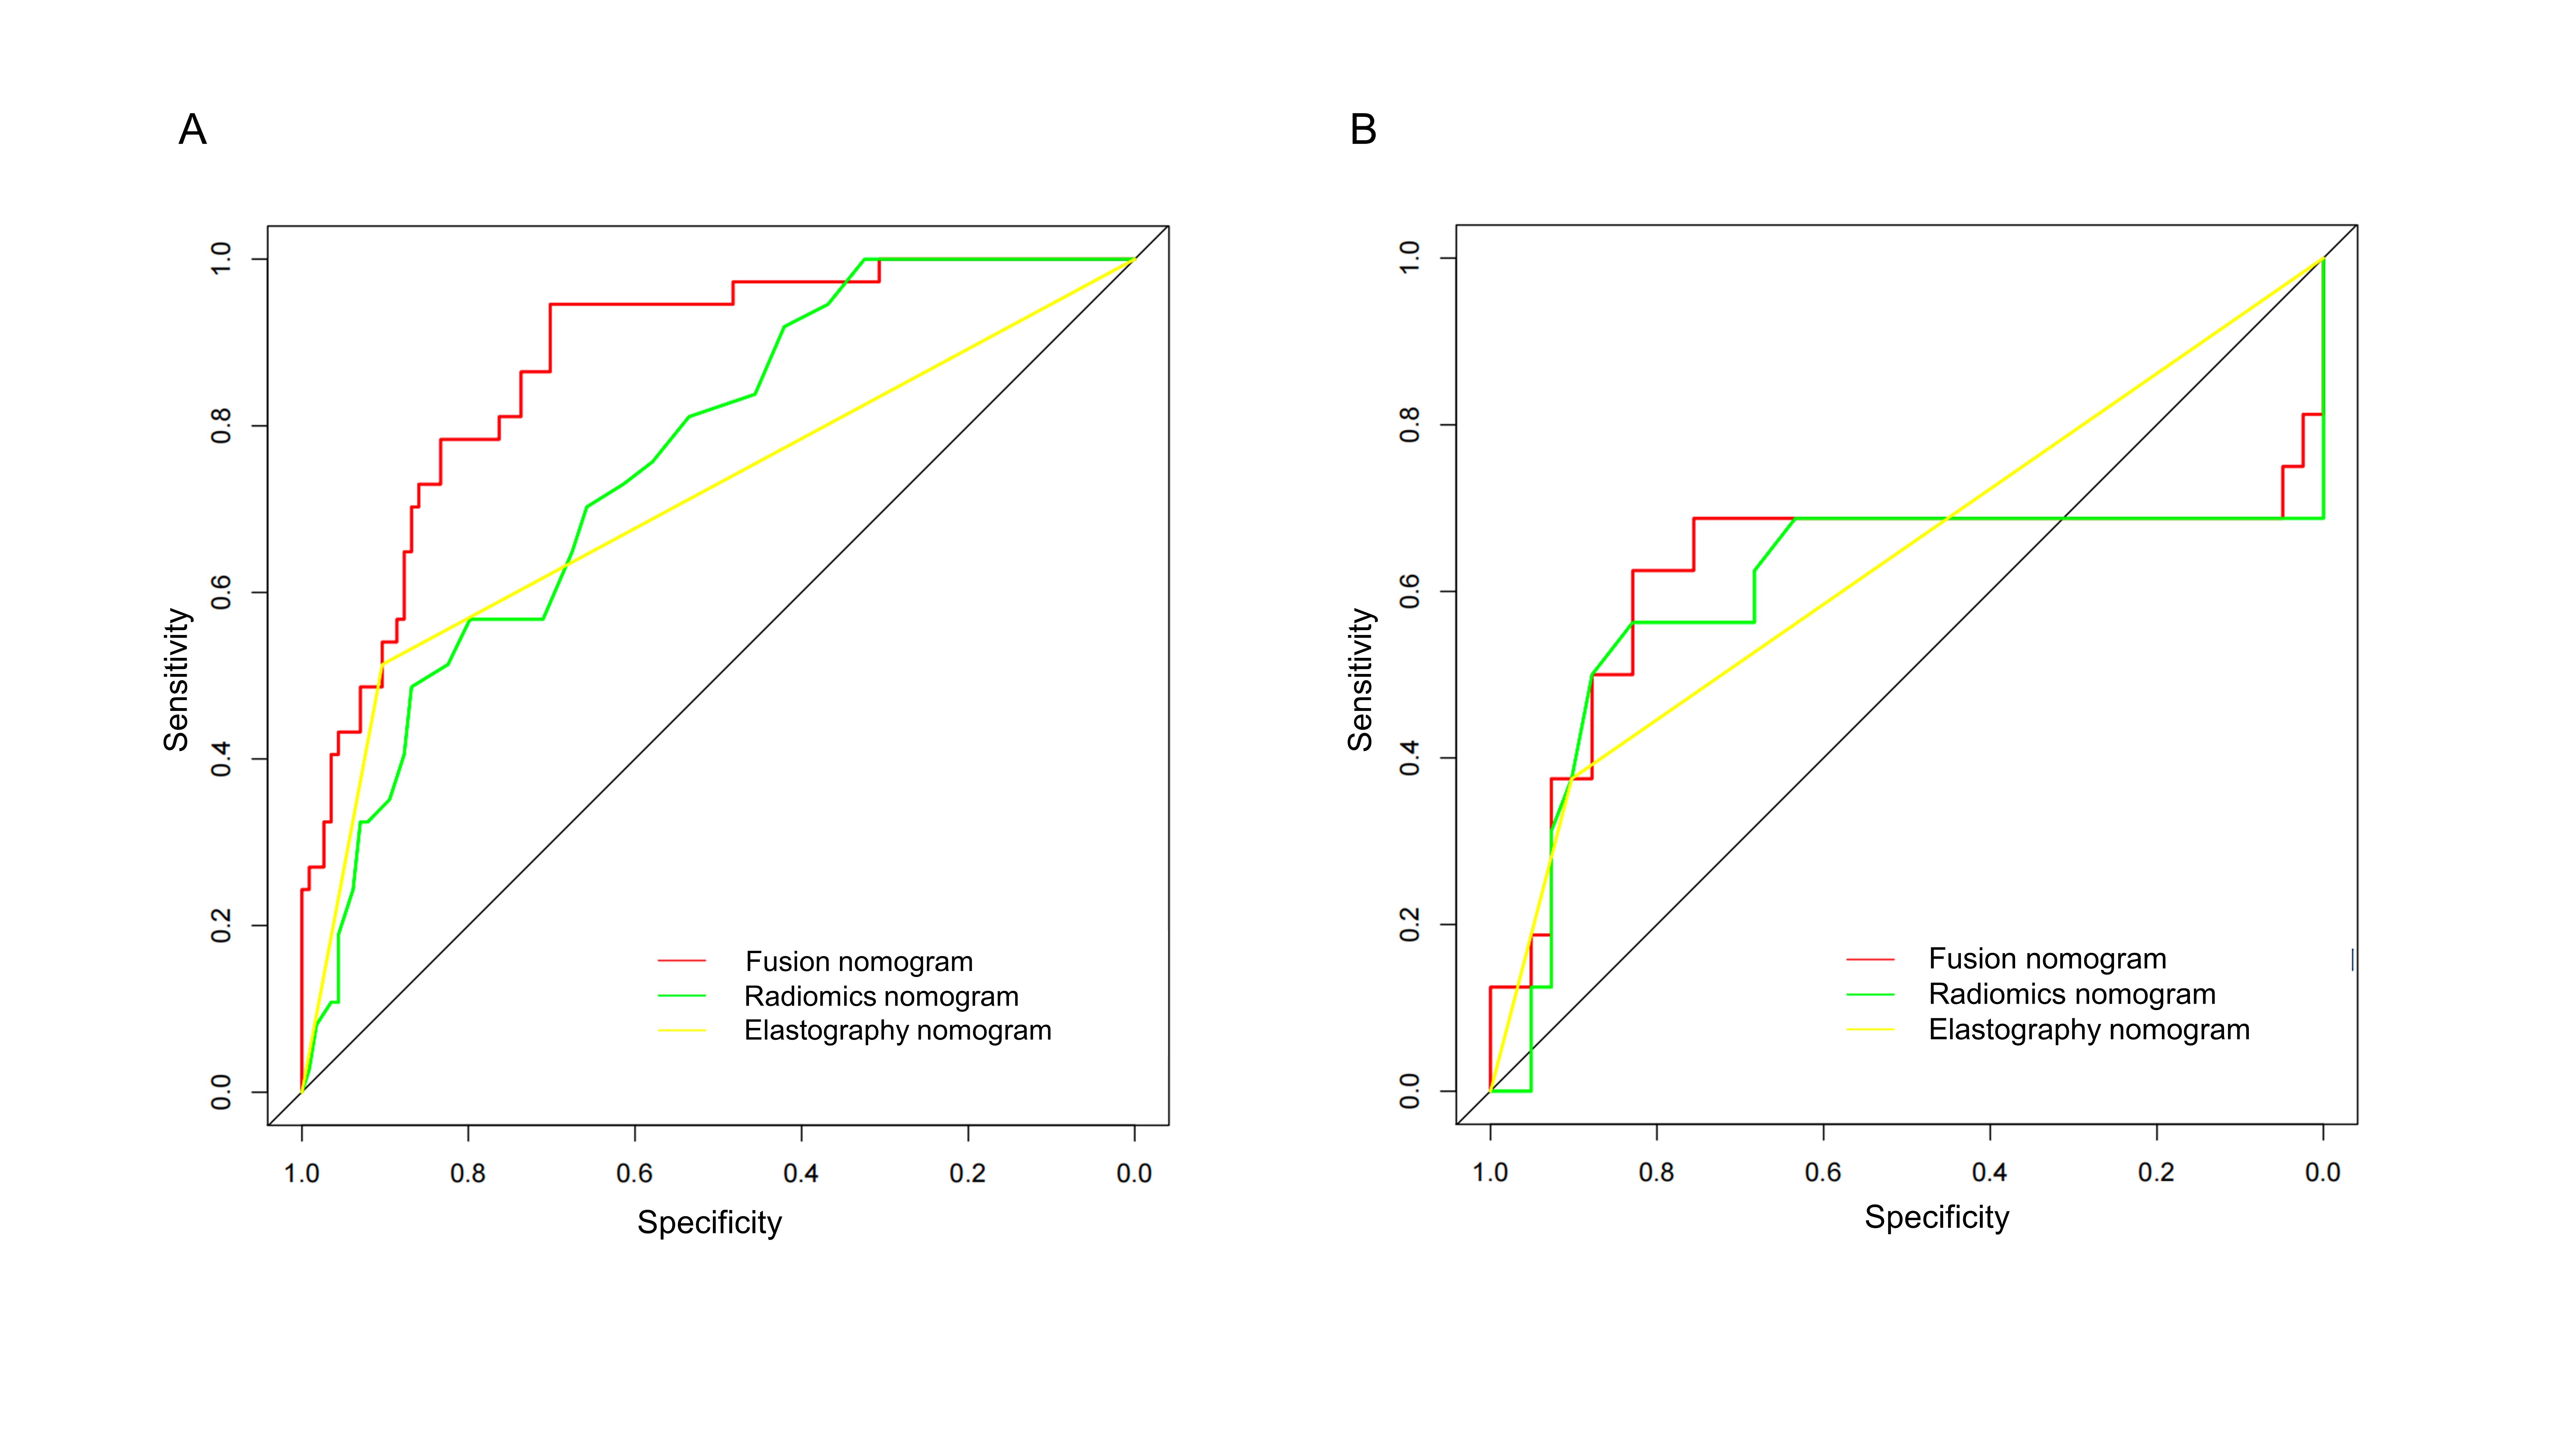
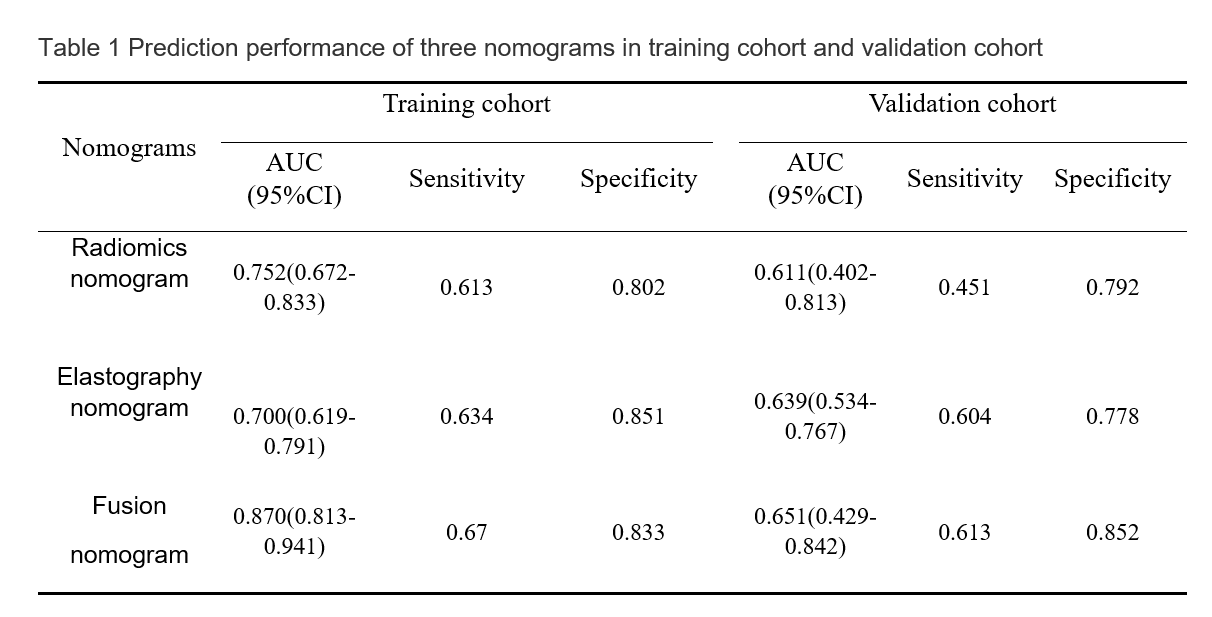
In the training cohort, Radscore, PCIII, PLT, and PT (OR 195.510, 0.998, 1.016, 0.961, respectively) emerged as independent risk factors for early-stage liver fibrosis diagnosis (p < 0.05) (Fig.1). The fusion nomogram exhibited a significantly higher AUC compared to both the elastography nomogram based on FibroScan test (0.870 vs. 0.700, p < 0.05) and the Radiomics nomogram (0.870 vs. 0.752, p < 0.05). Notably, the fusion nomogram demonstrated the highest sensitivity at 0.670, while the elastography nomogram boasted the highest specificity at 0.851 (Table1). In the validation cohort, the fusion nomogram achieved an AUC of 0.651 (95% CI: 0.429-0.842), surpassing the radiomics nomogram [AUC=0.611 (95% CI: 0.402-0.813)] and the elastography nomogram [AUC=0.639, 95% CI: 0.534-0.767)]. The fusion nomogram maintained the highest sensitivity (0.613) and specificity (0.852). ROC curves for the three nomograms in both the training and validation cohorts are presented in Fig.2.Discussion
Our study aimed to perform radiomics analysis based on Gd-EOB-DTPA enhanced MRI to identify early liver fibrosis. Our results demonstrate that the fusion radiomics features obtained from HBP images and the fusion radiomics feature diagnostic model can diagnose patients with stage S0-1 disease with high sensitivity. Furthermore, a combined nomogram model that combined significant clinical factors, and elastography with the fusion radiomics signature was developed and validated, and it exhibited better performance in diagnosing hepatic fibrosis S0-1 than the fusion radiomics signature or elastography model alone.Conclusions
The Gd-EOB-DTPA-enhanced MRI radiomics model can diagnose early liver fibrosis. The combined model combined with LSM, PCIII, PLT, and PT further improves the diagnostic efficiency, helps to identify early liver fibrosis in a timely manner in clinical practice, and provides Assist physicians in formulating targeted treatment plans and provide valuable reference, thereby improving patient prognosis.Acknowledgements
noneReferences
1. Regev A, Berho M, Jeffers LJ, et al. Sampling error and intraobserver variation in liver biopsy in patients with chronic HCV infection. Am J Gastroenterol. 2002;97:2614-2618.
2. Darweesh, S.K., et al., The clinical usefulness of elastography in the evaluation of nonalcoholic fatty liver disease patients: A biopsy-controlled study. Eur J Gastroenterol Hepatol, 2019. 31(8): p. 1010-1016. 3. Schawkat, K., et al., Diagnostic accuracy of texture analysis and machine learning for quantification of liver fibrosis in MRI: correlation with MR elastography and histopathology. Eur Radiol, 2020. 30(8): p. 4675-4685.
4. Yasaka, K., et al., Liver Fibrosis: Deep Convolutional Neural Network for Staging by Using Gadoxetic Acid-enhanced Hepatobiliary Phase MR Images. Radiology, 2018. 287(1): p. 146-155.
Figures