3651
NMR-based metabolomics for early detection of prostate cancer biomarker/s1NMR, All India Institute of Medical sciences, New Delhi, India, 2Urology, All India Institute of Medical sciences, New Delhi, India, 3Radiodiagnosis , IRCH, All India Institute of Medical sciences, New Delhi, India, 4Radiadiagnosis,RPC, All India Institute of Medical sciences, New Delhi, India, 5Biostatistics, All India Institute of Medical sciences, New Delhi, India
Synopsis
Keywords: Prostate, Metabolism, Metabolomics, NMR
Motivation: Current diagnostic methods cannot predict the aggressiveness of prostate cancer (PCa) at a treatable stage of disease.
Goal(s): To interrogate tumorigenesis of PCa and AI/ML techniques to NMR-based targeted blood plasma metabolomic profiling analysis for prediction of PCa.
Approach: Use AI/ML approaches to NMR metabolic profiling for PCa patient blood plasma data analysis
Results: Phosphocreatine, choline, 3-hydroxybutyrate, taurine and glucose showed highest discriminate using CFS, PLS-DA, OPLS-DA, random forest models.
Impact: It will pave way to enhance understanding of cancer pathogenesis and biomarker/s identification and early detection systems.
Prostate cancer (PCa) is the most commonly diagnosed malignancy in men over the age of 50 years worldwide. It is a slow-growing cancer with the absence of symptoms at early stages. Current diagnostic methods cannot predict PCa at a treatable stage of the disease. Thus, the present study to interrogate tumorigenesis of PCa and apply Artificial Intelligence (AI)/ machine learning (ML) techniques to nuclear magnetic resonance (NMR) spectroscopy-based targeted blood plasma metabolomic profiling analysis for prediction of PCa from non-cancer patients. It will pave way to enhance understanding of cancer pathogenesis and biomarker/s identification and early detection systems.
Methods
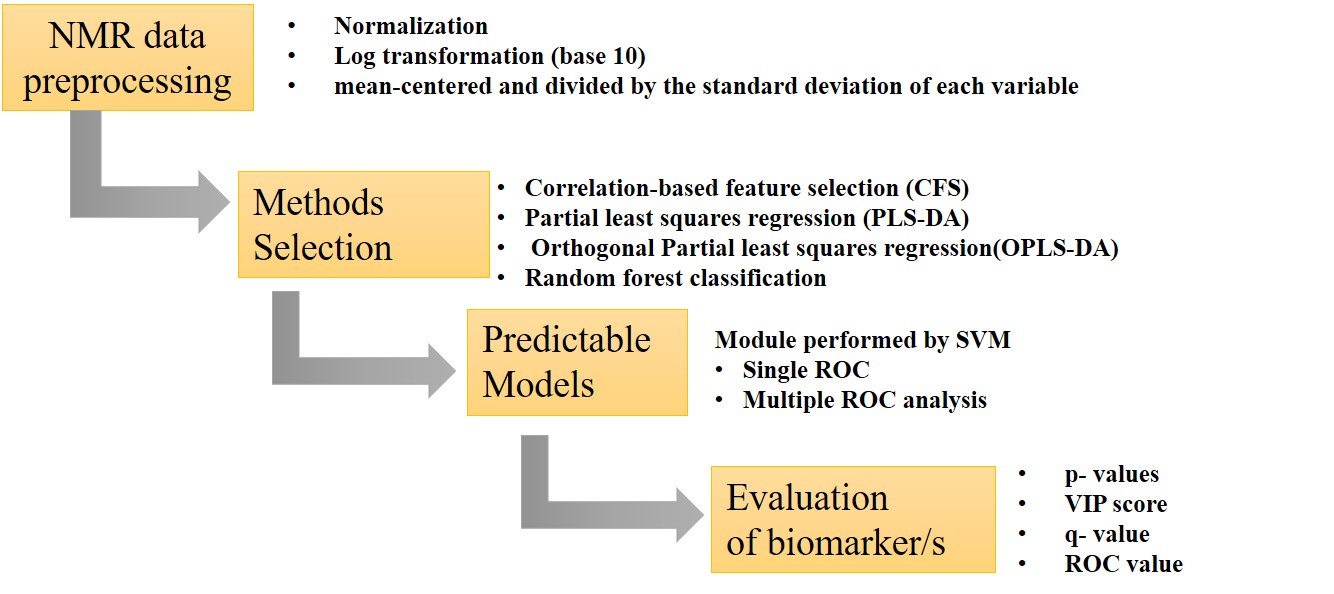
A total of 83 patients were included in this study. Blood samples were collected from PCa patients [(n = 42 median age: 68.5 (50-84) years; PSA: 26.02 (5.02-140) ng/mL; GS (7-9)] and noncancer patients or prostatitis on TRUS guided biopsy [(n =41, median age: 65 (54 - 81) years; PSA: 7.18 (4.12-37) ng/mL)], in morning pre-prandial after overnight fasting. 1H-NMR spectra of blood plasma samples were carried out at a 700 MHz spectrometer (Agilent, USA) using 1D CPMG with pre-saturation. Parameters were used for the 1D NMR experiment: 64 scans with a 70s relaxation delay and a spectral width of 9124.1 Hz with an echo time of 15ms. 2D COSY and TOCSY experiments were carried out for assignments of metabolite peaks. Blood plasma metabolite and clinical data analysis were carried out by machine learning (ML) or artificial intelligence (AL) using MetaboAnalyst 5.0. A p-value <0.05 was considered significant. Four variable selection algorithms in correlation-based feature selection (CFS) PLS-DA, OPLSDA, and random forest analysis were for diagnostic performance1. Metabolites panel consisting of metabolites common in four selection algorithms so-called overlapping set (OL). Further, SVM models were developed for which parameter selection was performed by using 10-fold cross-validations. MSEA was performed to identify which metabolic pathways were perturbed as a direct result of PCa as compared to non-cancer patients. The study strategy from data pre and postprocessing through performance evaluation is shown in Figure 1.
Results
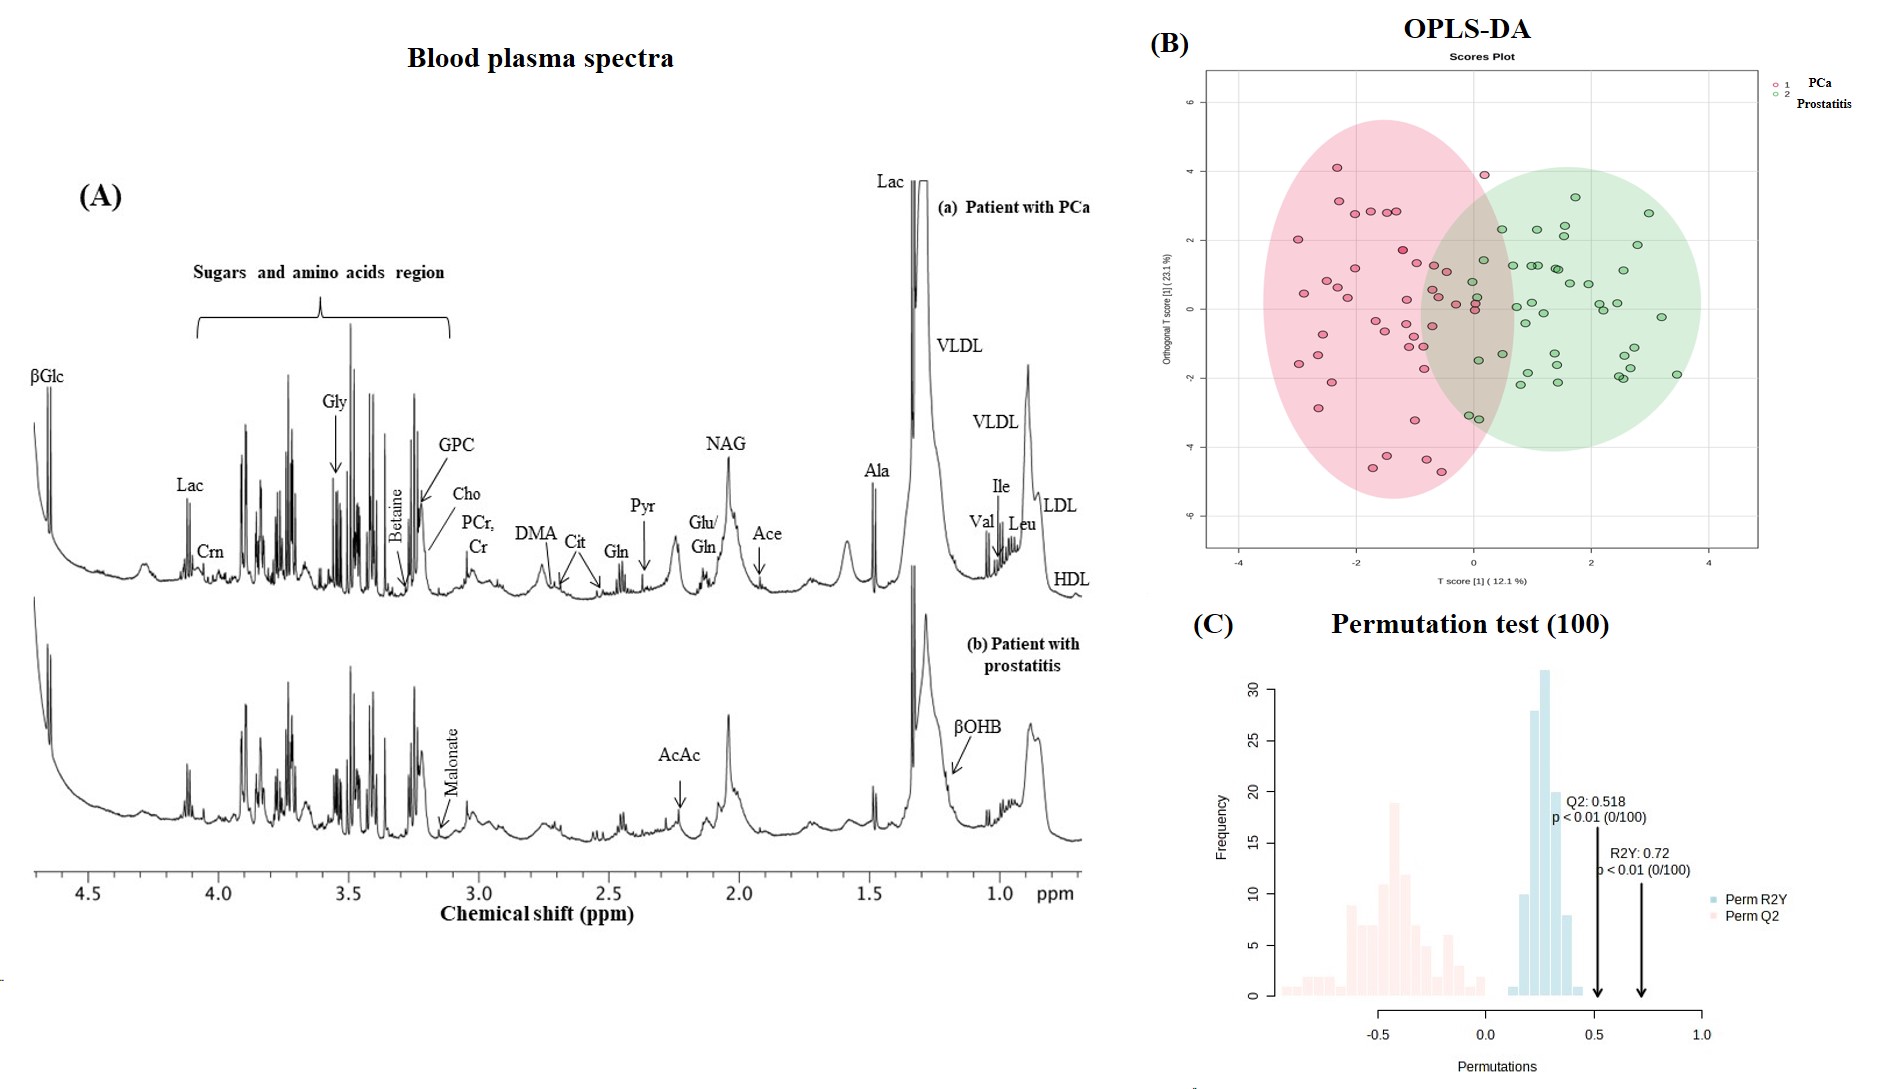
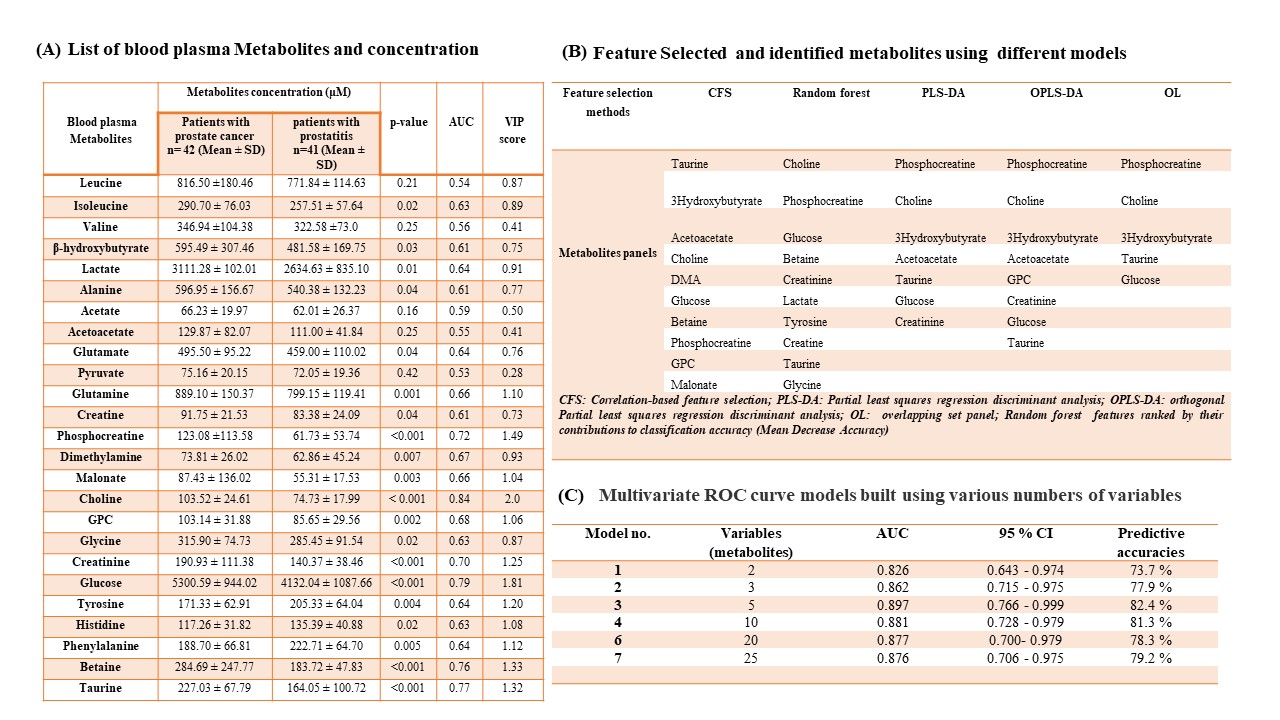
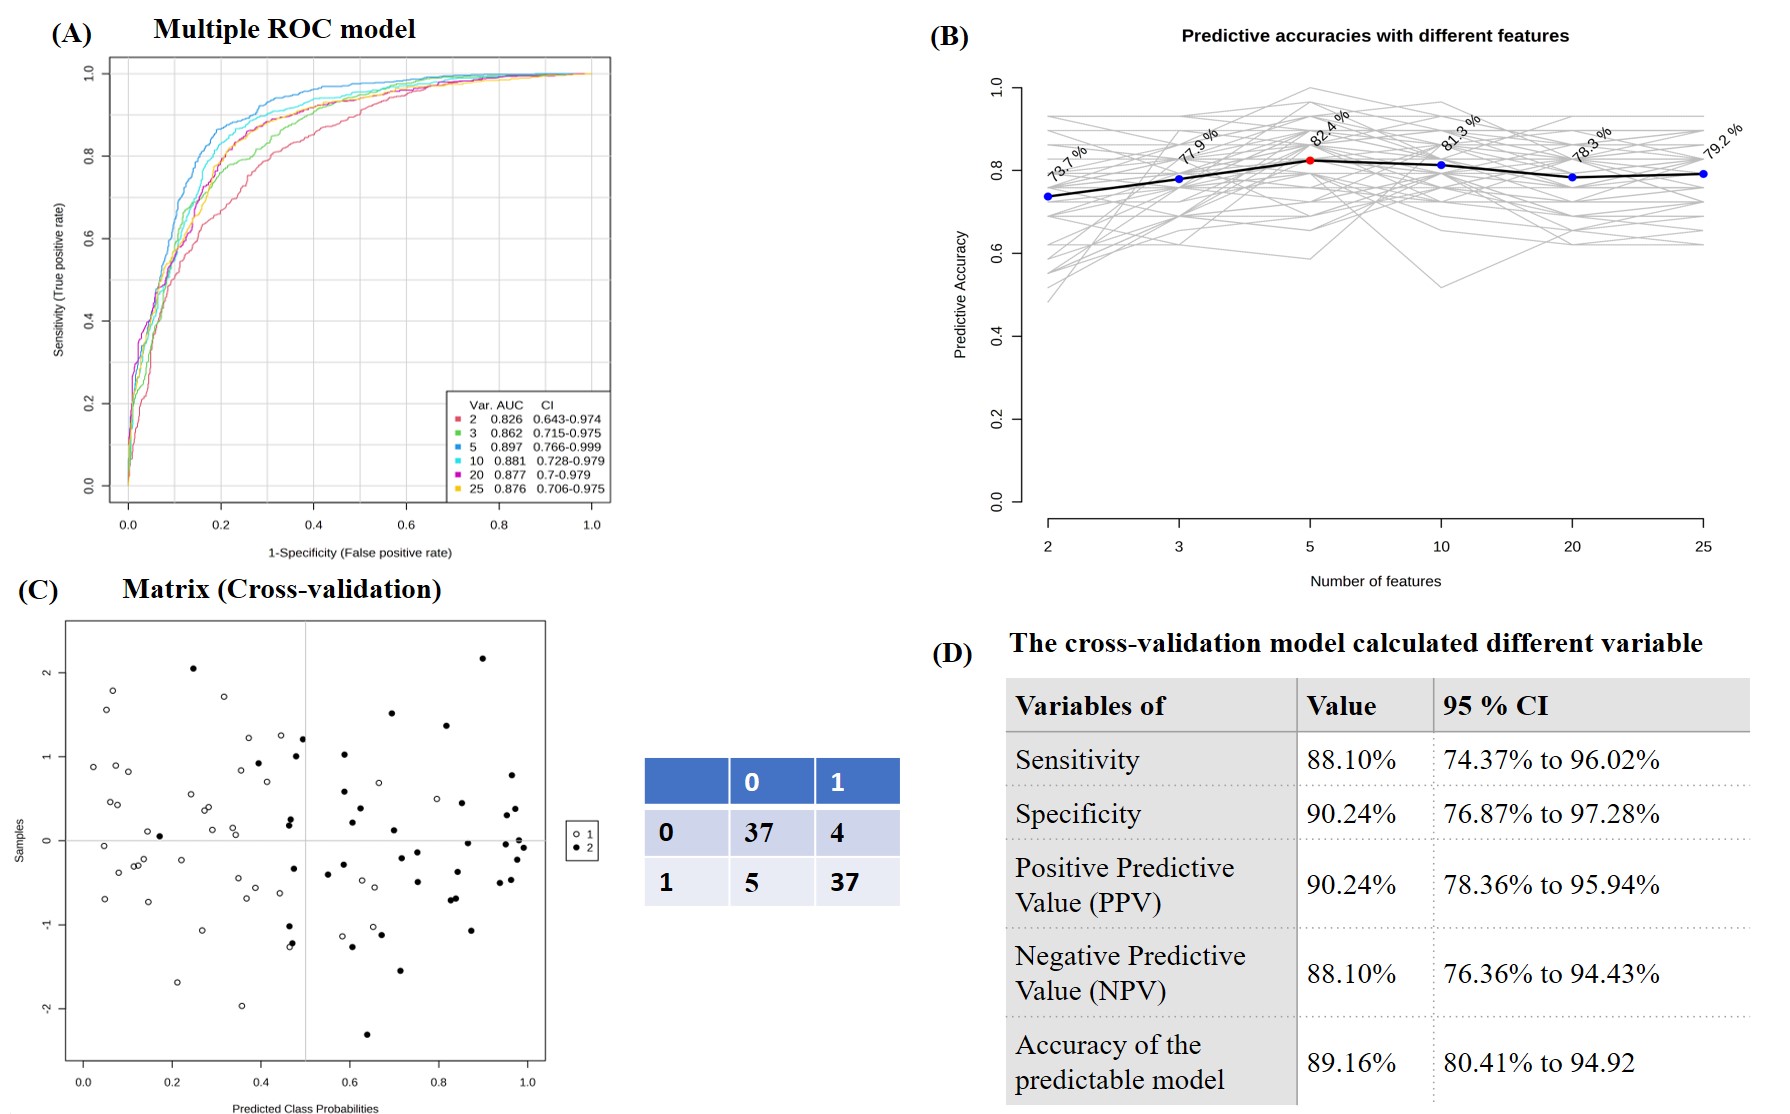
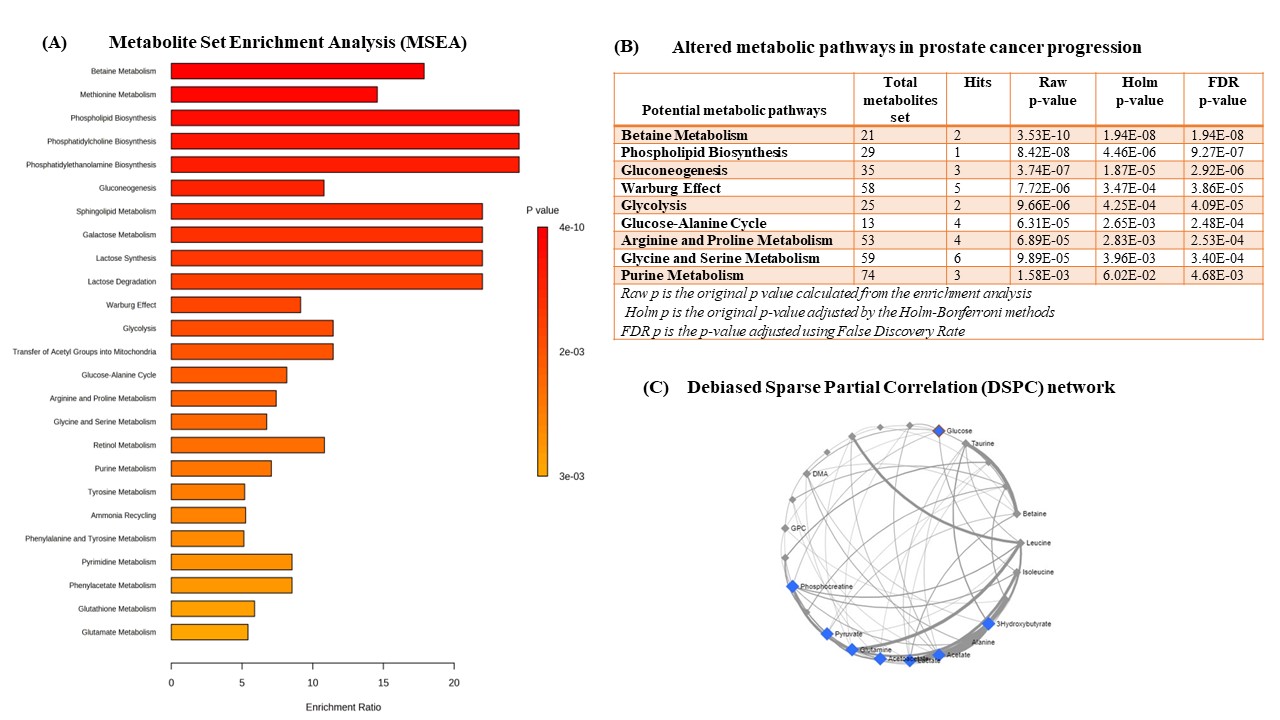
Figure 2 shows the representative 1H spectrum (1D CPMG) of a patient with PCa (a) and from non-cancer patient (b). In all, 25 metabolites were assigned using 1D and 2D NMR. A p-value <0.05 was considered significant. PLS-DA score and permutation test are shown in Figure 2. Phosphocreatine, choline, 3-hydroxybutyrate, taurine and glucose showed discriminate performance using CFS, PLS-DA, OPLS-DA and random forest models are shown in Table 1. Figure 3 shows SVM models created using different subsets of metabolites selected six models (2, 3, 5, 10, 20, and 25) were developed. MSEA analysis using the KEGG and SMPDB revealed the potential involvement of a list of prominent metabolic pathways and DSPC metabolic networking are shown in Figure 4.
Discussion
The present study revealed a significantly higher concentration of Phosphocreatine, choline, 3-hydroxybutyrate, taurine, and glucose in PCa patients as compared to non-cancer. Higher concentration of Cho and lipids seen in blood plasma samples of patients is associated with phospholipid metabolism of cancer cells2-5. High levels of taurine affect cell proliferation and apoptosis while PCr and Glu are associated with energy-generating pathways(2-5). The top 2 important variables (Cho and PCr ) were used to build classification models and AUC value was 0.83 and 95% CI was 0.64-0.97. The AUC using a larger number of variables tried to achieve an even greater AUC value was 0.90 (95% CI, 0.77-1.0) when we used 5 metabolites as the variables. The predictive accuracy showed a maximum value of 82.4 % when 5 metabolites were used as variables. The cross-validation model (2x2 matrix) utilizing metabolites in the dataset had accuracies in the range of 80.41% to 94.92% an AUC = 0.91 with a sensitivity of 88.10% and a specificity equal to 90.24%. Dysregulated pathways include betaine metabolism, phospholipid biosynthesis, gluconeogenesis, Warburg effect, and glycolysis in PCa progression and carcinogenesis. By performing additional variable selection techniques, we believe that we have developed the most robust and accurate biomarker/s panel for PCa diagnosis using NMR metabolomics in blood plasma.
Conclusion
This present study established that a selected panel of metabolites may accurately detect PCa in blood plasma samples. Significant disturbances of phospholipid and energy-generating pathways associated with PCa progression and tumorigenesis. We believe that metabolite biomarker/s as presented herein could have future clinical utility for the diagnosis and monitoring of PCa if they are able to discriminate non-cancer patients. Based on these results further work is acceptable to validate these findings in a much larger cohort.
Acknowledgements
P.K thank ICMR for RA fellowship.References
1.Petrick LM, Shomron N. AI/ML-driven advances in untargeted metabolomics and for biomedical applications. Cell Rep Phys Sci. 2022 Jul 20;3(7):100978.
2. Dereziński P, Klupczynska A, Sawicki W, Pałka JA, Kokot ZJ. Amino Acid Profiles of Serum and Urine in Search for Prostate Cancer Biomarkers: a Pilot Study. Int J Med Sci. 2017 Jan 1;14(1):1-12.
3.Johansson, M. et al. One-carbon metabolism and prostate cancer risk: prospective investigation of seven circulating B vitamins and metabolites. Cancer Epidemiol. Biomarkers Prev. 18, 1538-43(2009).
4.Glunde, K., Bhujwalla, Z.M., Ronen, S.M. Choline metabolism in malignant transformation. Nat. Rev. Cancer. 11, 835-48(2011).
5. McGarry, J.D., Foster, D.W. Regulation of hepatic fatty acid oxidation and ketone body production. Annu. Rev. Biochem. 49, 395-420(1980).
Figures