3644
Accurate Estimation of Kidney Volume Growth Rates from abdominal MRI via Fitting to multiple Imaging Timepoints (FIT) in ADPKD1Radiology, Weill Cornell Medicine, New York, NY, United States, 2The Rogosin Institute, New York, NY, United States, 3Columbia University Irving Medical Center, New York, NY, United States
Synopsis
Keywords: Kidney, Genetic Diseases, ADPKD
Motivation: Height-adjusted total kidney volume (htTKV) growth rate measured on MRI or CT is a critical biomarker for monitoring autosomal dominant polycystic kidney disease (ADPKD) progression.
Goal(s): This study aims to develop a tool for accurate calculation of the htTKV growth rate based on all available MRI scans.
Approach: Accuracy of four MRI methods for calculating htTKV growth rate were assessed as compared to ground truth calculated from 10+ years of imaging follow up.
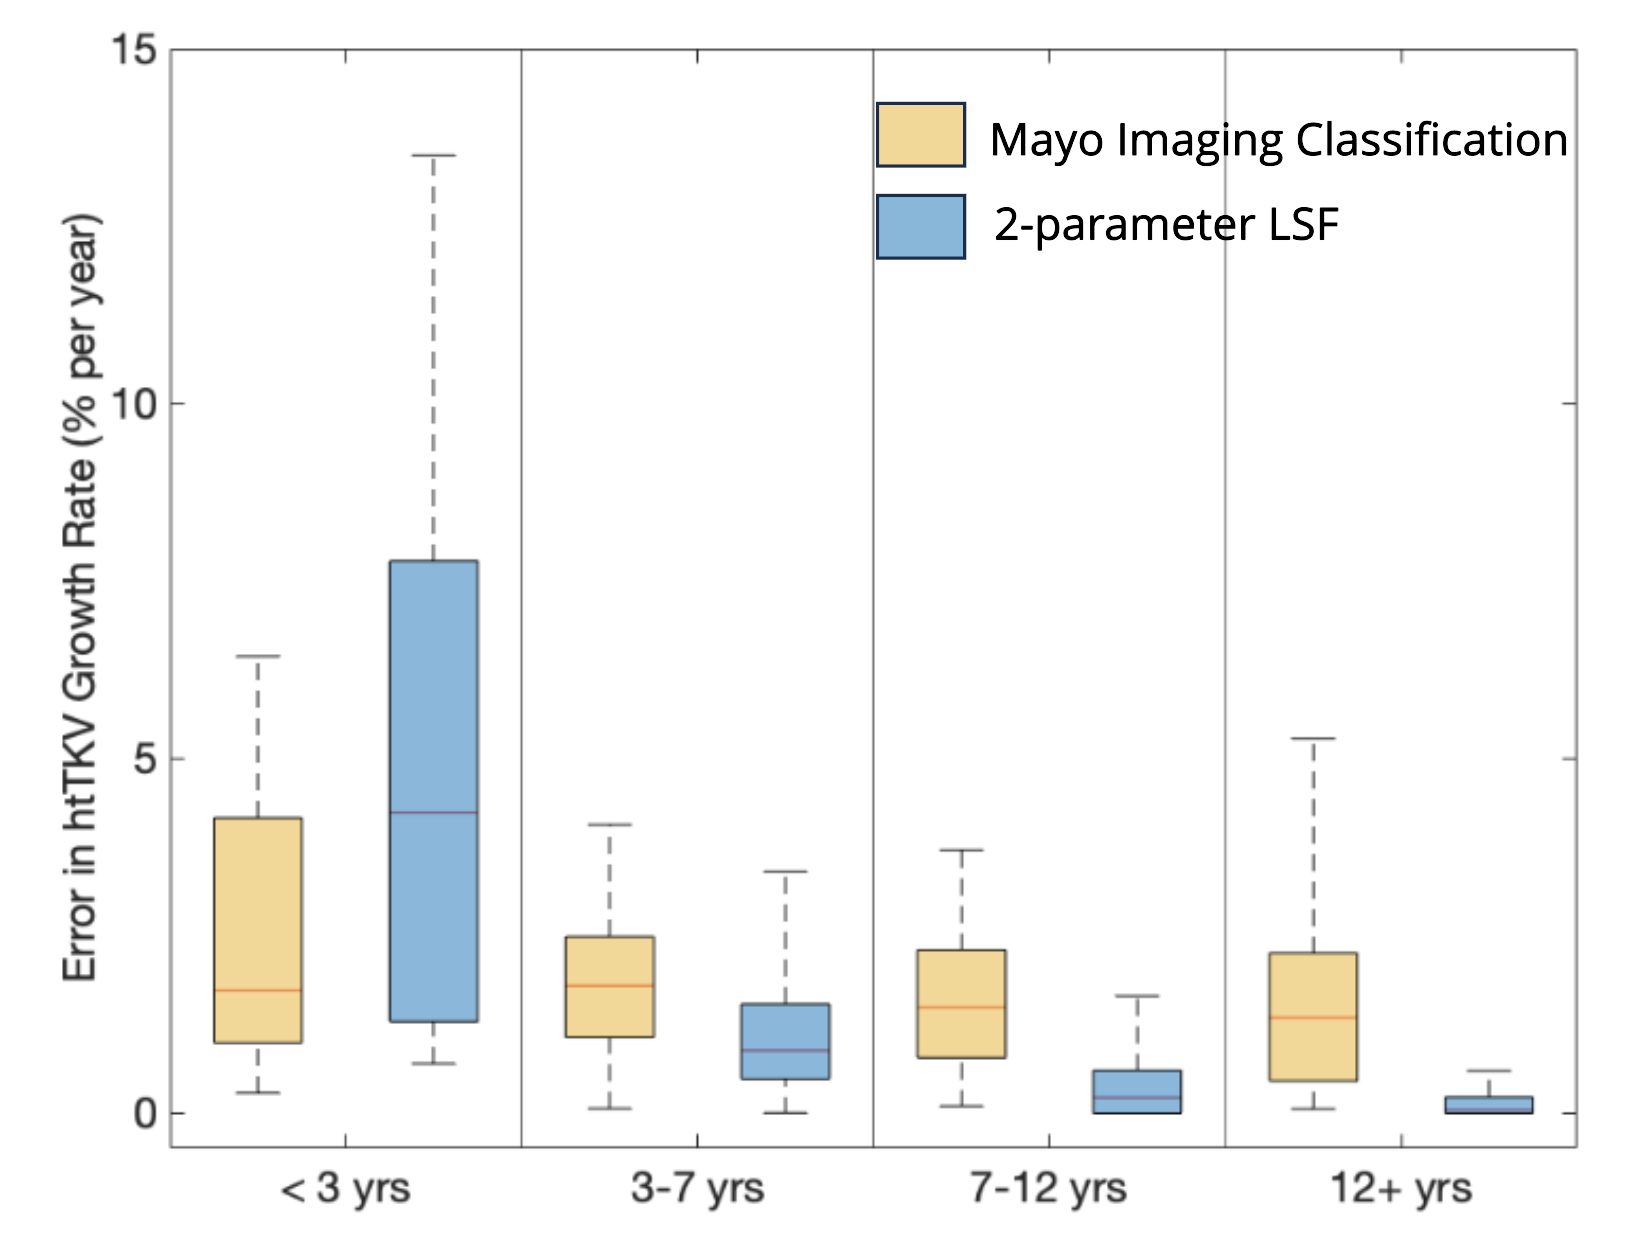
Results: Using 2-parameter least squares fitting with 3+ scans or 5+ years of follow up reduce error 2-fold compared to the current clinical standard, Mayo Imaging Classification.
Impact: Accurate estimation of kidney growth rate on abdominal MRI using FIT will enable better prediction of disease progression and response to therapy in patients with ADPKD.
Introduction
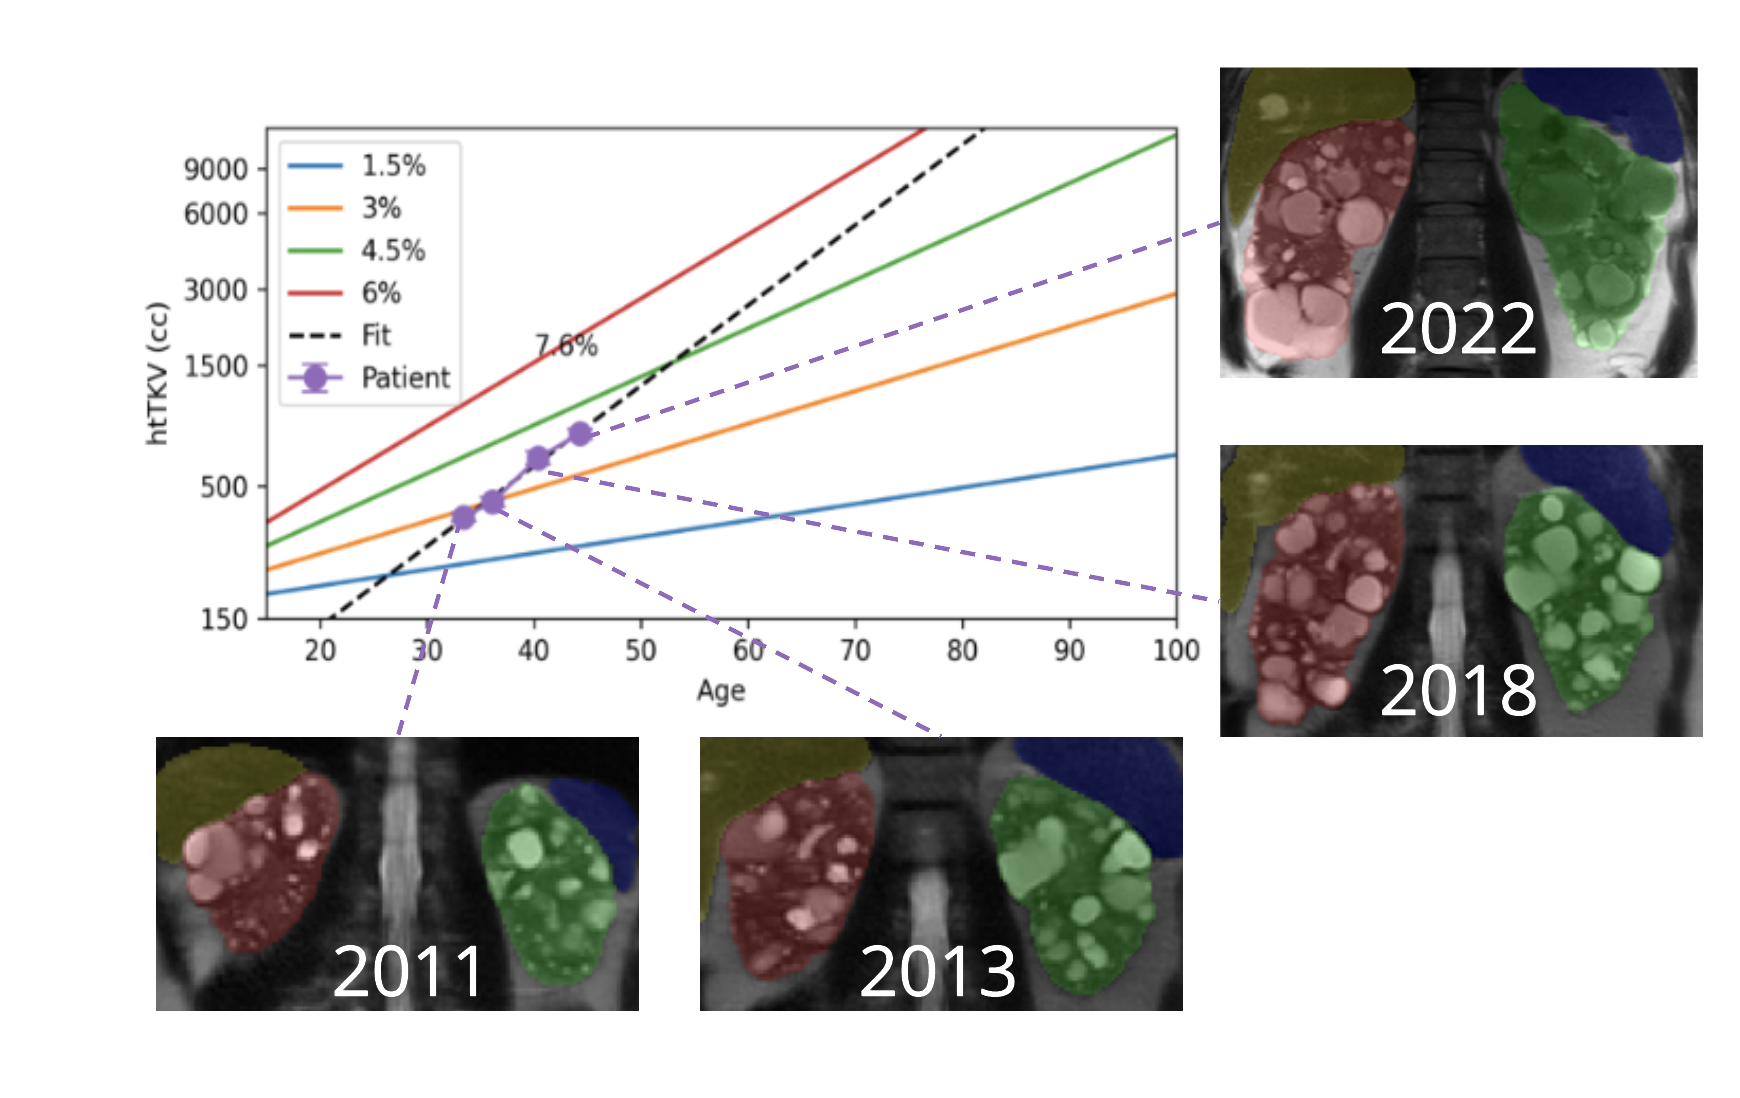
Autosomal dominant polycystic disease (ADPKD), the most prevalent renal genetic disorder, affects 12 million people worldwide and accounts for 5-10% of all cases of end stage kidney disease. The height adjusted total kidney volume (htTKV) growth rate is an important metric for predicting trends in ADPKD progression1. Despite the widespread use of Mayo Imaging Classification (MIC), which uses htTKV as a predictor of disease severity and kidney growth rate measurement2, the accuracy of MIC is not well characterized. In addition, MIC utilized only a single MRI scan, but when a patient has multiple MRI scans, it is not clear which individual scan to use for calculating MIC, if they should be averaged, or if a curve fitting algorithm could be more accurate.Methods
We studied patients with at least 10 years of imaging follow-up to establish the ground truth htTKV trajectory. MIC accuracy for predicting htTKV growth rate was compared to curve fitting algorithms. The four methods included: (1) MIC based on the most recent scan, (2) averaging annual htTKV growth rates calculated for each set of scans using the MIC method, (3) 1-parameter least square fitting adopting the MIC assumption that htTKV at birth is 150 cc and (4) 2-parameter fitting. Since the accuracy of htTKV measurement from MRI may influence the uncertainty in htTKV growth rate, a reproducible 3D deep learning method to measure htTKV was used to measure htTKV from multi-parametric MRI3. ADPKD subjects with poor MIC accuracy were compared to those with high accuracy to determine what features predict poor MIC performance including age, eGFR and number of complex cysts determined by number of bright signals found on T1-weighted images.Results
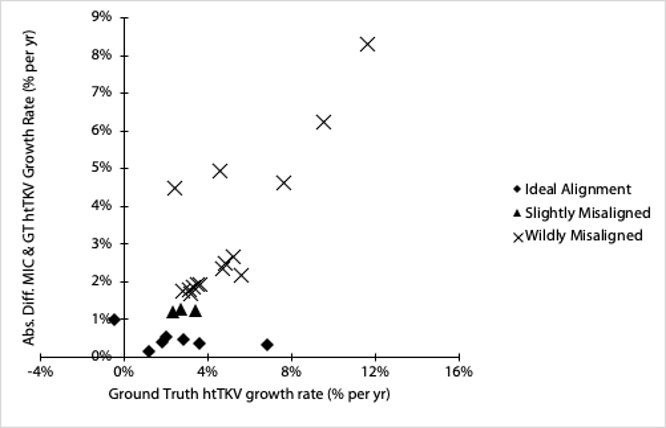
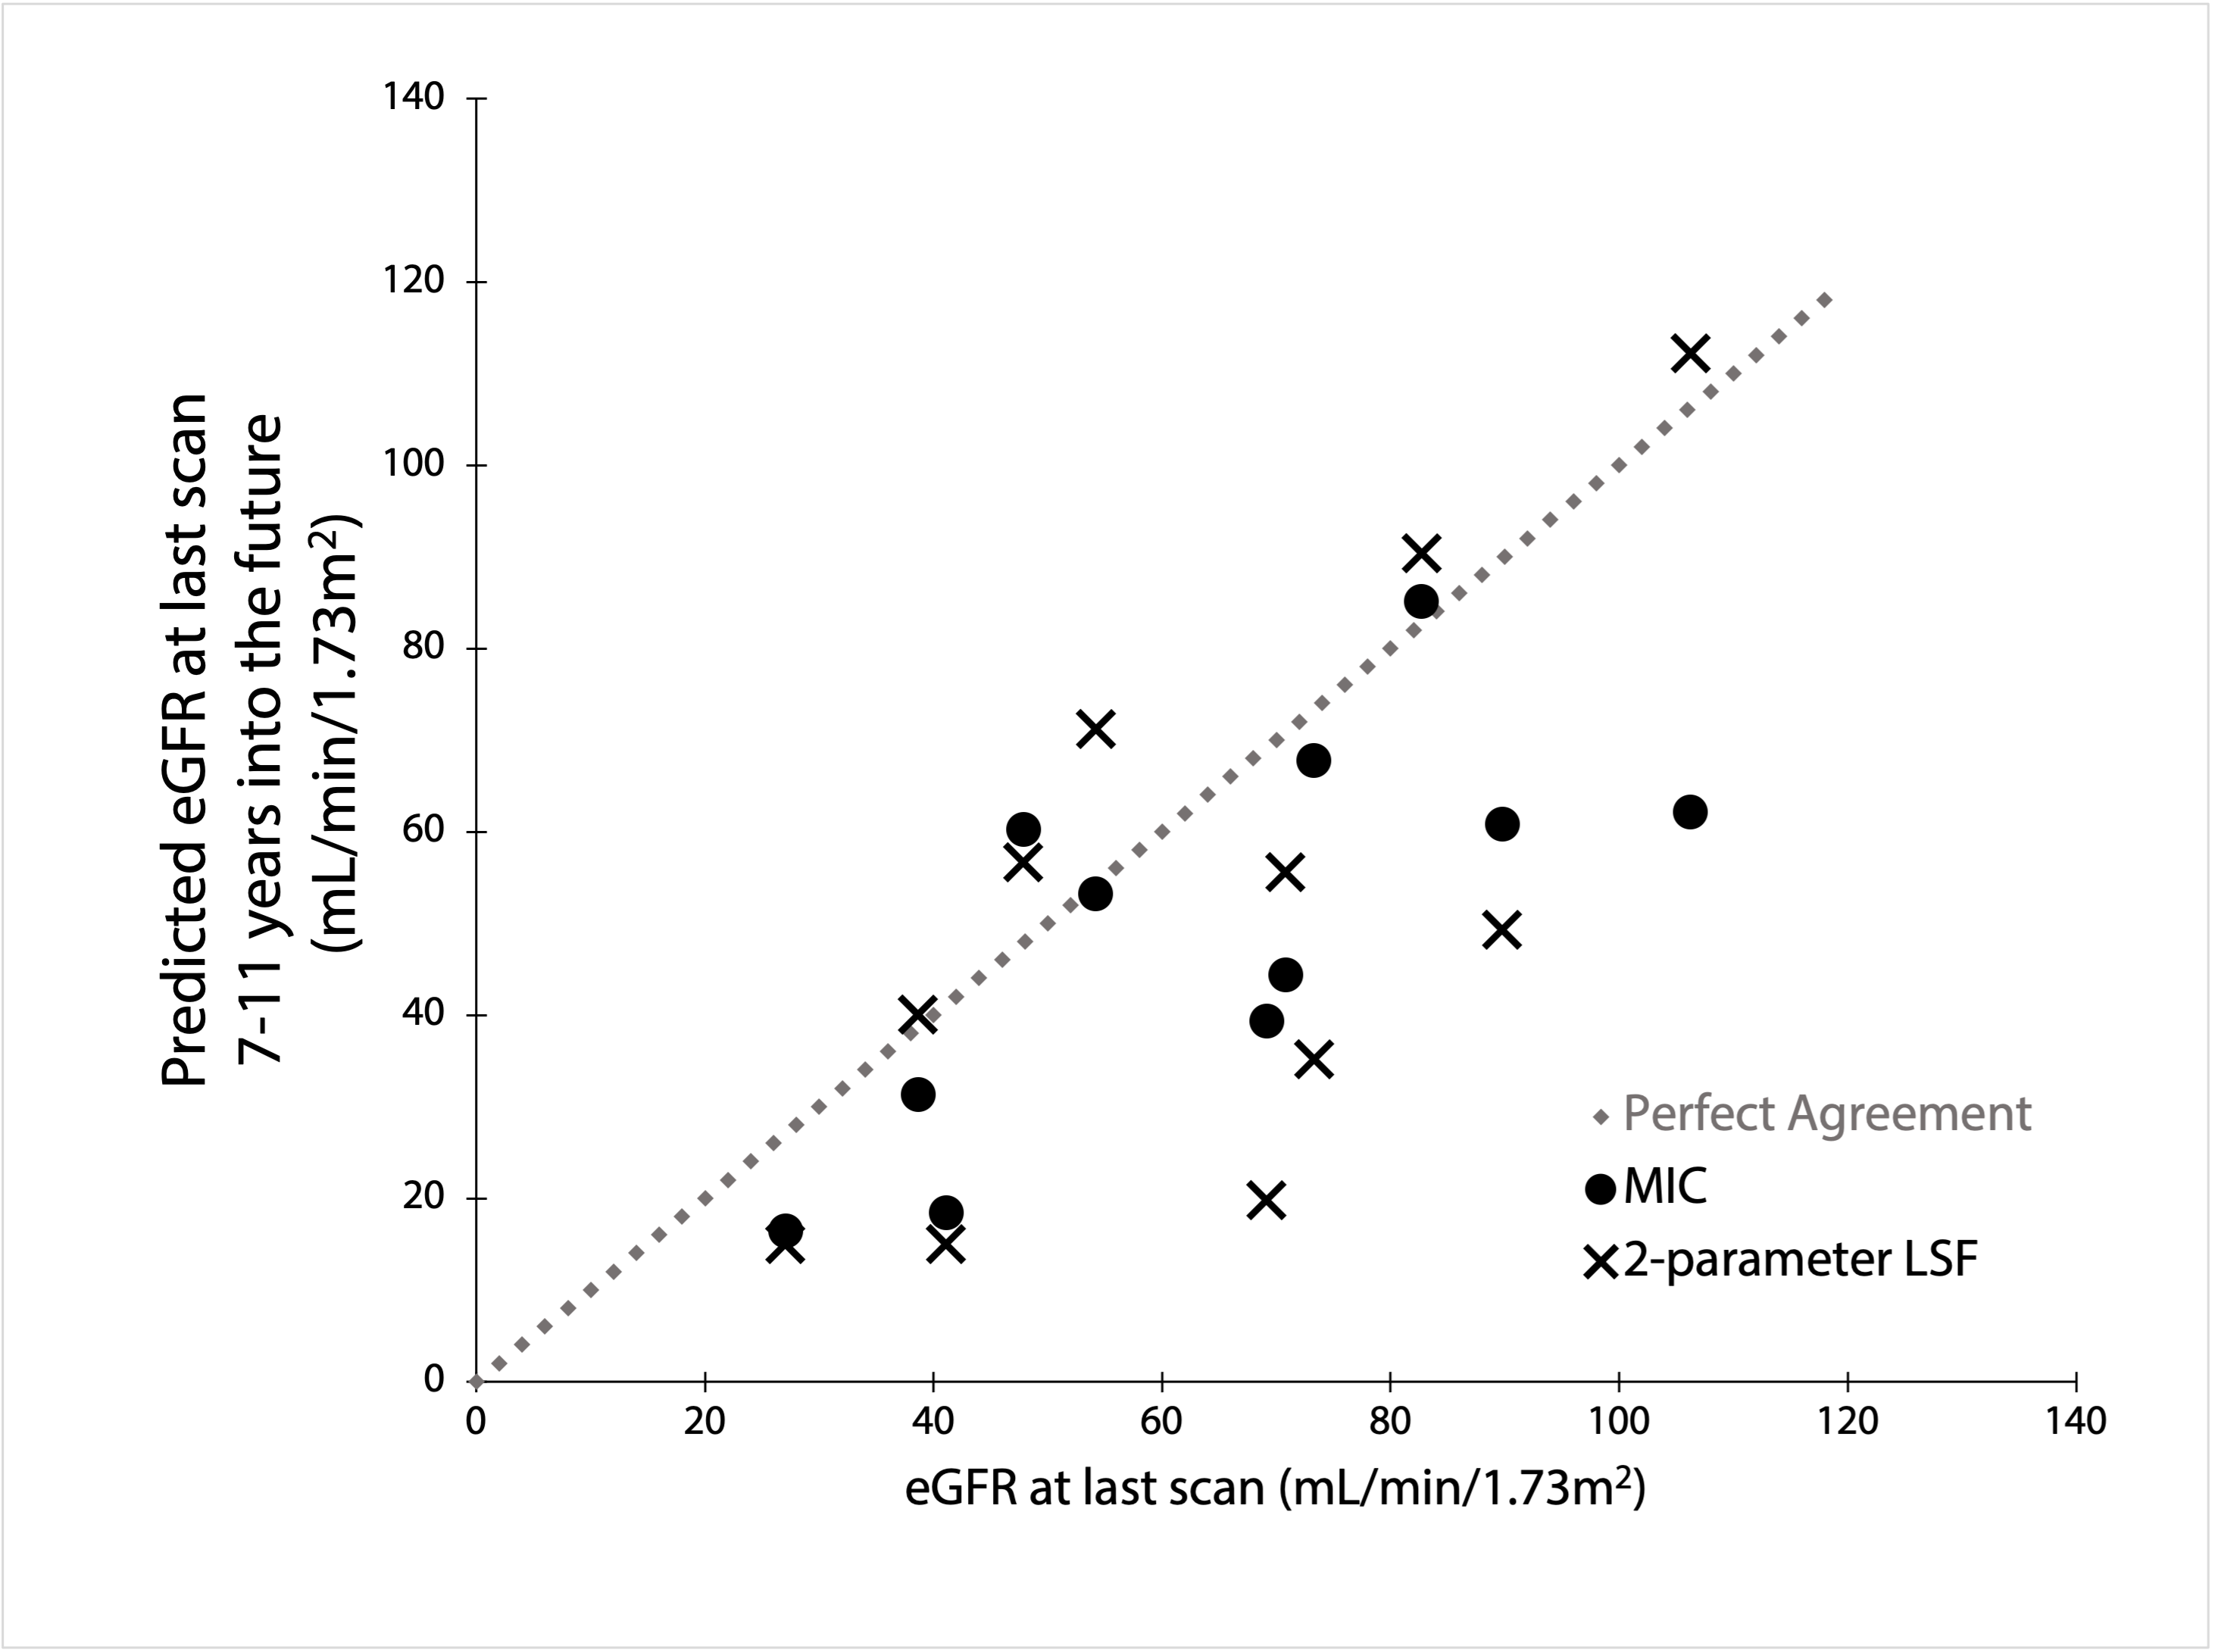
Mean absolute error in MIC for predicting annual TKV growth rate was 2.0 ± 2.0% compared to 1.1 ± 2.6% (p = 0.027) for a 2-parameter fit to the same exponential growth curve used for MIC when 4 measurements were available. The least squares fitting error continued to decrease with availability of additional measurement time point dropping down to 0.6 ± 1.5% (p = 0.004 compared to MIC) with 5 time points and 0.3 ± 0.6 (p = 0.006 compared to MIC) with 8 timepoints. Prediction of future eGFR was not significantly different between the two methods.Although our sample size was robust, with 10 years imaging follow-up, it was still too small to fully explore the characteristics of patients with poor MIC performance. However, male sex was significantly associated with poor MIC performance (p < 0.05) and there were trends of few complex cysts and older age in patients with poor MIC performance.
Discussion and Conclusion
These data from 25 ADPKD subjects with 10+ years of imaging follow-up to definitively map their TKV growth trajectory show that MIC calculated from a single, multi-parametric abdominal MRI is generally accurate with an error of 2% per year on average. However, MIC can be inaccurate in males, with a trend toward being less accurate in older subjects with fewer complex cysts. Future TKV growth can also be predicted based upon 2-parameter fitting which is significantly more accurate than MIC in subjects with 4+ years of imaging follow-up or 3+ time points, i.e. Fitting to multiple Imaging Time points (FIT).Acknowledgements
No acknowledgement found.References
1. Grantham JJ, Torres VE, Chapman AB, et al. Volume progression in polycystic kidney disease. NEJM, 2006; 354(20), 2122–2130.
2. Irazabal, MV, Rangel LJ, Bergstralh EJ, et al. Imaging classification of autosomal dominant polycystic kidney disease. JASN, 2015; 26(1), 160–172.
3. He X, Hu Z, Hreedi D, et al. Test retest reproducibility of organ volume measurements in ADPKD using 3D multimodality deep learning. Academic Radiology, 2023.
Figures