3639
Evaluation of multi-frequency MRE repeatability in healthy people and CKD diagnosis combined with automatic segmentation technique1Department of Radiology, Shenzhen Traditional Chinese Medicine Hospital (The Fourth Clinical Medical College of Guangzhou University of Chinese Medicine), Shenzhen, China, 2Shenzhen University, Shenzhen, China, 3MR Research Collaboration, Siemens Healthineers, Guangzhou, China, 4MR Research Collaboration, Siemens Healthineers, Shanghai, China, 5MR Research Collaboration, Siemens Healthineers, Beijing, China
Synopsis
Keywords: Kidney, Elastography, Magnetic resonance elastography, chronic kidney disease, renal stiffness
Motivation: The incorporation of automated kidney segmentation technology with multi-frequency MRE represents a novel approach in evaluating kidney diseases.
Goal(s): To explore the reliability of multi-frequency MRE combined with an automatic segmentation method and its diagnostic potential for CKD patients.
Approach: Constructed an automatic kidney segmentation model based on the nnU-Net network and measured the renal stiffness of MRE, employing T-tests, ROC curves, and Spearman correlation for data analysis.
Results: The incorporation of an automatic kidney segmentation model and multi-frequency MRE shows promise in effectively evaluating and monitoring kidney fibrosis.
Impact: The incorporation of automated kidney segmentation and MRE presents a new tool for reliably evaluating and monitoring kidney diseases, providing potential advancements in non-invasive diagnoses.
Introduction
Magnetic resonance elastography (MRE) provides anoninvasive assessment of kidney function and fibrosis in chronic kidney disease (CKD) by measuring the Shear Wave Speed(SWS,m/s)[1].Studies[2-4] on the reproducibilityof this technique have primarily focused on individual low frequencies, and relied on image post-processing methods that employ convolution algorithms with local frequency estimation (LFE) algorithms, necessitating manual segmentation of the cortex and medulla. In this study, we evaluated the reproducibility of multi-frequency MRE measured on a 3T MRI in the kidneys of healthy volunteers (HVs) and leveraged an automatic kidney segmentation model based on the nnU-Net (no-new-Net) network. Additionally, we explored the diagnostic value of this method in CKD patient.Methods
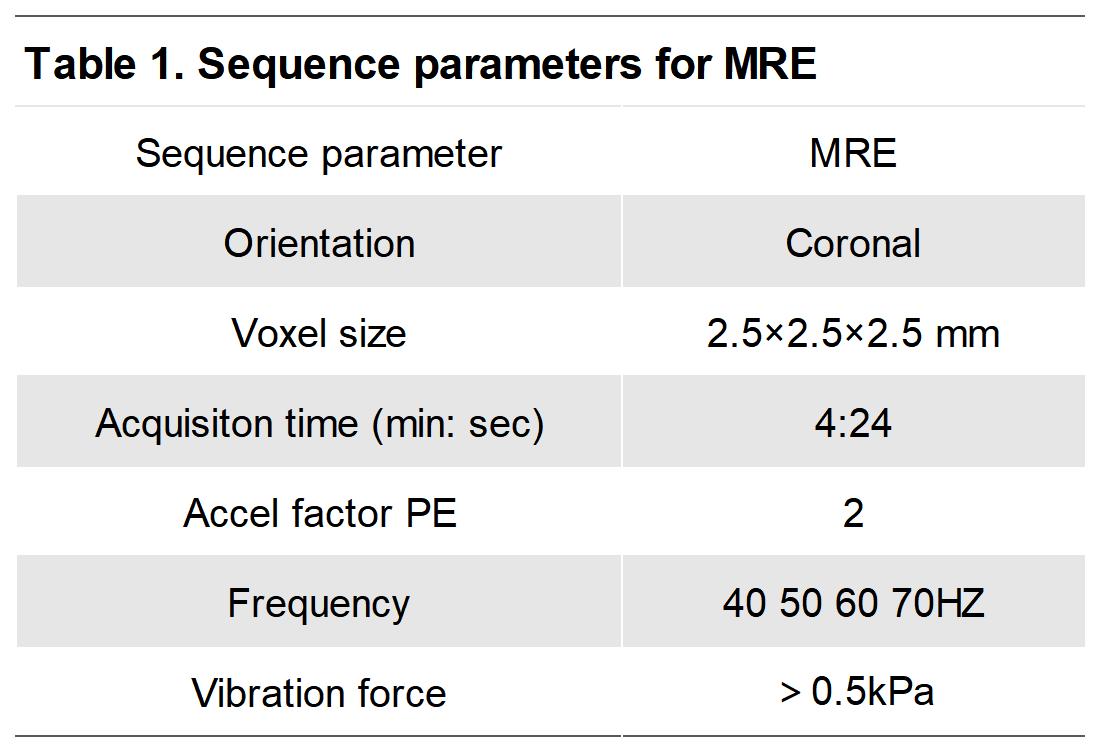
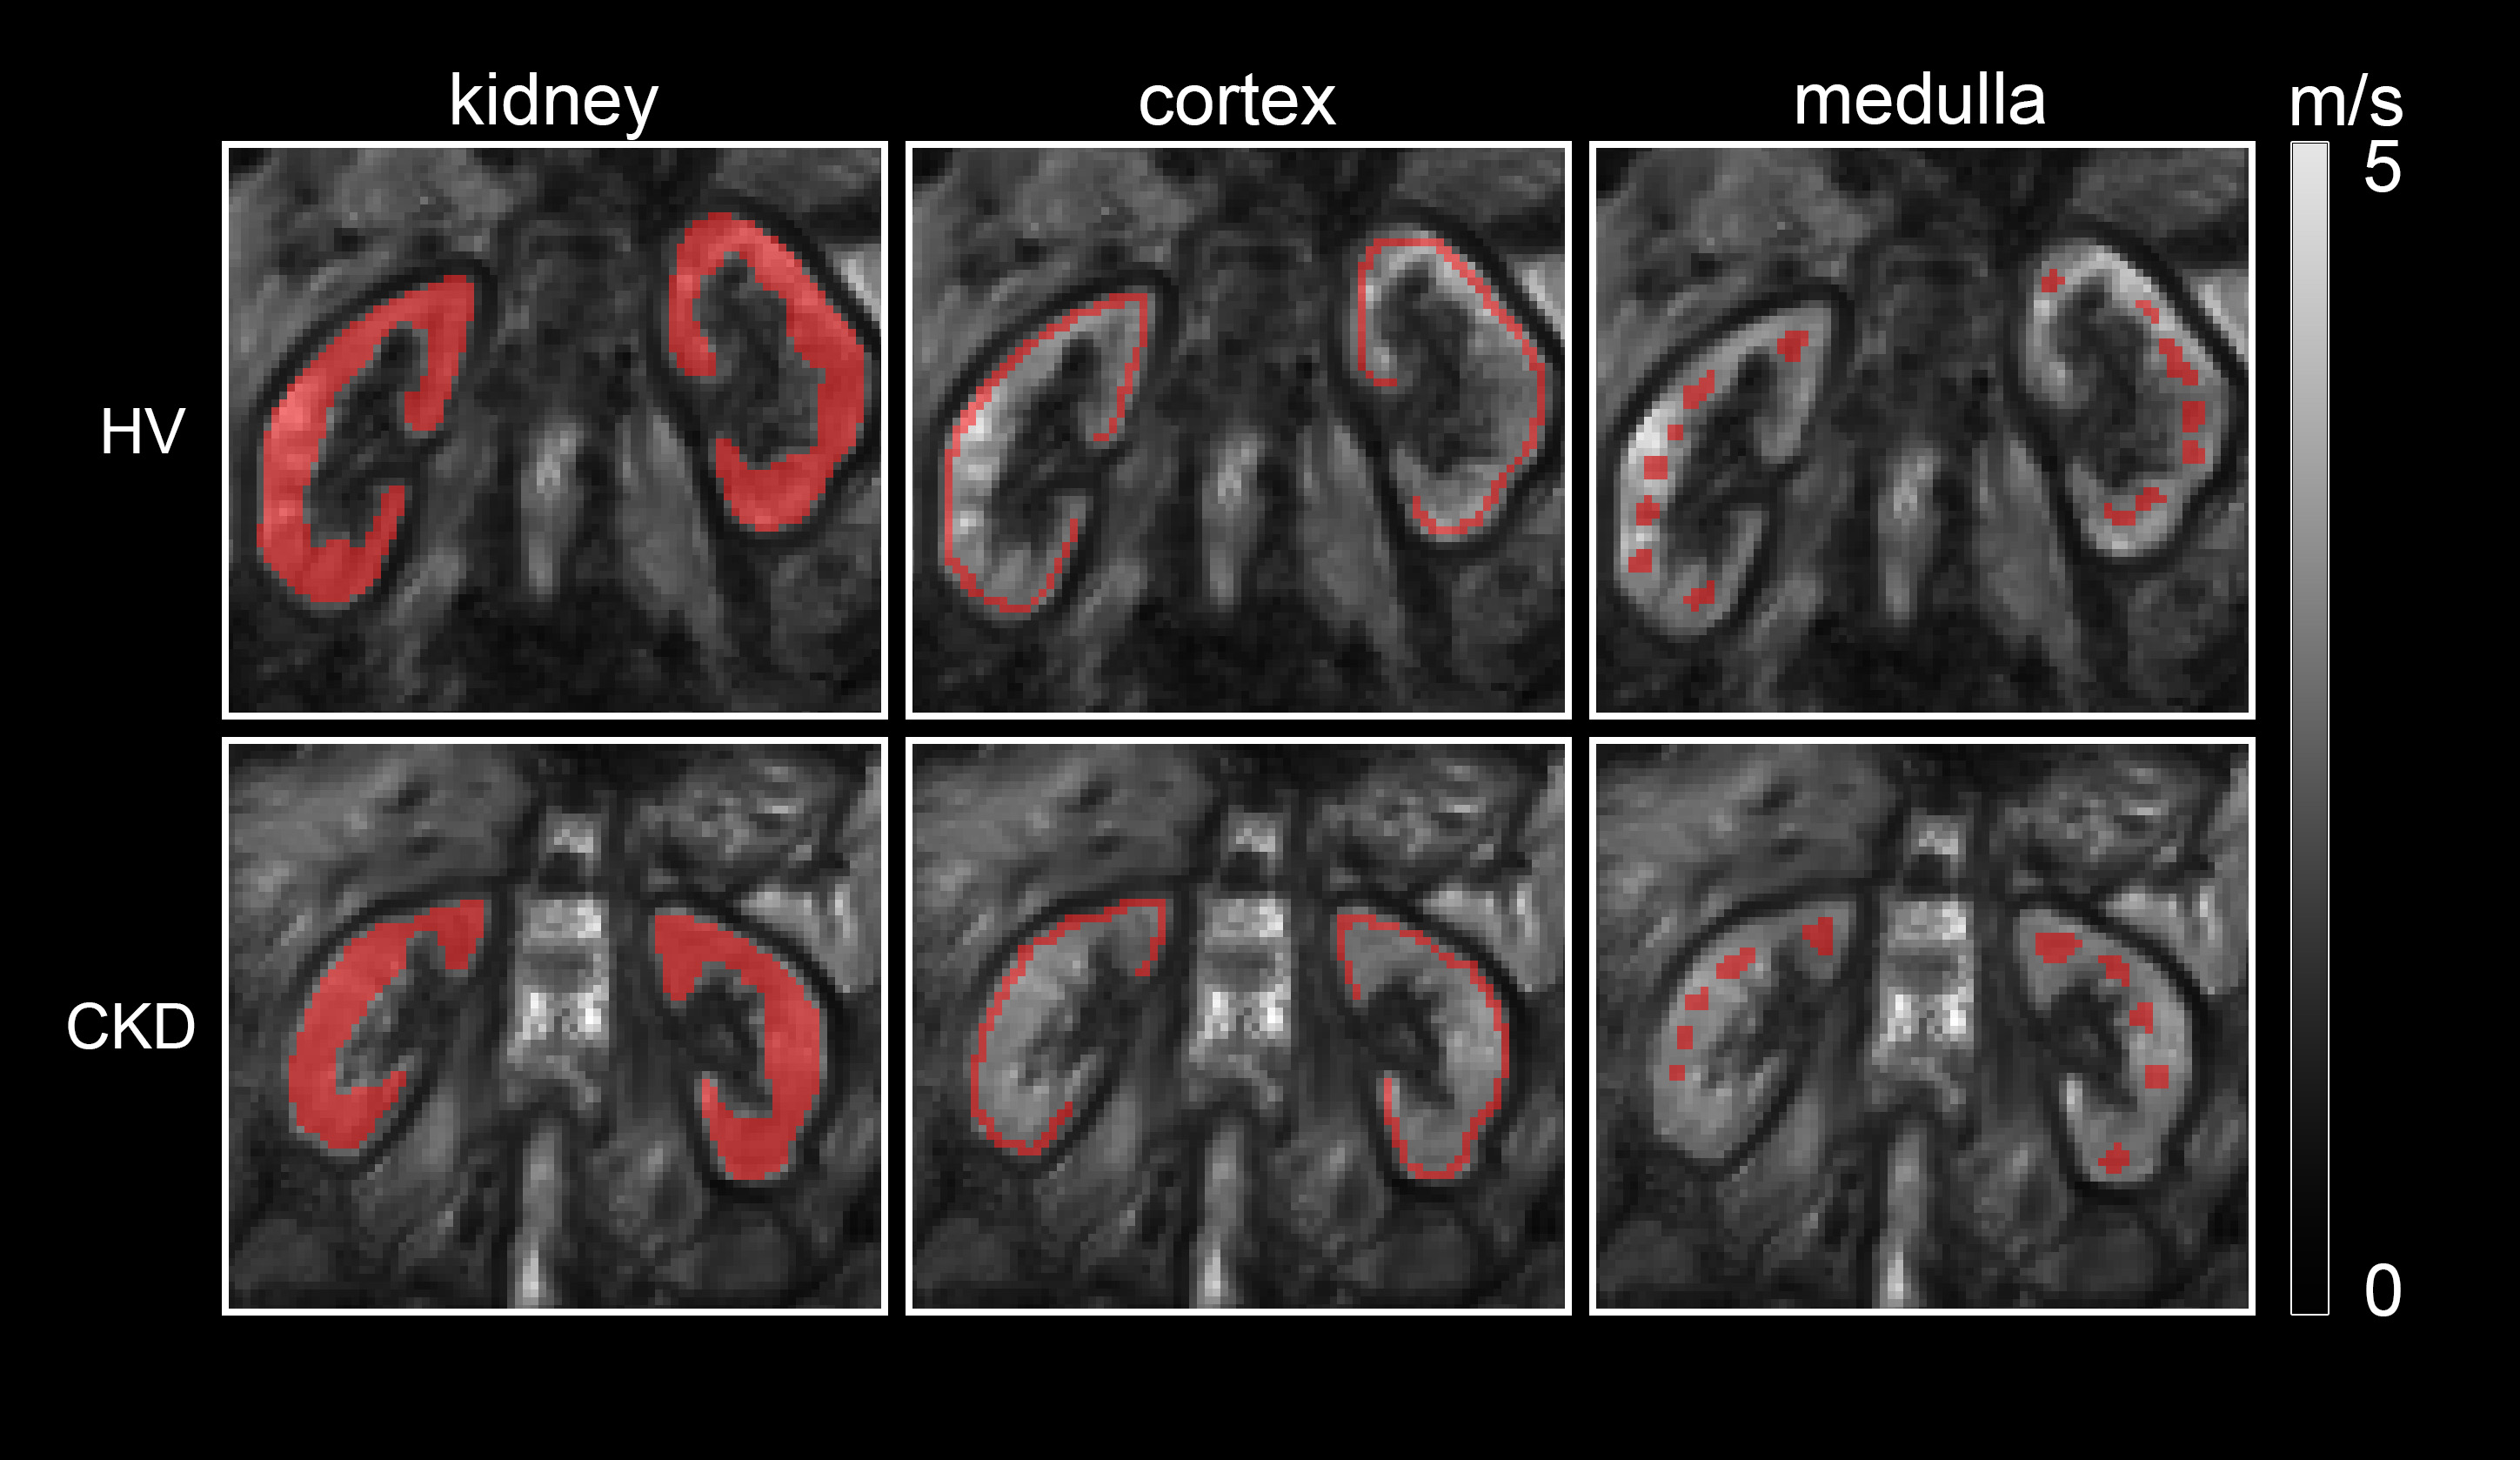
On a 3T system (MAGNETOM Prisma, Siemens Healthineers, Erlangen, Germany), 10 HVs underwent two kidney MRE scans 30 minutes apart, and 20 CKD patients underwent a single MRE scan. Subjects fasted for more than two hours prior.Passive drivers were placed behind both kidneys and fixed with an abdominal band.Scanning parameters are shown in Table1.The raw MRE images were uploaded to the official post-processing website of Humboldt University, Germany (https://bioqic-apps.charite. de), and the shear wave velocity C-map was obtained by post-processing withwavenumber-based multifrequency dual elasto-visco (k-MDEV) inversion algorithm[5].For SWS quantitative analysis by C-map imaging, a radiologist manually delineated the ROI(Figure 1). Forty manually divided C-map images including 20 HVs and 20 CKD patients were randomly split in an 8:2 ratio for training and testing, respectively.The HVs and patient proportion was consistent in both sets. The automatic segmentation models were constructedusing nnU-Net network structure, and the segmentation model performance was evaluated by the dice similarity coefficient (DSC)[6].
Paired t-tests compared the difference between the SWSof two MRE scans in HVs and calculated the intraclass correlation coefficients (ICC) and Coefficient of Repeatability (CR). Bland-Altman plots evaluated the reproducibility.Paired t-tests compared the SWS differences of the cortex and medulla. A two-sample t-test compared the SWS difference between HVs and CKD patients, and a receiver operating characteristic (ROC) curve determined the MRE diagnostic value. Spearman’s correlation assessed the relationship between clinical indicators and SWS.
Results
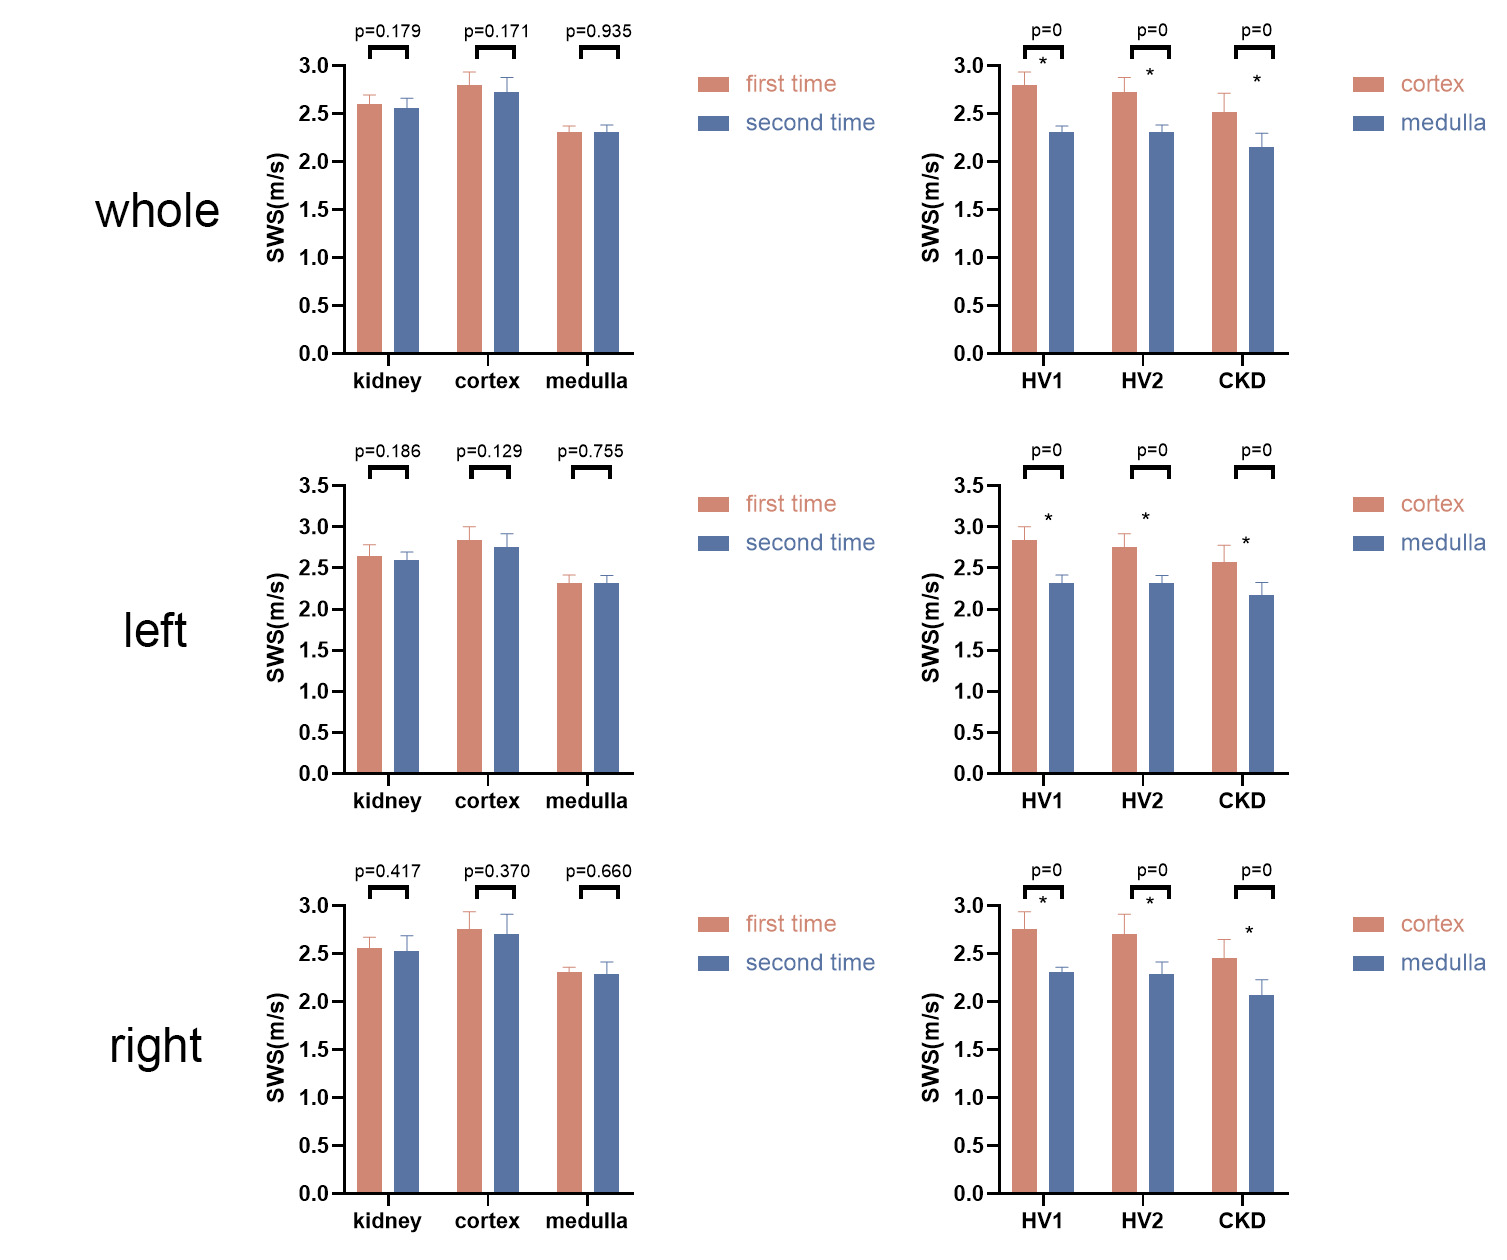
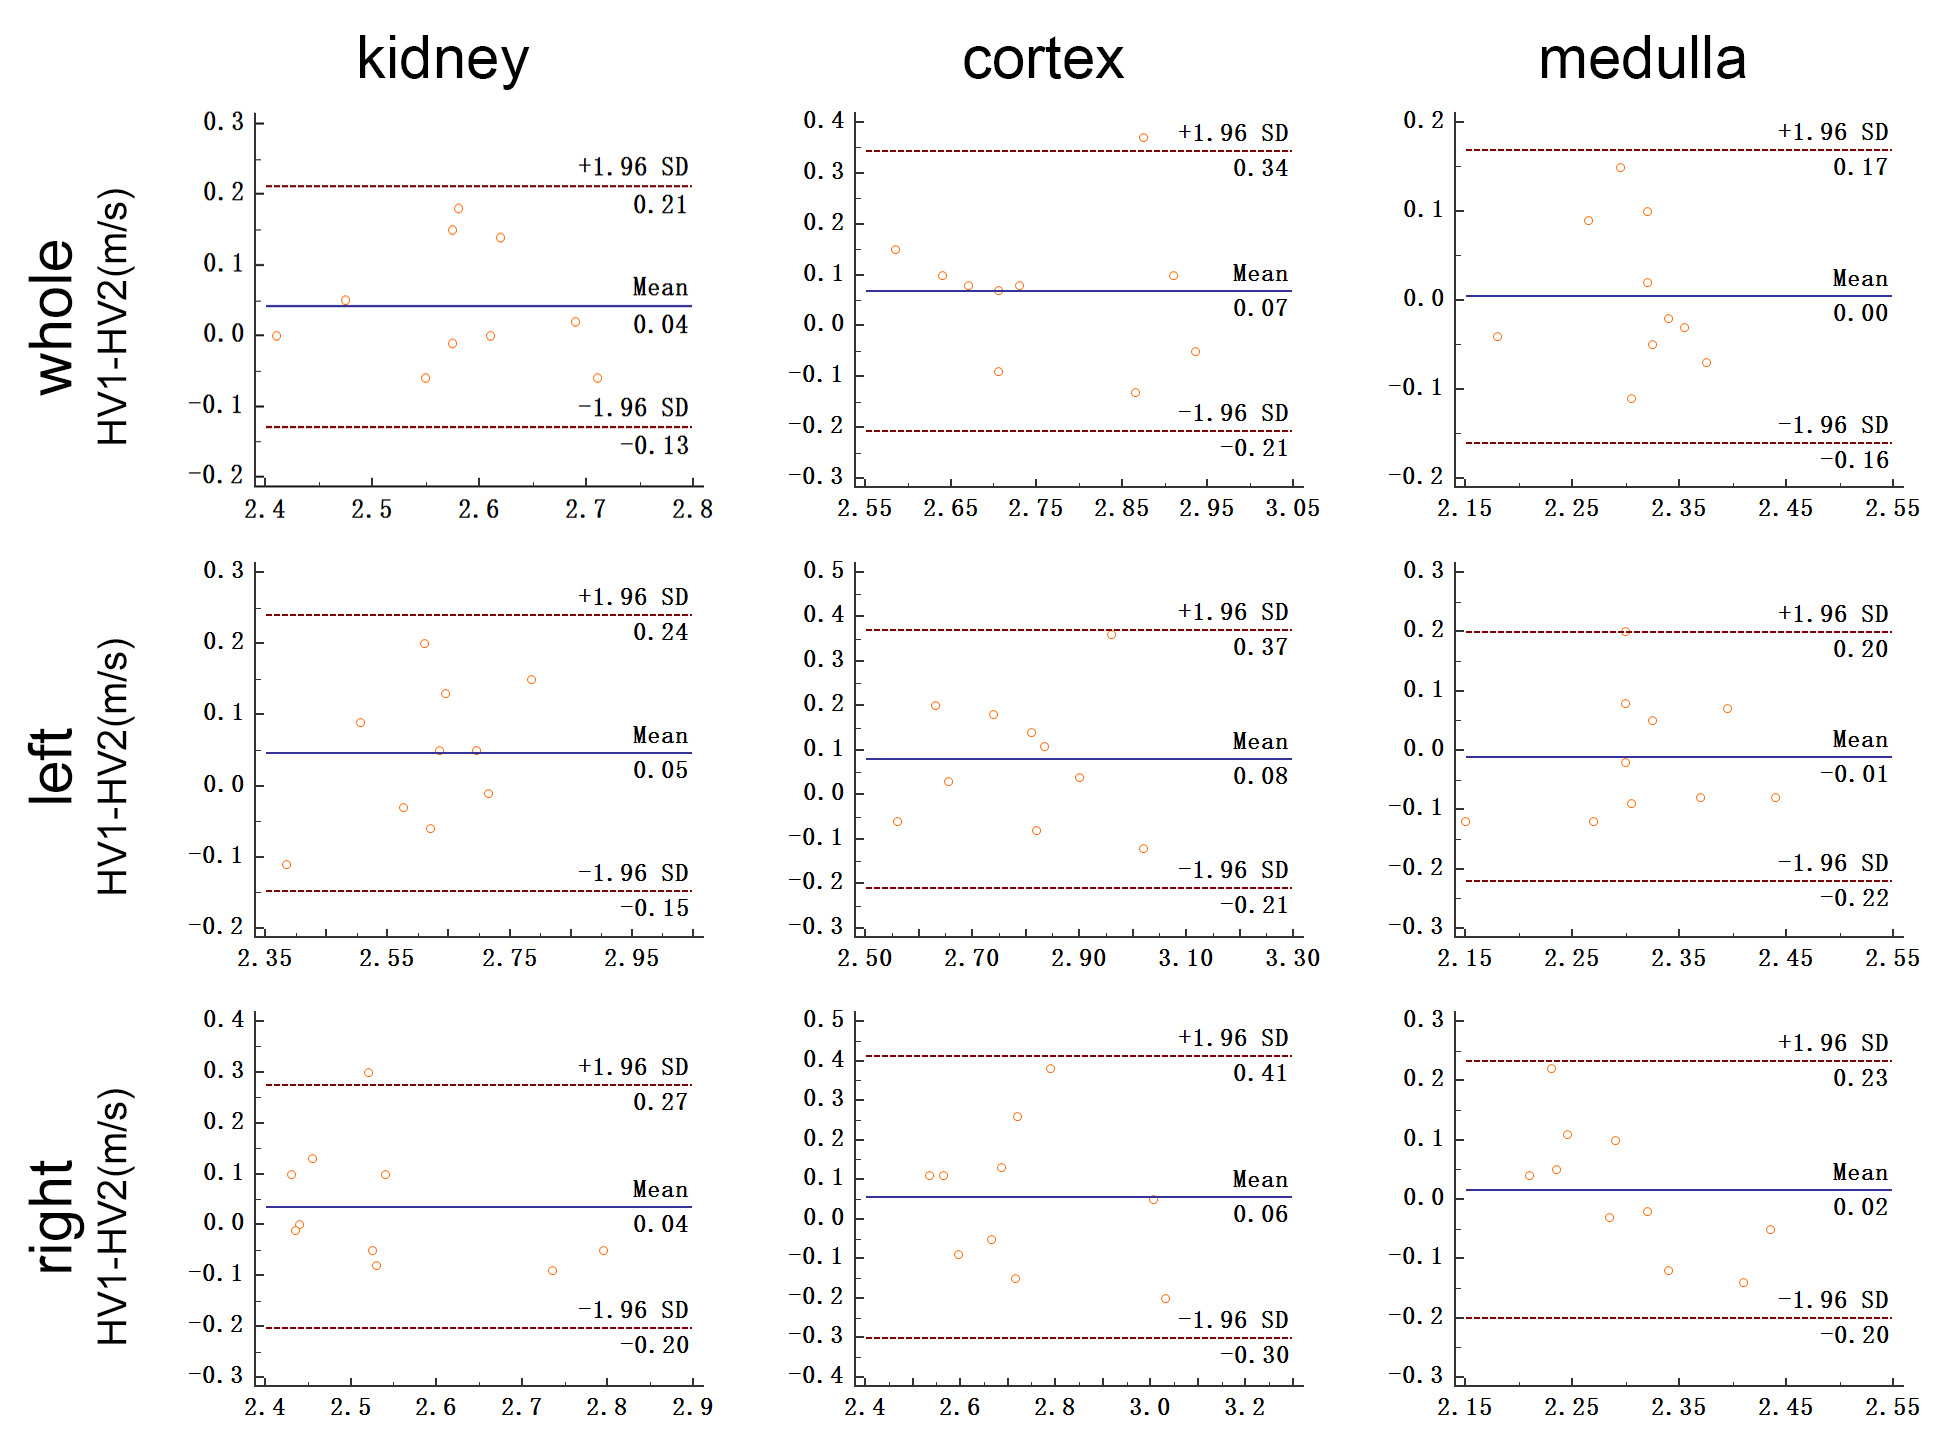
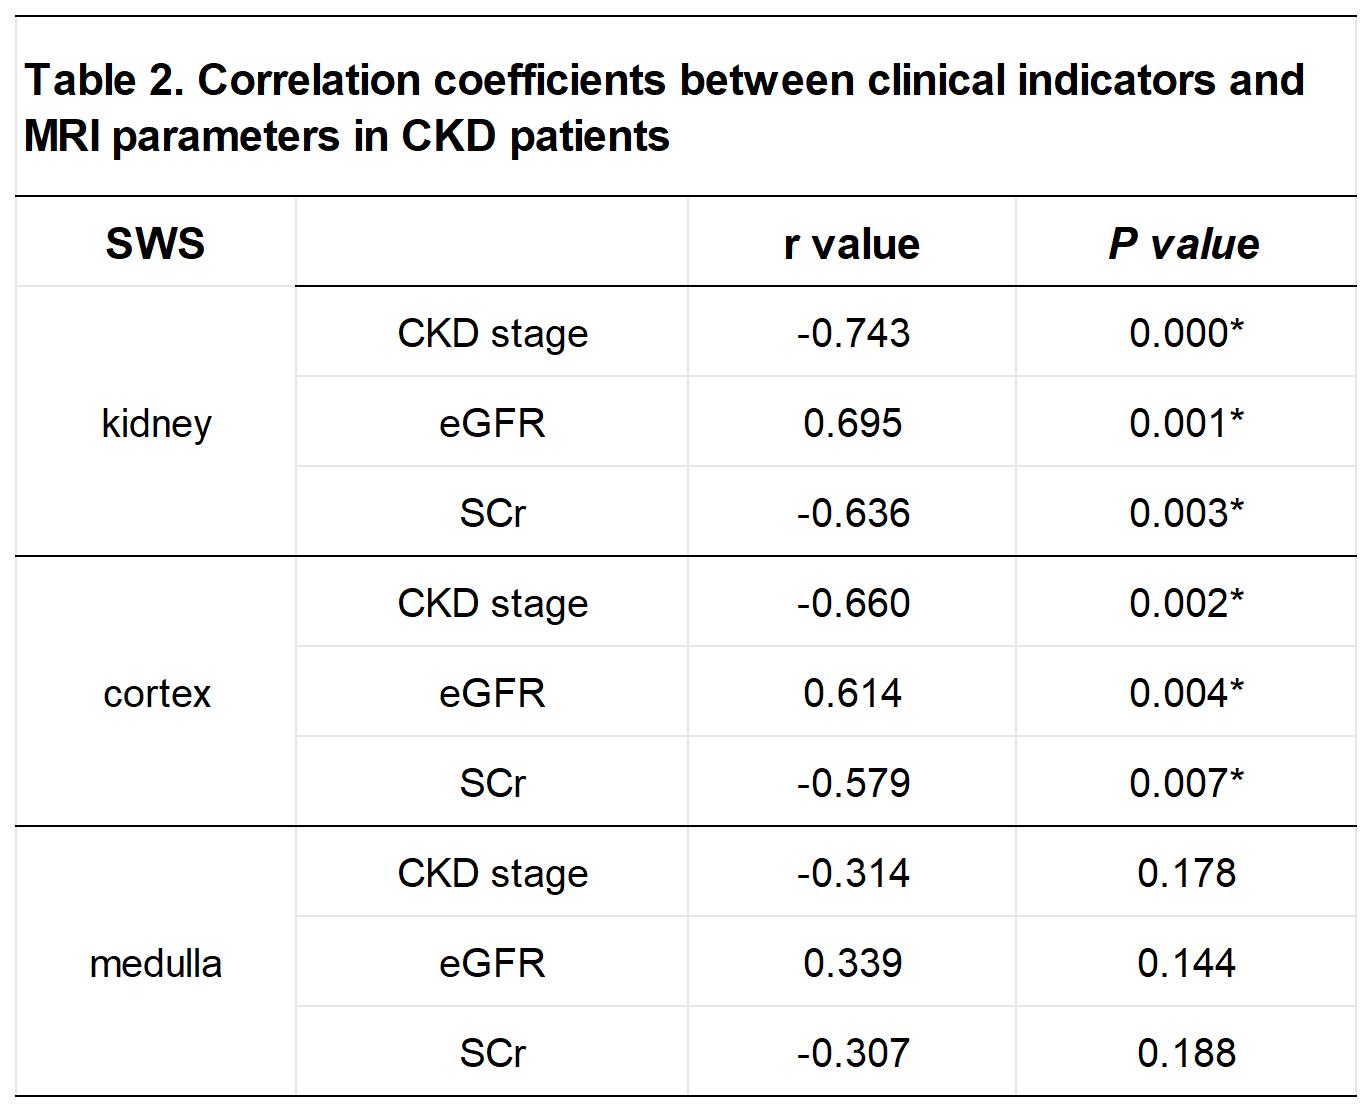
The mean DSCs of the whole kidney, cortex, and medulla were 0.87, 0.80, and 0.76 on the test set, respectively. As depicted in Figure 2, there was no difference between the SWS of two HVs scans (P > .05) , and SWS of medulla were significantly lower than those of cortex (P < .01). The values agreed well in the whole kidney (ICC = 0.611) but were poor in the cortex (ICC = 0.478) and medulla (ICC = 0.253). Bland-Altman plots are shown in Figure 3 and CR were less than 29%. The kidney SWS in CKD patients (whole kidney 2.39±0.21 m/s, cortex 2.52±0.20 m/s, and medulla 2.15±0.14 m/s) were lower than in HVs (whole kidney 2.60±0.10 m/s, cortex 2.80±0.14 m/s, and medulla 2.31±0.06 m/s)(P = .001/0/.001). The SWS AUC of the whole kidney, cortex, and medulla used to distinguish CKD from HVs were 0.810, 0.855 and 0.870, respectively. The relationship between the clinical indicators and SWS are shown in Table 2.Discussion
The automatic kidney segmentation model performed well, but the cortex and medulla did slightly worse than the whole kidney, possibly due to the demarcation blurring between the cortex and medulla in CKD patients, affecting the outlining accuracy. The CR results reveal high MRE repeatability, detecting changes exceeding 29% at a 95% confidence level. These fluctuations are most likely attributable to physiological or pathological factors rather than measurement errors.Despite producing high-quality MRE scans of HVs, the ICC and CR results were poor, likely due to centerline deviation during scan positioning or abdominal respiration[7] causing kidney movement. CKD patient SWS were consistently lower than HVs and declined further with advancing CKD stages, echoing previous kidney research findings[8-10]. This finding supports the utility of MRE in evaluating and monitoring renal fibrosis.Conclusions
It is feasible and reproducible to assess MRE in the kidney by an automatic segmentation model based on the nnU-Net network. Furthermore, multi-frequency MRE can be used to differentiate between healthy individuals and CKD patients, even predicting CKD staging.Acknowledgements
We thank Bingsheng Huang of Shenzhen University for his excellent help in AI automatic segmentation technology. We thank Jing Guo of Humboldt University in Berlin, Germany for their excellent help in MRE post-processing and analysis.References
[1] Han JH, Ahn JH, Kim JS. Magnetic resonance elastography for evaluation of renal parenchyma in chronic kidney disease: a pilot study. Radiol Med. 2020 Dec;125(12):1209-1215.[2] Rouvière O, Souchon R, Pagnoux G, Ménager JM, Chapelon JY. Magnetic resonance elastography of the kidneys: feasibility and reproducibility in young healthy adults. J Magn Reson Imaging. 2011 Oct;34(4):880-6.
[3] Low G, Owen NE, Joubert I, Patterson AJ, Graves MJ, Glaser KJ, Alexander GJ, Lomas DJ. Reliability of magnetic resonance elastography using multislice two-dimensional spin-echo echo-planar imaging (SE-EPI) and three-dimensional inversion reconstruction for assessing renal stiffness. J Magn Reson Imaging. 2015 Sep;42(3):844-50.
[4] Gandhi D, Kalra P, Raterman B, Mo X, Dong H, Kolipaka A. Magnetic Resonance Elastography of kidneys: SE-EPI MRE reproducibility and its comparison to GRE MRE. NMR Biomed. 2019 Nov;32(11):e4141.
[5] Meyer T, Marticorena Garcia S, Tzschätzsch H, et al. Comparison of inversion methods in MR elastography: An open-access pipeline for processing multifrequency shear-wave data and demonstration in a phantom, human kidneys, and brain [J]. Magn Reson Med, 2022, 88(4): 1840-50.
[6] Isensee F, Jaeger PF, Kohl SAA, Petersen J, Maier-Hein KH. nnU-Net: a self-configuring method for deep learning-based biomedical image segmentation. Nat Methods. 2021 Feb;18(2):203-211.
[7] Schwartz LH, Richaud J, Buffat L, Touboul E, Schlienger M. Kidney mobility during respiration. Radiother Oncol. 1994; 32: 84-86.
[8] Brown RS, Sun MRM, Stillman IE, Russell TL, Rosas SE, Wei JL. The utility of magnetic resonance imaging for noninvasive evaluation of diabetic nephropathy. Nephrol Dial Transplant. 2020 Jun 1;35(6):970-978.
[9] Lang ST, Guo J, Bruns A, Dürr M, Braun J, Hamm B, Sack I, Marticorena Garcia SR. Multiparametric Quantitative MRI for the Detection of IgA Nephropathy Using Tomoelastography, DWI, and BOLD Imaging. Invest Radiol. 2019 Oct;54(10):669-674.
[10] Marticorena Garcia SR, Grossmann M, Bruns A, Dürr M, Tzschätzsch H, Hamm B, Braun J, Sack I, Guo J. Tomoelastography Paired With T2* Magnetic Resonance Imaging Detects Lupus Nephritis With Normal Renal Function. Invest Radiol. 2019 Feb;54(2):89-97.
Figures