3626
Deep learning-based Reconstruction with Super Resolution for Abdominal Diffusion Weighted Imaging1Philips Japan, Tokyo, Japan, 2Tokyo Metropolitan Police Hospital, Tokyo, Japan, 3BIU MR, Philips Healthcare, Tokyo, Japan
Synopsis
Keywords: Pancreas, Image Reconstruction, AI, Super Resolution
Motivation: Abdominal diffusion-weighted imaging (DWI) plays a significant role in the detection and characterization of lesions. However, the spatial resolution of single-shot echo-planar imaging (ssh-EPI) readout is limited by the acquisition time.
Goal(s): To enhance the image quality and sharpness of abdominal ssh-EPI-DWI image using a prototype AI-based reconstruction technique (SuperRes).
Approach: We examined eight healthy volunteers using abdominal ssh-EPI-DWI, and the acquired data were reconstructed using both conventional Compressed SENSE and SuperRes. The image quality was assessed qualitatively and quantitatively.
Results: SuperRes demonstrated a significant improvement in the image quality and sharpness of both DWI and ADC map.
Impact: The dedicated deep learning-based super-resolution technique enhanced the image quality and sharpness in abdominal ssh-EPI-DWI. Enhanced sharpness resulted in better delineation of structures, such as the pancreas. The improvement in image quality was demonstrated in both qualitative and quantitative assessments.
Introduction
Abdominal diffusion-weighted imaging (DWI) has been garnering a lot of interest in recent years. Previous studies have shown that abdominal DWI is useful for liver and pancreatic lesion detection and characterization1–7, as well as evaluating fibrosis and inflammation8–10. Abdominal DWI is typically acquired with a single-shot echo-planar imaging (ssh-EPI) readout to mitigate motion. However, the spatial resolution of ssh-EPI DWI is inherently limited by acquisition time, despite the use of scan acceleration techniques such as compressed sensing11,12.Recently there has been a growing interest in utilizing Artificial Intelligence (AI) to improve the spatial resolution of medical images13. In the context of body DWI, this technique known as "SuperResolution AI" has demonstrated improved sharpness and enhanced delineation of breast cancer14,15. However, there is limited research applying such AI for abdominal DWI.
In this study, two types of AI were used to initially eliminate noise and undersampling artifacts from the image and then to enhance its sharpness. The purpose of this study was to acquire high-resolution and high-SNR abdominal ssh-EPI-DWI images using the vendor-provided AI-based reconstruction software (SuperRes) and compare the resulting image quality with that of conventional Compressed SENSE (C-SENSE) reconstruction.
Materials and Methods
Image acquisition: A total of eight volunteers were examined on a 3.0T whole-body clinical system (Ingenia Elition X, Philips Healthcare) using a 32-channel phased-array coil. Respiratory triggered multi-slice 2D ssh-EPI-DWI sequence was acquired in the axial plane with the following parameters: 25 slices, slice thickness=7mm, acquisition resolution=3.5×3.5mm2, reconstruction resolution=1.6×1.6mm2, b-value=0 and 800s/mm2, TR/TE=1306/49ms, acceleration factor=2.5, number of signals averaged=5, and the scan time was 1min48sec.Reconstruction: The images were reconstructed using C-SENSE and SuperRes. SuperRes reconstruction technique consists of a series of convolutional neural networks (CNNs): Adaptive-CS-Net17 allows to reconstruct images acquired with C-SENSE based variable density undersampling patterns. This CNN is applied during the coil combination, removing the noise and related undersampling artifacts from the images in order to obtain good image quality from accelerated acquisitions18. Subsequently, neural network known as Super-Resolution Net14,19 was applied to remove ringing artefacts and to replace the traditional zero-filling strategy to increase the matrix size and therewith the sharpness of the images. This network is trained on pairs of low- and high-resolution data with k-space crops to induce ringing. In addition, data consistency checks were implemented to match the resulting k-space with the measured k-space data. The full reconstruction pipeline generates images with improved SNR and sharpness, higher matrix size and reduced ringing artefacts and can be applied to all 2D cartesian acquisitions20.
Qualitative analysis: a radiologist evaluated visual image quality scores on b=800s/mm2 image of C-SENSE and SuperRes reconstructions. The evaluation was conducted on a 5-point scale score (1-5; 1=poor, 5=excellent) for overall image quality, sharpness, and artifact presence.
Quantitative analysis: simplified Sharpness Index (SI)21 was computed for every slice using publicly available MATLAB code22 (ver2019a, MathWorks, Natick, MA). Here, SI refers to a no-reference image quality assessment metric that measures image sharpness by utilizing the fact that phase congruency in the Fourier space is degraded when the image is blurry. To compare SI between C-SENSE and SuperRes, a paired t-test was conducted, and P<0.01 was considered significant.
Results and Discussions
Figure 1 shows comparison of b=0 s/mm2 images between C-SENSE and SuperRes. SuperRes delineated vascular pattern more clearly compared to C-SENSE. This observation was supported by higher SI in SuperRes (430.6 vs 842.1). Figures 2 shows comparisons of b=0 and 800 s/mm2 images and ADC map between C-SENSE and SuperRes. Visually, SuperRes showed improved sharpness in both b=0 and 800 s/mm2 images, which resulted in improved delineation of pancreas on ADC map compared with C-SENSE (arrows). SuperRes also showed higher SI than C-SENSE. Figure 3 shows the visual assessment scores. SuperRes improved the median visual scores compared to C-SENSE for overall image quality (3 vs 4), sharpness (3 vs 3.5), and artifact (3 vs 4). Figure 4 shows the trend of SI with respect to slice number. SuperRes demonstrated consistently higher SI values compared to C-SENSE, while exhibiting a similar trend. Figure 5 shows the comparison of SI computed from every slice of all subjects. Compared to C-SENSE, SuperRes showed significantly higher average SI values on both b=0 (455.9±83.2 vs 940.5±168.0) and b=800 s/mm2 (355.2±117.8 vs 614.0±219.2).Conclusion
High-resolution and high-SNR DWI images for the abdomen were reconstructed using a prototype AI-based reconstruction software. The improved image quality and sharpness were demonstrated through both visual assessment and quantitative evaluation using SI. Further investigations are necessary to validate if the improved sharpness enables better detection of liver and pancreatic cancer.Acknowledgements
No acknowledgement found.References
1. Zhou J, Heo HY, Knutsson L, van Zijl PCM, Jiang S. APT-weighted MRI: Techniques, current neuro applications, and challenging issues. J Magn Reson Imaging. 2019;50(2):347-364. doi:10.1002/jmri.26645
2. Coenegrachts K, Delanote J, Ter Beek L, et al. Improved focal liver lesion detection: Comparison of single-shot diffusion-weighted echoplanar and single-shot T2 weighted turbo spin echo techniques. Br J Radiol. 2007;80(955):524-531. doi:10.1259/bjr/33156643
3. Bruegel M, Holzapfel K, Gaa J, et al. Characterization of focal liver lesions by ADC measurements using a respiratory triggered diffusion-weighted single-shot echo-planar MR imaging technique. Eur Radiol. 2008;18(3):477-485. doi:10.1007/s00330-007-0785-9
4. Vandecaveye V, De Keyzer F, Verslype C, et al. Diffusion-weighted MRI provides additional value to conventional dynamic contrast-enhanced MRI for detection of hepatocellular carcinoma. Eur Radiol. 2009;19(10):2456-2466. doi:10.1007/s00330-009-1431-5
5. Galea N, Cantisani V, Taouli B. Liver lesion detection and characterization: Role of diffusion-weighted imaging. J Magn Reson Imaging. 2013;37(6):1260-1276. doi:10.1002/jmri.23947
6. Zong RL, Geng L, Wang X, Xie D. Diagnostic Performance of Apparent Diffusion Coefficient for Prediction of Grading of Pancreatic Neuroendocrine Tumors: A Systematic Review and Meta-analysis. Pancreas. 2019;48(2):151-160. doi:10.1097/MPA.0000000000001212
7. Garces-Descovich A, Morrison TC, Beker K, Jaramillo-Cardoso A, Moser AJ, Mortele KJ. DWI of pancreatic ductal adenocarcinoma: A pilot study to estimate the correlation with metastatic disease potential and overall survival. Am J Roentgenol. 2019;212(2):323-331. doi:10.2214/AJR.18.20017
8. Obara M, Kwon J, Yoneyama M, Ueda Y, Cauteren M Van. Technical Advancements in Abdominal Diffusion-weighted Imaging. Magn Reson Med Sci. 2023;22(2):rev.2022-0107. doi:10.2463/mrms.rev.2022-0107
9. Taouli B, Chouli M, Martin AJ, Qayyum A, Coakley F, Vilgrain V. Chronic hepatitis: Role of diffusion-weighted imaging and diffusion tensor imaging for the diagnosis of liver fibrosis and inflammation. J Magn Reson Imaging. 2008;28(1):89-95. doi:10.1002/jmri.21227
10. Bakan AA, Inci E, Bakan S, Gokturk S, Cimilli T. Utility of diffusion-weighted imaging in the evaluation of liver fibrosis. Eur Radiol. 2012;22(3):682-687. doi:10.1007/s00330-011-2295-z
11. Ichikawa S, Motosugi U, Morisaka H, et al. MRI-based staging of hepatic fibrosis: Comparison of intravoxel incoherent motion diffusion-weighted imaging with magnetic resonance elastography. J Magn Reson Imaging. 2015;42(1):204-210. doi:10.1002/jmri.24760
12. Lustig M, Donoho D, Pauly JM. Sparse MRI: The application of compressed sensing for rapid MR imaging. Magn Reson Med. 2007;58(6):1182-1195. doi:10.1002/mrm.21391
13. Chen N kuei, Guidon A, Chang HC, Song AW. A robust multi-shot scan strategy for high-resolution diffusion weighted MRI enabled by multiplexed sensitivity-encoding (MUSE). Neuroimage. 2013;72(1):41-47. doi:10.1016/j.neuroimage.2013.01.038
14. Li Y, Sixou B, Peyrin F. A Review of the Deep Learning Methods for Medical Images Super Resolution Problems. Irbm. 2021;42(2):120-133. doi:10.1016/j.irbm.2020.08.004
15. Fan M, Liu Z, Xu M, et al. Generative adversarial network-based super-resolution of diffusion-weighted imaging: Application to tumour radiomics in breast cancer. NMR Biomed. 2020;33(8):1-12. doi:10.1002/nbm.4345
16. Delbany M, Bustin A, Poujol J, et al. One-millimeter isotropic breast diffusion-weighted imaging: Evaluation of a superresolution strategy in terms of signal-to-noise ratio, sharpness and apparent diffusion coefficient. Magn Reson Med. 2019;81(4):2588-2599. doi:10.1002/mrm.27591
17. Pezzotti N, de Weerdt E, Yousefi S, et al. Adaptive-CS-Net: FastMRI with Adaptive Intelligence. arxiv. 2019;(NeurIPS). http://arxiv.org/abs/1912.12259
18. Peeters H, Chung H, Valvano G, et al. Philips SmartSpeed No compromise and robustness.
19. Chaudhari AS, Fang Z, Kogan F, et al. Super‐resolution musculoskeletal MRI using deep learning. Magn Reson Med. 2018;80(5):2139-2154. doi:10.1002/mrm.27178
20. Bischoff LM, Peeters JM, Weinhold L, et al. Deep Learning Super-Resolution Reconstruction for Fast and Motion-Robust T2-weighted Prostate MRI. Radiology. 2023;308(3). doi:10.1148/radiol.230427
21. Leclaire A, Moisan L. No-Reference Image Quality Assessment and Blind Deblurring with Sharpness Metrics Exploiting Fourier Phase Information. J Math Imaging Vis. 2015;52(1):145-172. doi:10.1007/s10851-015-0560-5
22. Moisan L. Phase Coherence and Sharpness Metrics. Published 2014. https://helios2.mi.parisdescartes.fr/~moisan/sharpness/
Figures
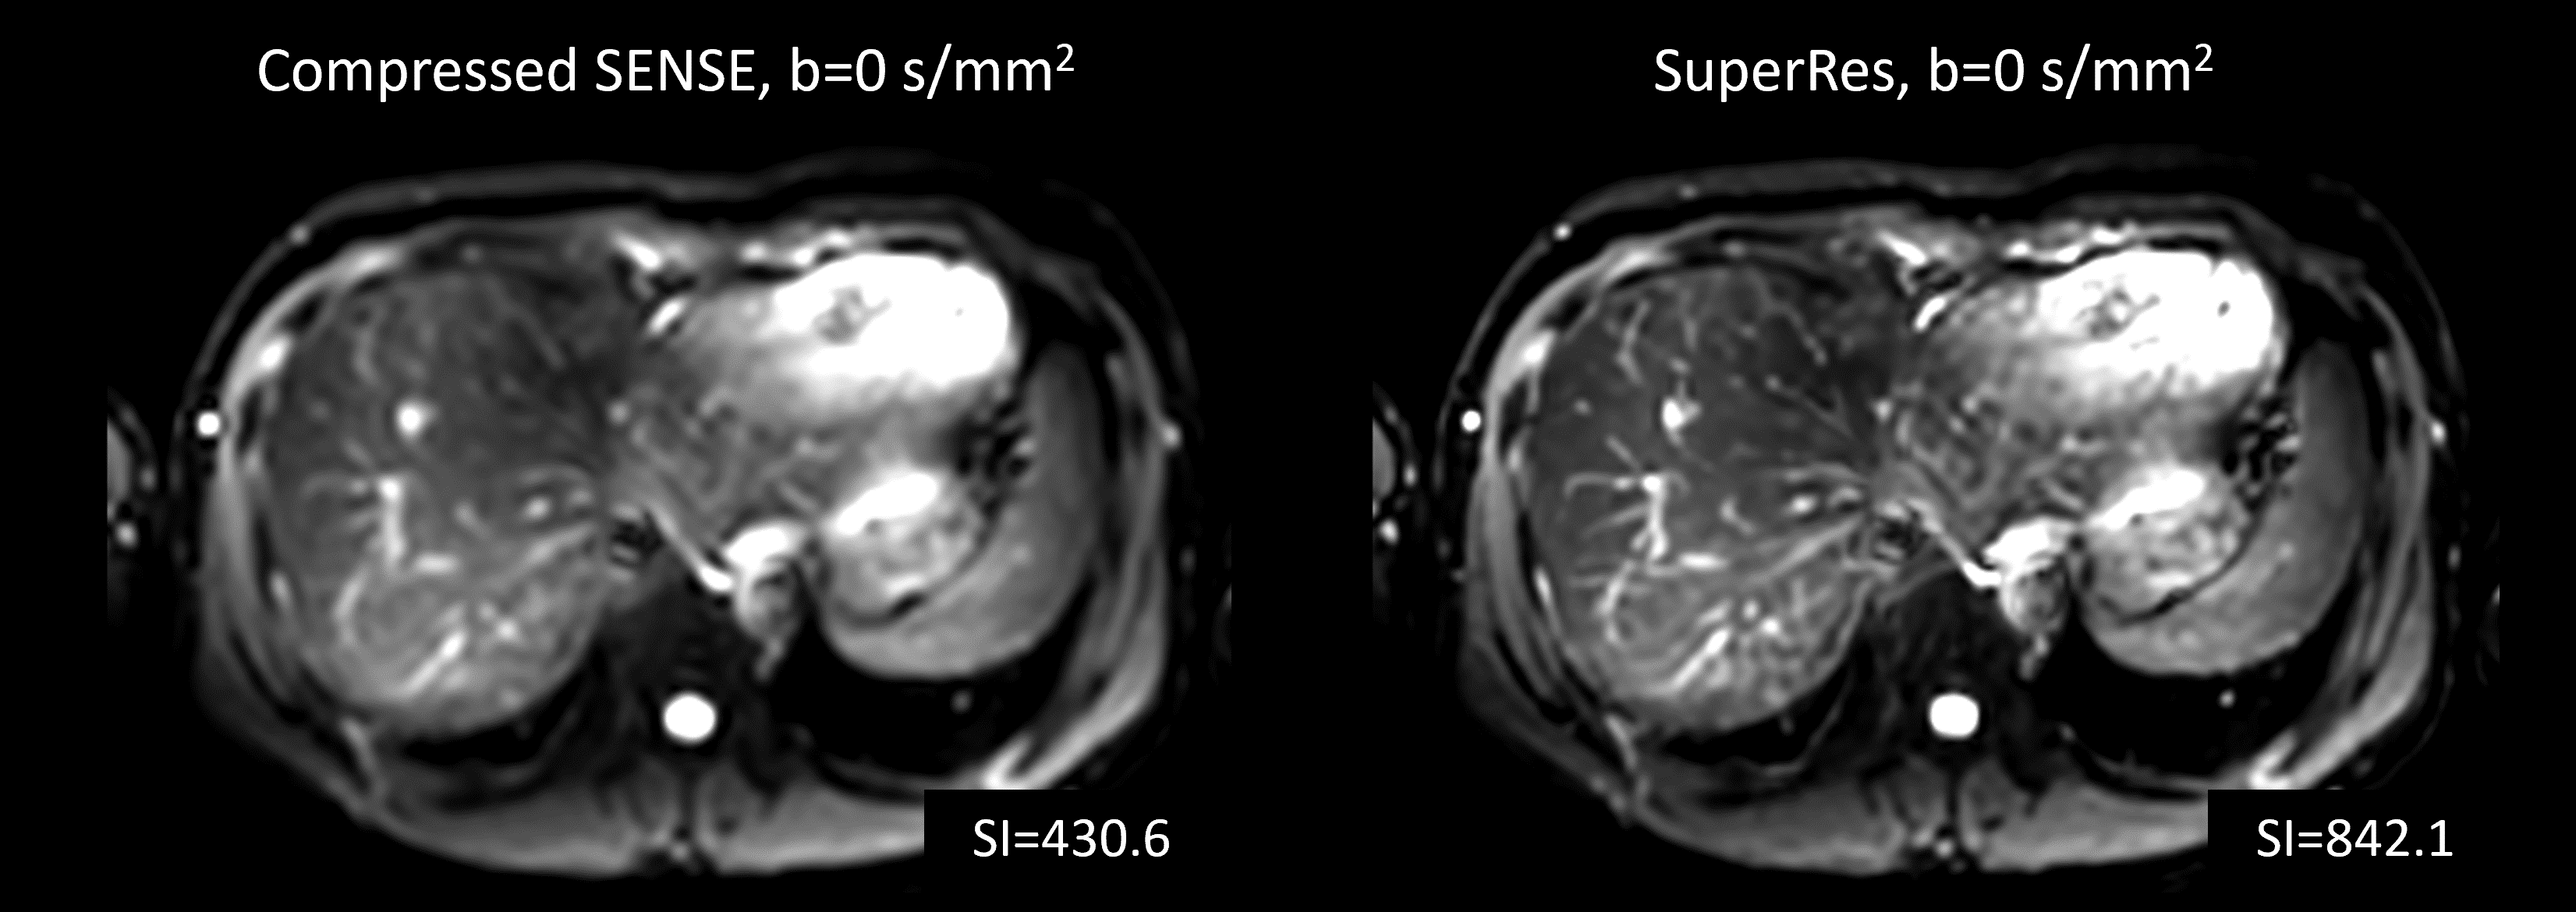
Figure 1. Liver single-shot EPI-DWI b = 0 s/mm2 images reconstructed with Compressed SENSE (left) and SuperRes (right). The values in the bottom right of each image indicate the Sharpness Index (SI).
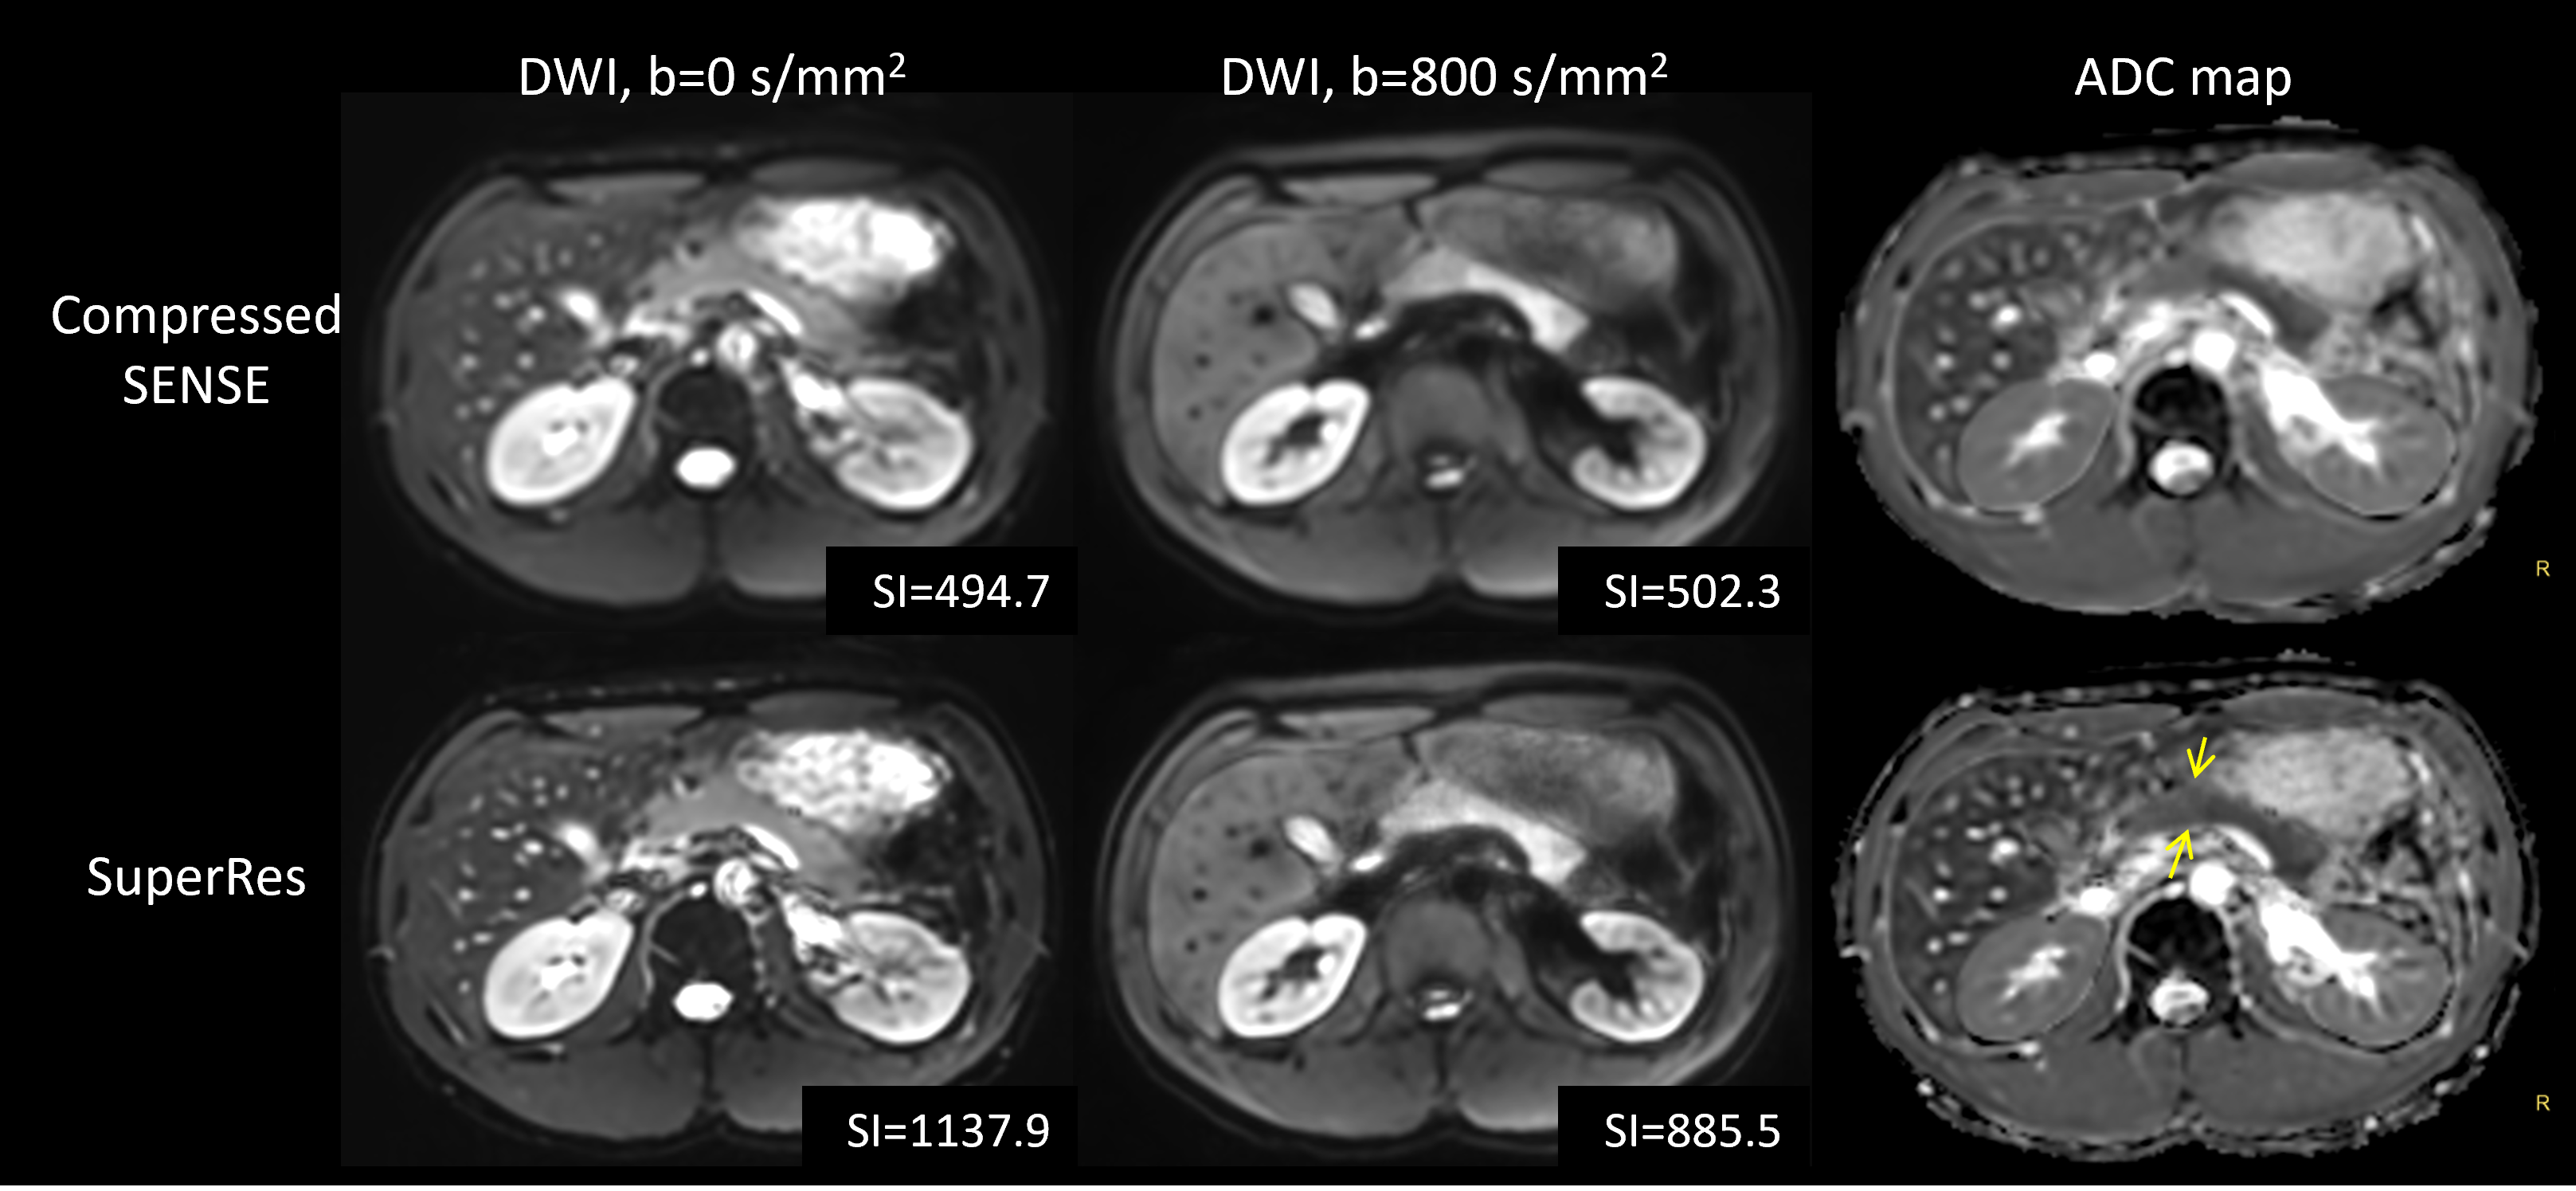
Figure 2. b = 0 (left column), b = 800 s/mm2 (middle column) images, and ADC maps (right row) of the abdomen in a healthy volunteer obtained with single-shot EPI-DWI, for Compressed SENSE (upper row), and SuperRes (bottom row). Arrows on ADC map indicate the improved delineation of pancreas boundary by SuperRes. The values in the bottom right of each image indicate the Sharpness Index (SI).
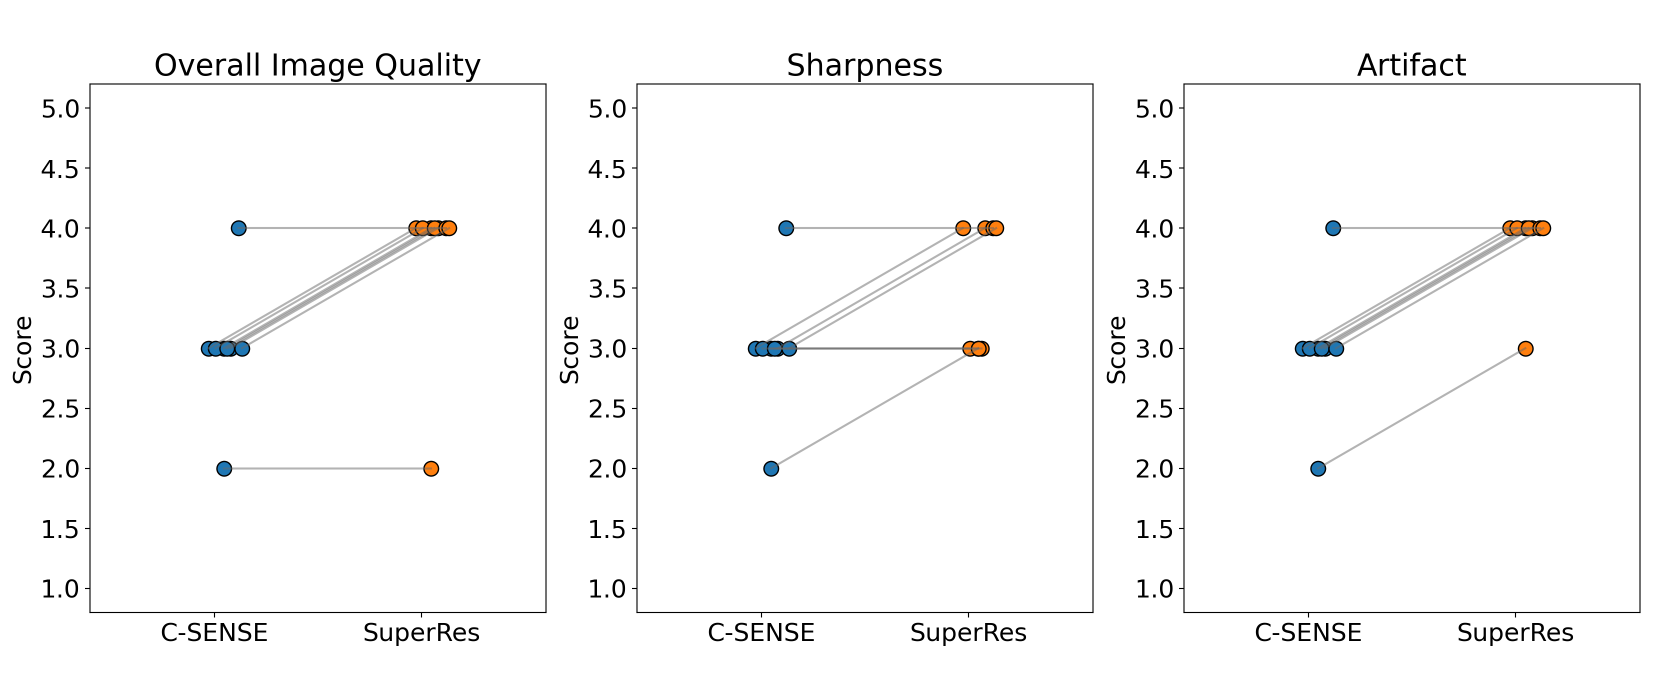
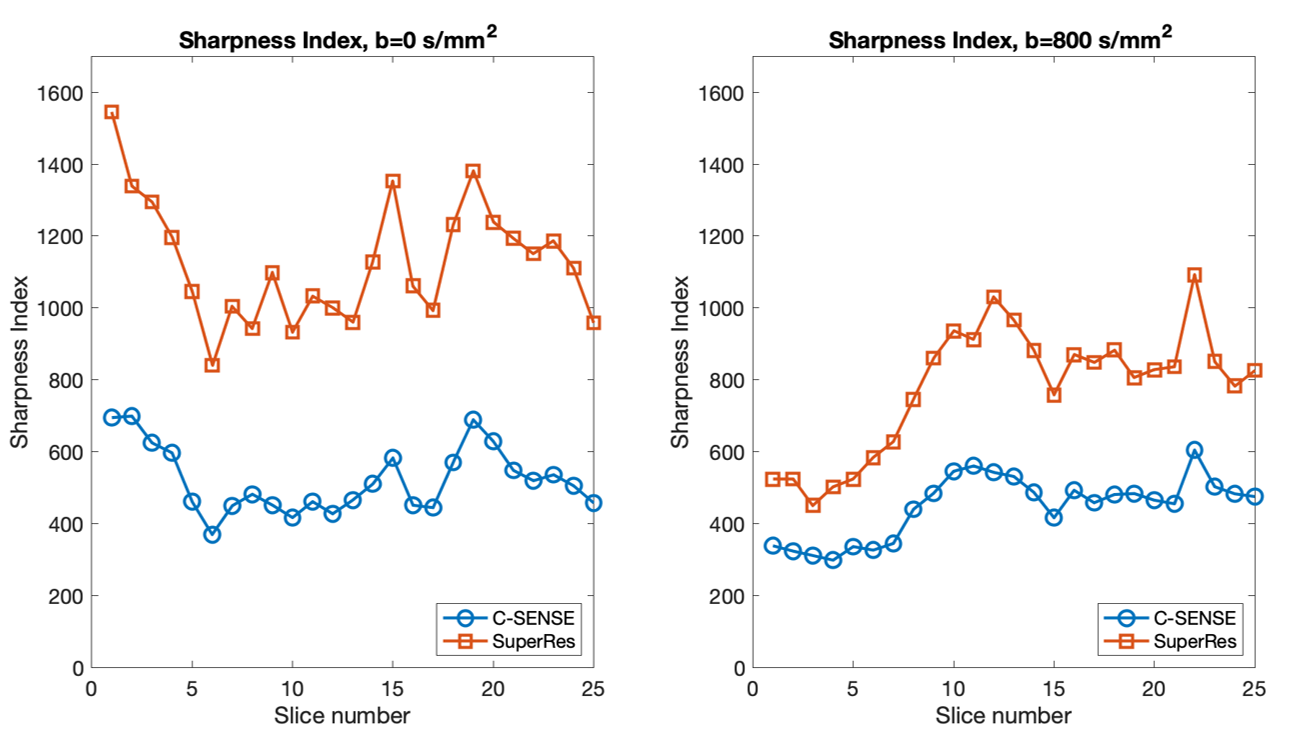
Figure 4. The trend of Sharpness Index (SI) taken from every slice of one subject, with respect to slice number. Smaller slice number corresponds to the cranial side. In the first few slices, the SI showed opposite trend between b = 0 (left) and b = 800 s/mm2 (right). This is because the upper edge of the FOV corresponds to cardiac and lung level, which show little signal at b = 800 s/mm2.
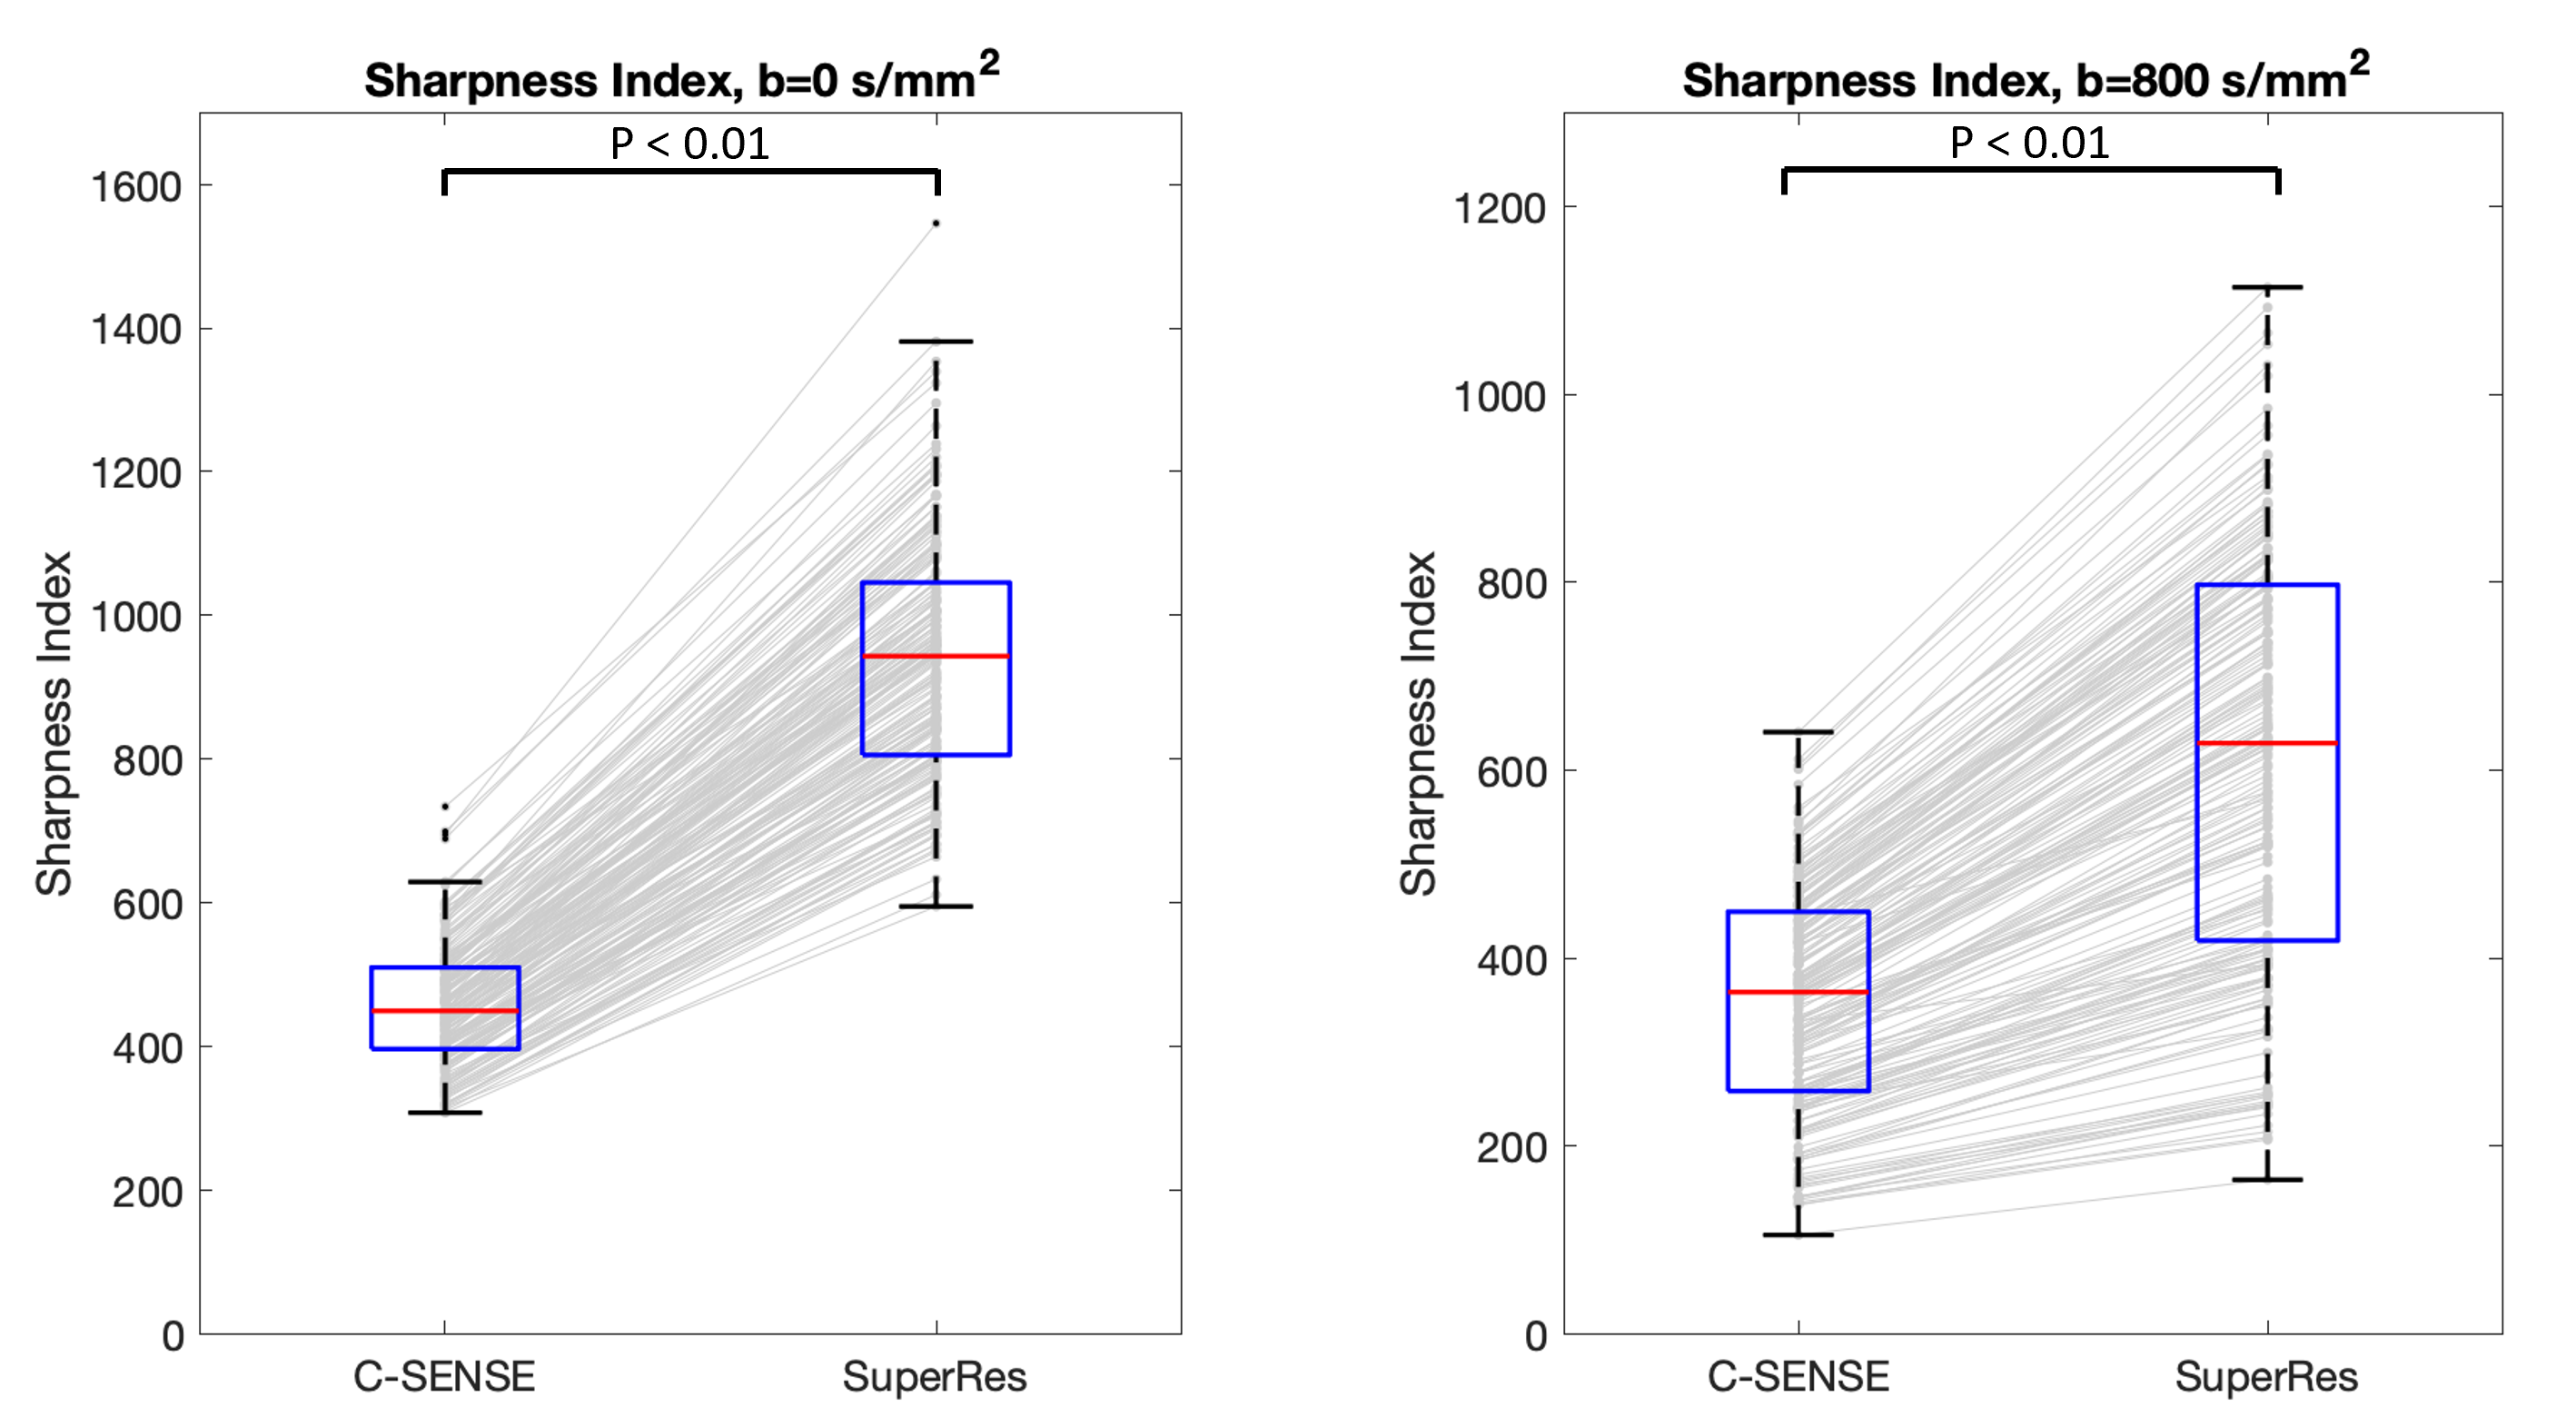
Figure 5. Comparison of Sharpness Index (SI) between Compressed SENSE and SuperRes for b = 0 (left) and b = 800 s/mm2 (right) images. SI was measured in every slice of all subjects. Horizontal red lines indicate the median. The differences of the average SI between Compressed SENSE and SuperRes were statistically significant for both b = 0 and b = 800 s/mm2 images (p<0.01).