3624
MRI-based radiomics analysis of different components of primary lower extremity lymphedema1Department of Radiology, Beijing Shijitan Hospital, Capital Medical University, Beijing, China, Beijing, China, 2Institute of Research and Clinical Innovations, Neusoft Medical Systems Co., Ltd, Shanghai, China
Synopsis
Keywords: Diagnosis/Prediction, Machine Learning/Artificial Intelligence
Motivation: Fluid and fat accumulation can be observed in MRI images of patients with PLEL; however, the microscopic characteristics of the different components of PLEL are currently unknown.
Goal(s): This study aimed to explore the MRI radiomics features of different components of subcutaneous soft tissues in patients with PLEL, such as simple fat, mixed fat and water, fat interstitial edema, and effusion
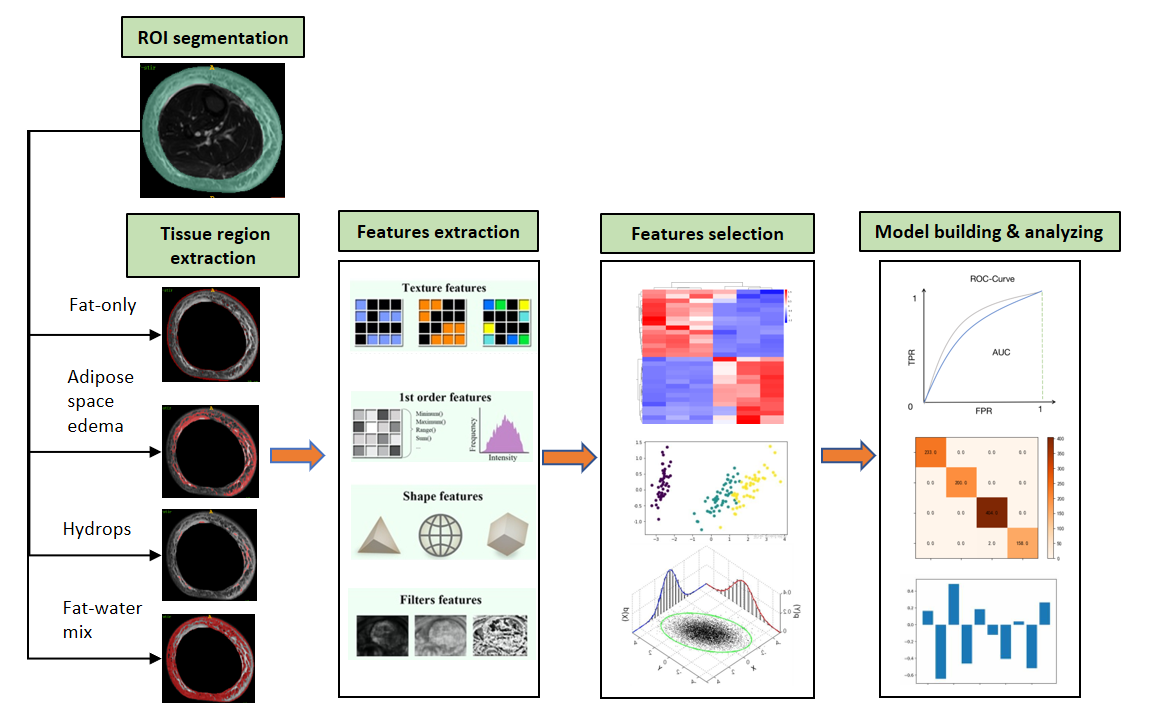
Approach: We propose a machine learning model to analyze the radiomics characteristics of different tissue components of lower extremity lymphedema in MRI.
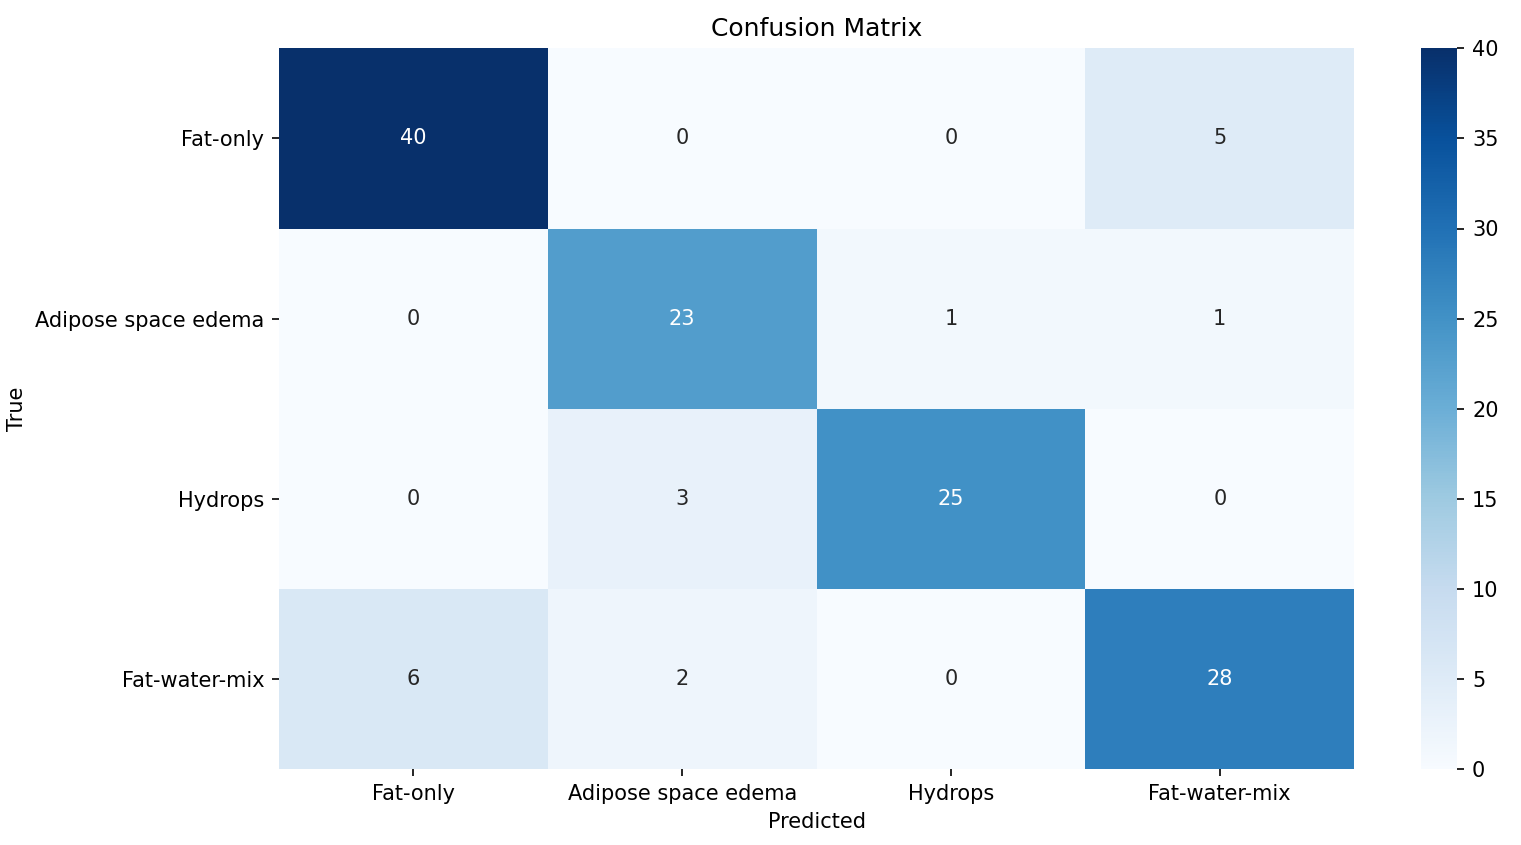
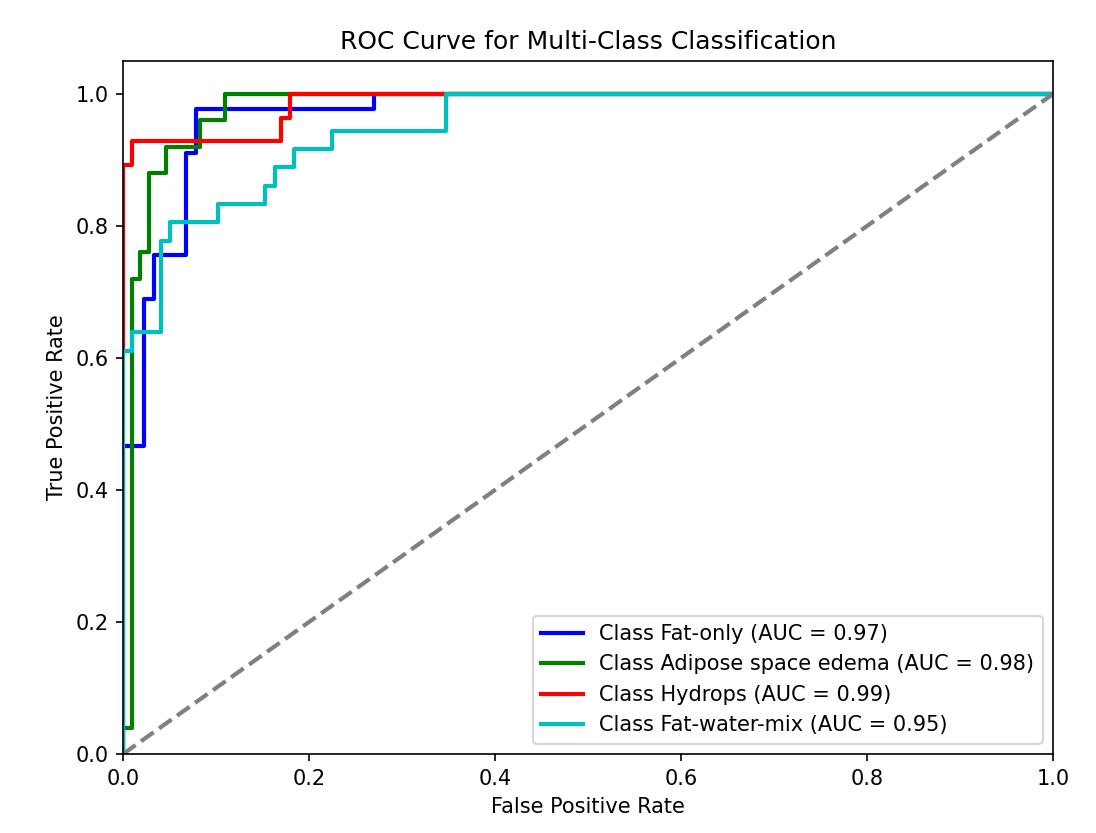
Results: he four-class model, using 15 selected radiomics features, shows outstanding performance with an overall accuracy of 0.866.
Impact: The different components of subcutaneous soft tissues of PLEL patients, such as simple fat, mixed fat and water, adipose interstitial edema and effusion, have unique radiomic features.
Background or purpose:
Primary lymphedema lower extremity is a chronic progressive swelling of the limb due to interrupted or impaired lymphatic return, excessive accumulation of lymphatic fluid in the subcutaneous soft tissues of the limb, lipohypertrophy, and fibrous connective tissue hyperplasia 1,2. Understanding a patient's fat and fluid composition may help determine the clinical approach that is best suited for them. Limbs with advanced lipoatrophy may not respond well to conservative treatments such as Comprehensive Decongestive Therapy (CDT), and liposuction is beneficial in patients with predominantly lipoatrophy; conversely, limbs with predominantly fluid accumulation may respond better to CDT or lymphovascular-venous anastomosis 3. On the STIR-sequence image of MRI, lymphedema is mainly composed of high signal fluid and low signal fat. Although previous studies have evaluated the preferred site and distribution pattern of the hydro-lipid component in lymphedema 4, microscopic characterization of the hydro-lipid component has not been reported yet. In this study, we performed feature extraction and screening of the components of fluid and fat in PLEL based on MRI radiomic, and explored the clinical significance of the representative histologic features of each component.Materials and Methods:
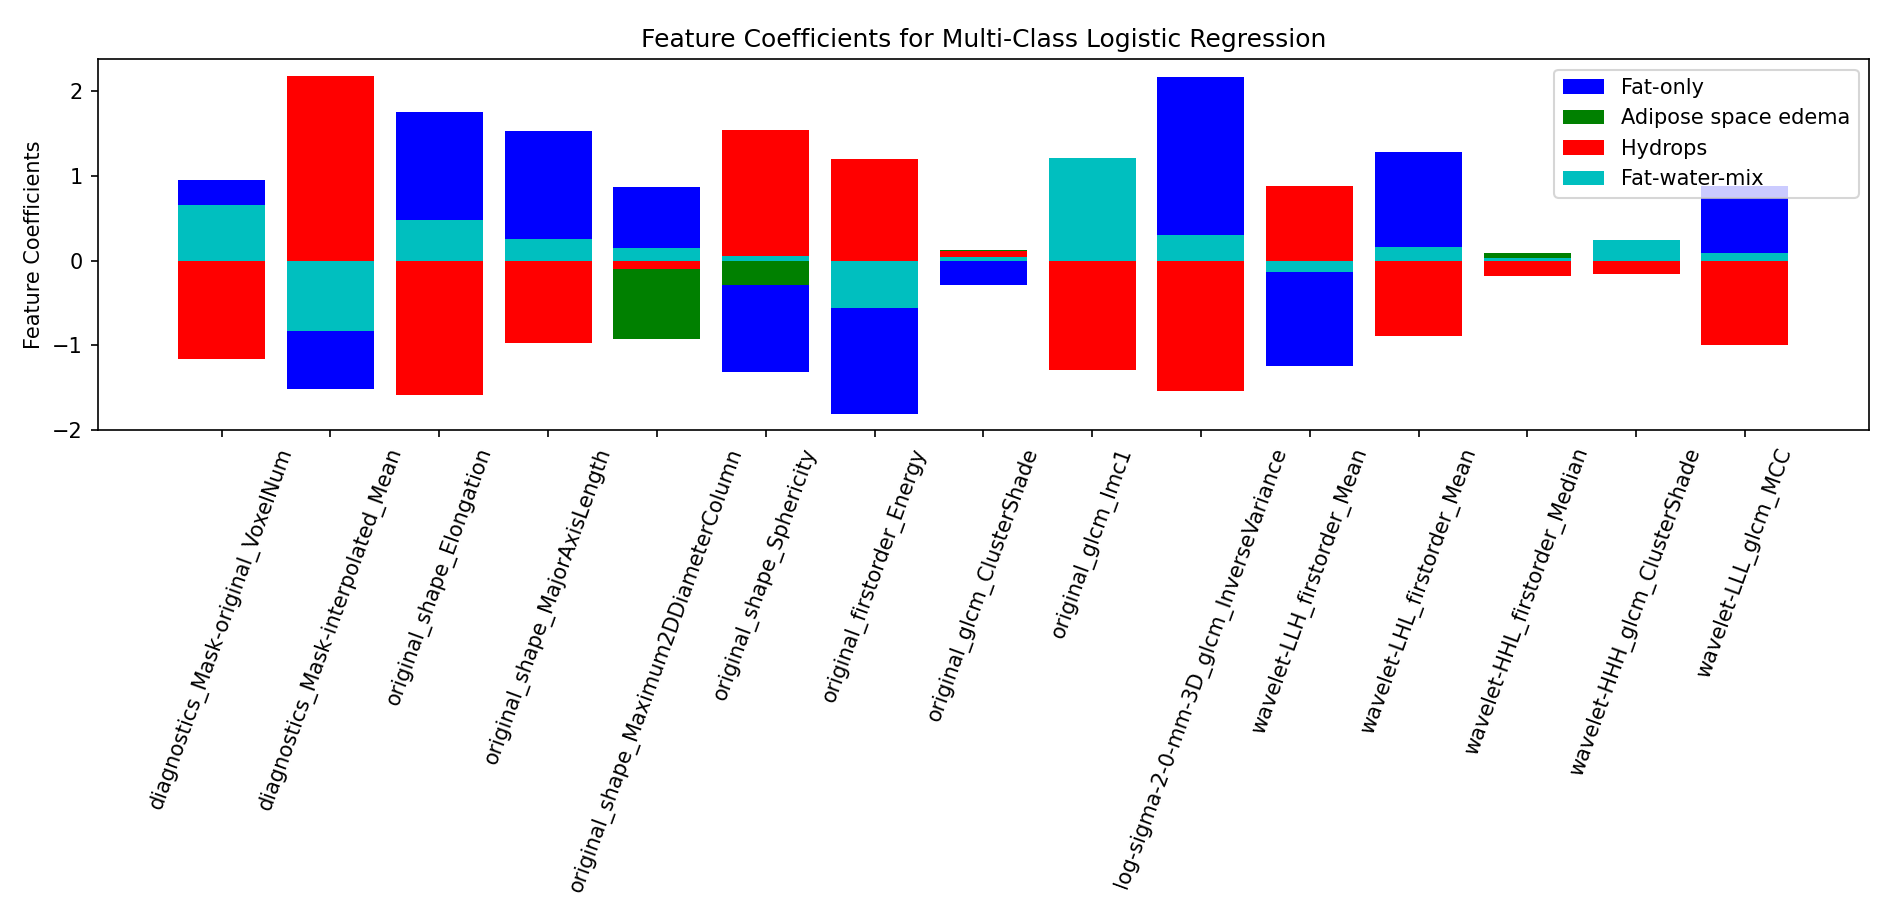
Subjects: Retrospective analysis of 112 patients diagnosed with unilateral primary lower limb lymphedema in the Department of Lymphatic Surgery at Beijing Shijitan Hospital between January 2018 and December 2021, with the diagnostic criteria of unilateral lower limb lymphatic vessels vaguely visualized or not visualized by nuclide lymphatic imaging or visualizers showing under the skin. Algorithm: Firstly, the subcutaneous tissue region was manually segmented to obtain the region of interest (ROI). Subsequently, a statistical analysis of pixel values corresponding to different components of lower limb tissue was conducted, and a thresholding method was employed to extract four ROI components, including fat, fat-water gap edema, edema, and fat-water mixture. After the extraction of each component, 1236 radiomics features were extracted using PyRadiomics. The samples were then categorized into four groups based on the four component types. Initially, low-variance features were eliminated to enhance data quality, followed by centralization and standardization of the feature matrix. Dimensionality reduction was performed through Spearman correlation coefficient analysis to eliminate features with correlations exceeding 0.8, thereby reducing redundant information, resulting in the selection of the top 20 highly correlated features. Additionally, Lasso regression, combined with 10-fold cross-validation, was used to determine the optimal alpha value, and 15 of the most influential features were selected for subsequent classification tasks. Subsequently, a logistic regression model was constructed and trained to ensure optimal performance and convergence. Statistical analysis: The classification performance assessment involved Receiver Operating Characteristic (ROC) analysis and confusion matrix analysis.Results:
The four-class model, using 15 selected radiomics features, shows outstanding performance with an overall accuracy of 0.866. Additionally, it achieves high AUC values of 0.97, 0.98, 0.99, and 0.95 for Fat-only, Adipose space edema, Hydrops, and Fat-water-mix, respectively (Figures 1-3).Discussion:
The PLEL component analysis based on the thresholding segmentation method can assist clinicians in evaluating the content of components such as water lipids in PLEL lesions, therefore providing a certain diagnostic basis for clinical decision-making. However, traditional MRI image analysis cannot extract the microscopic heterogeneity of the lesion area. Radiomics is a new method of medical image analysis in recent years 5. It can extract a large amount of information related to microenvironment from images with high throughput through advanced mathematical algorithms, such as heterogeneity, shape, texture, and density, etc., from images in a reproducible manner, followed by feature extraction and modeling 6. Furthermore, radiomics modeling requires a small number of sample cases, which saves a large amount of computational time; this, therefore, can be effectively applied to the diagnosis of some rare diseases diagnosis. In this study, we extracted and screened the radiomics features that can distinguish the different components of simple fat, mixed fat and water, fat interstitial edema and effusion, and the similarities and differences of these four components can be characterized from a microscopic point of view(see Figure 4). Importantly, the radiomic models constructed from each of the four components have demonstrated good discriminatory values. However, the limitations of this study are the small sample size and the lack of pathologic controls for the four components.Acknowledgements
Mengke Liu and Yuchi Tian contributed equally to this work.References
1. Sudduth CL, Greene AK. Primary Lymphedema: Update on Genetic Basis and Management[J]. Adv Wound Care (New Rochelle). 2022;11(7):374-381
2. Maclellan RA, Greene AK. Lymphedema[J]. Semin Pediatr Surg. 2014;23(4):191-197.
3. Brorson H Liposuction Normalizes Lymphedema Induced Adipose Tissue Hypertrophy in Elephantiasis of the Leg – A Prospective Study with a Ten-Y ear Follow-Up. Plast Reconstr Surg.2015;136:133–134.
4. Dayan JH, Wiser I, Verma R, et al. Regional Patterns of Fluid and Fat Accumulation in Patients with Lower Extremity Lymphedema Using Magnetic Resonance Angiography[J]. Plast Reconstr Surg. 2020;145(2):555-563
5. Mayerhoefer M E, Materka A, Langs G, et al. Introduction to radiomics[J]. Journal of Nuclear Medicine, 2020, 61(4): 488-495.
6. Son H, Lee S, Kim K, Koo KI, Hwang CH. Deep learning-based quantitative estimation of lymphedema-induced fibrosis using three-dimensional computed tomography images[J]. Sci Rep. 2022;12(1):15371. Published 2022 Sep 13
Figures