3615
Intratumoral Habitat and Peritumor Radiomics for Progression Risk Stratification of Patients with Soft Tissue Sarcoma: A Multicenter Study1Department of Radiology and Institute of Medical Functional and Molecular Imaging, Huashan Hospital, Fudan University, Shanghai, China, 2Department of Radiology, The Affiliated Hospital of Qingdao University, Qingdao, China, 3MR Collaboration Team, Siemens Healthineers, Shanghai, China, 4Department of Radiology, Shandong Provincial Hospital Affiliated to Shandong First Medical University, Jinan, China, 5Department of Pathology, The Affiliated Hospital of Qingdao University, Qingdao, China, 6Department of Radiology, The Third Hospital of Hebei Medical University, Shijiazhuang, China
Synopsis
Keywords: Diagnosis/Prediction, Skeletal
Motivation: Increasing the identification accuracy of patients with high risk of progression could help guide treatment decision in soft tissue sarcoma (STS).
Goal(s): To establish a radiomics nomogram that incorporated tumor habitat and peritumor features and validate its performance to predict tumor progression in patients with STS.
Approach: A nomogram combining radiomics based on intratumoral habitat and peritumorwith clinical information was established.
Results: This nomogram predicts tumor progression in STS patients and stratifies them according to the risk of progression.
Impact: Combining radiomics features derived from the intratumoral habitat and peritumoral region resulted in superior performance for predicting progression-free-survival in patients with STS, which is helpful for clinical decision making.
Introduction
Soft tissue sarcomas (STSs) are histologically heterogeneous and account for less than 1% of all malignant tumors (1). After resection, the standard treatment for STS, the prognosis of patients is poor as reported rates of recurrence or distant metastasis range from 33% to 50%(2-4). Preoperative identification of patients with a high risk of postoperative prognosis allows for optimizing neoadjuvant chemoradiotherapy, and improving outcomes. Previous studies reported that tumor lesion radiomics-based models have the potential to predict STS outcomes (5-9). However, subtle changes at intratumoral subregions (known as tumor habitats) and peritumoral microenvironment (region at a radial distance of 10-20 mm outside the lesions) were neglected (10-12). Aggressive habitats might be crucial for determining the tumor prognosis(10, 13), which may be explained by the aggressive biological behavior at the peritumoral microenvironment(14). Therefore, evaluating tumor habitat and peritumoral environment simultaneously helps depict a tumor’s behavior and potential for invasion(10, 15). This study aimed to establish a radiomics nomogram that combines the tumor habitat and peritumor features to predict progression-free-survival (PFS) in STS patients.Methods
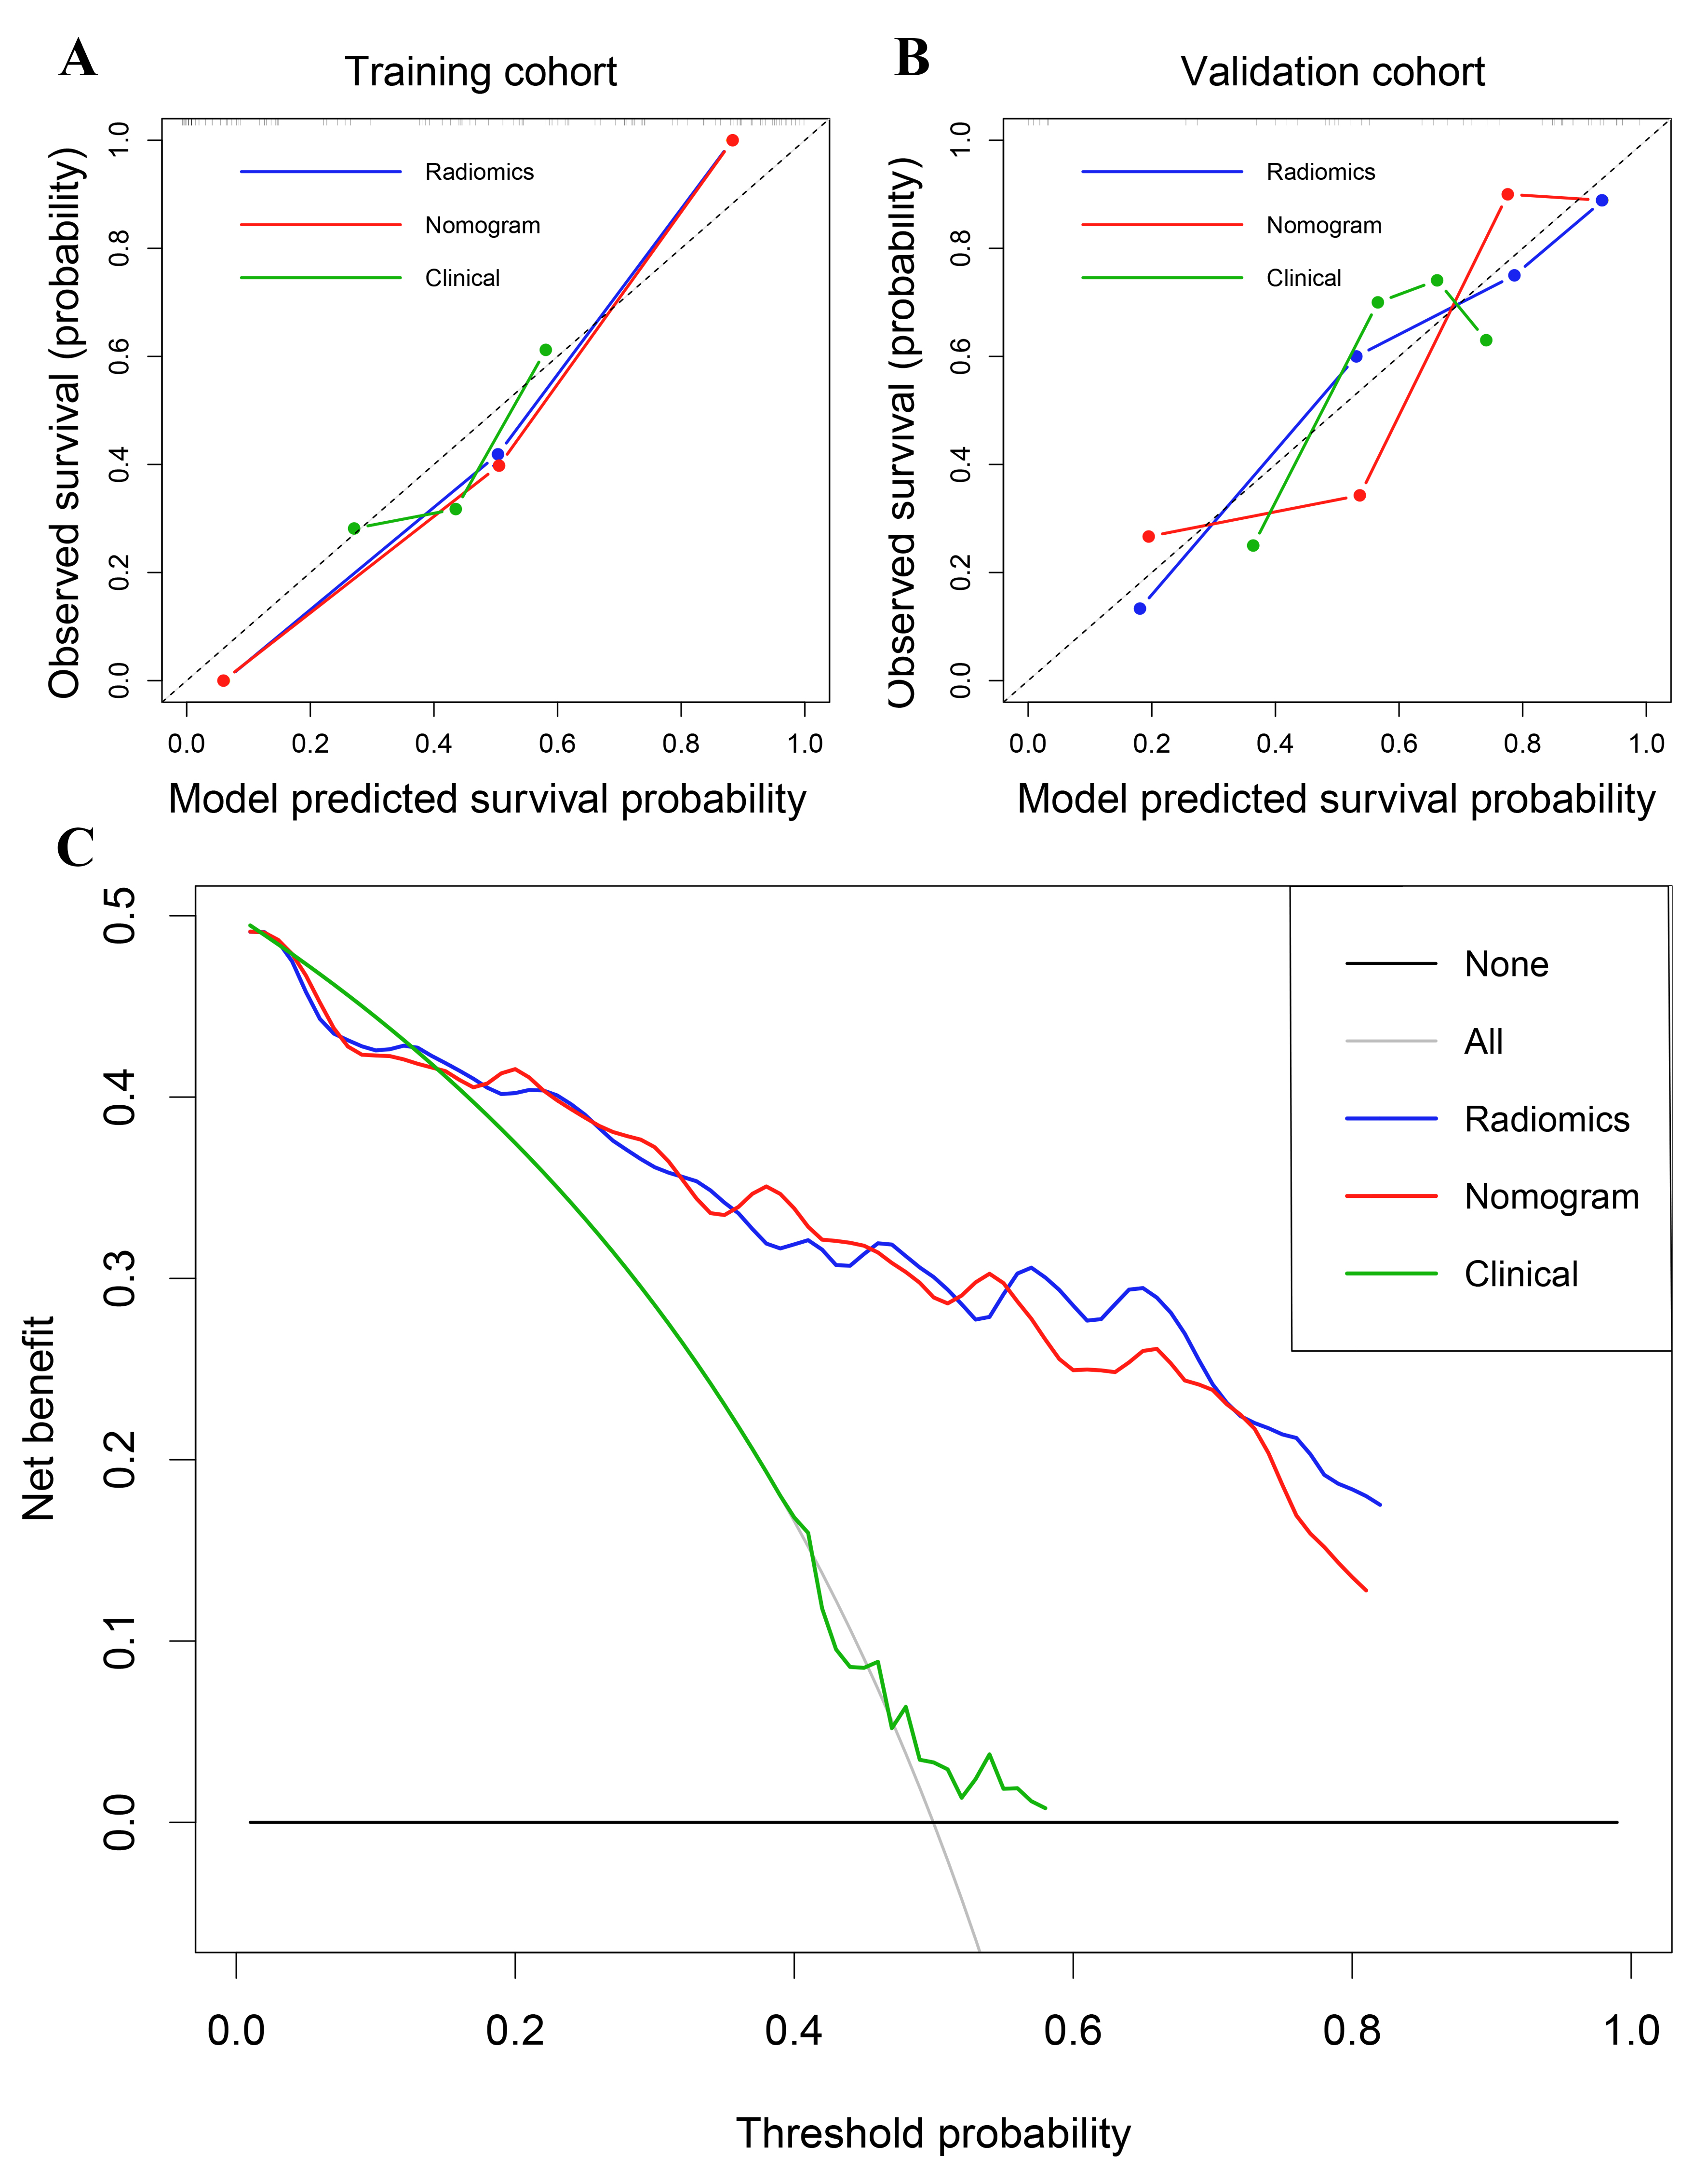
Preoperative MRI data, including axial fat-suppressed T2-weighted imaging (FS-T2WI) and axial contrast-enhanced fat-suppressed T1-weighted imaging (CE-T1WI), from 148 STS patients treated in four institutions were retrospectively enrolled. Scans were performed using two 3T scanners (MAGNETOM Skyra and Prisma, Siemens Healthcare, Erlangen, Germany). Imaging parameters were: FS-T2WI (TR 2400–4500 ms, TE 70–120ms), and Gd-T1WI (TR 500–600 ms, TE 10–15 ms). The both weightings had similar slice thickness (3–5 mm), slice spacing (1 mm), matrix (320 × 320), and field of view (200-400 mm). Patients were divided into a training cohort (n = 108, from two institutions) and validation cohort (n = 40, from the other two institutions). PFS was defined as the time from surgery to local recurrence, detection of new distant metastases on imaging, death, or last follow-up. Image preprocessing and segmentation of tumor-associated regions were performed including image registration, N4-bias-field-correction, tumor-associated region segmentation, and spatial resampling (into voxel size of 1×1×1 mm3). To form the tumor lesion mask, 3D tumoral regions were manually delineated. The peritumoral and tumoral expansion masks of each lesion was generated using morphologic dilation at 10 mm outside the tumor lesion mask. K-means clustering was applied to split intratumoral voxels into three habitats according to signal intensity values. Radiomics features were extracted from four tumor-associated regions (tumor lesion, peritumor, tumor expansion, and intratumoral habitats) to construct a series of radiomics signatures. Clinical predictors screened by uni- and multi-variate Cox regression were used to construct clinical model. A nomogram integrating clinical predictors and best performing radiomics signature was established. Predictive performance was evaluated using C-index, ROC analysis (16), and integrated Brier score (IBS) in the validation cohort. Calibration curves and decision curve analysis were used to assess model fitting and clinical reliability. PFS was estimated using the KM method and the log-rank test. P < 0.05 was considered significant.Results
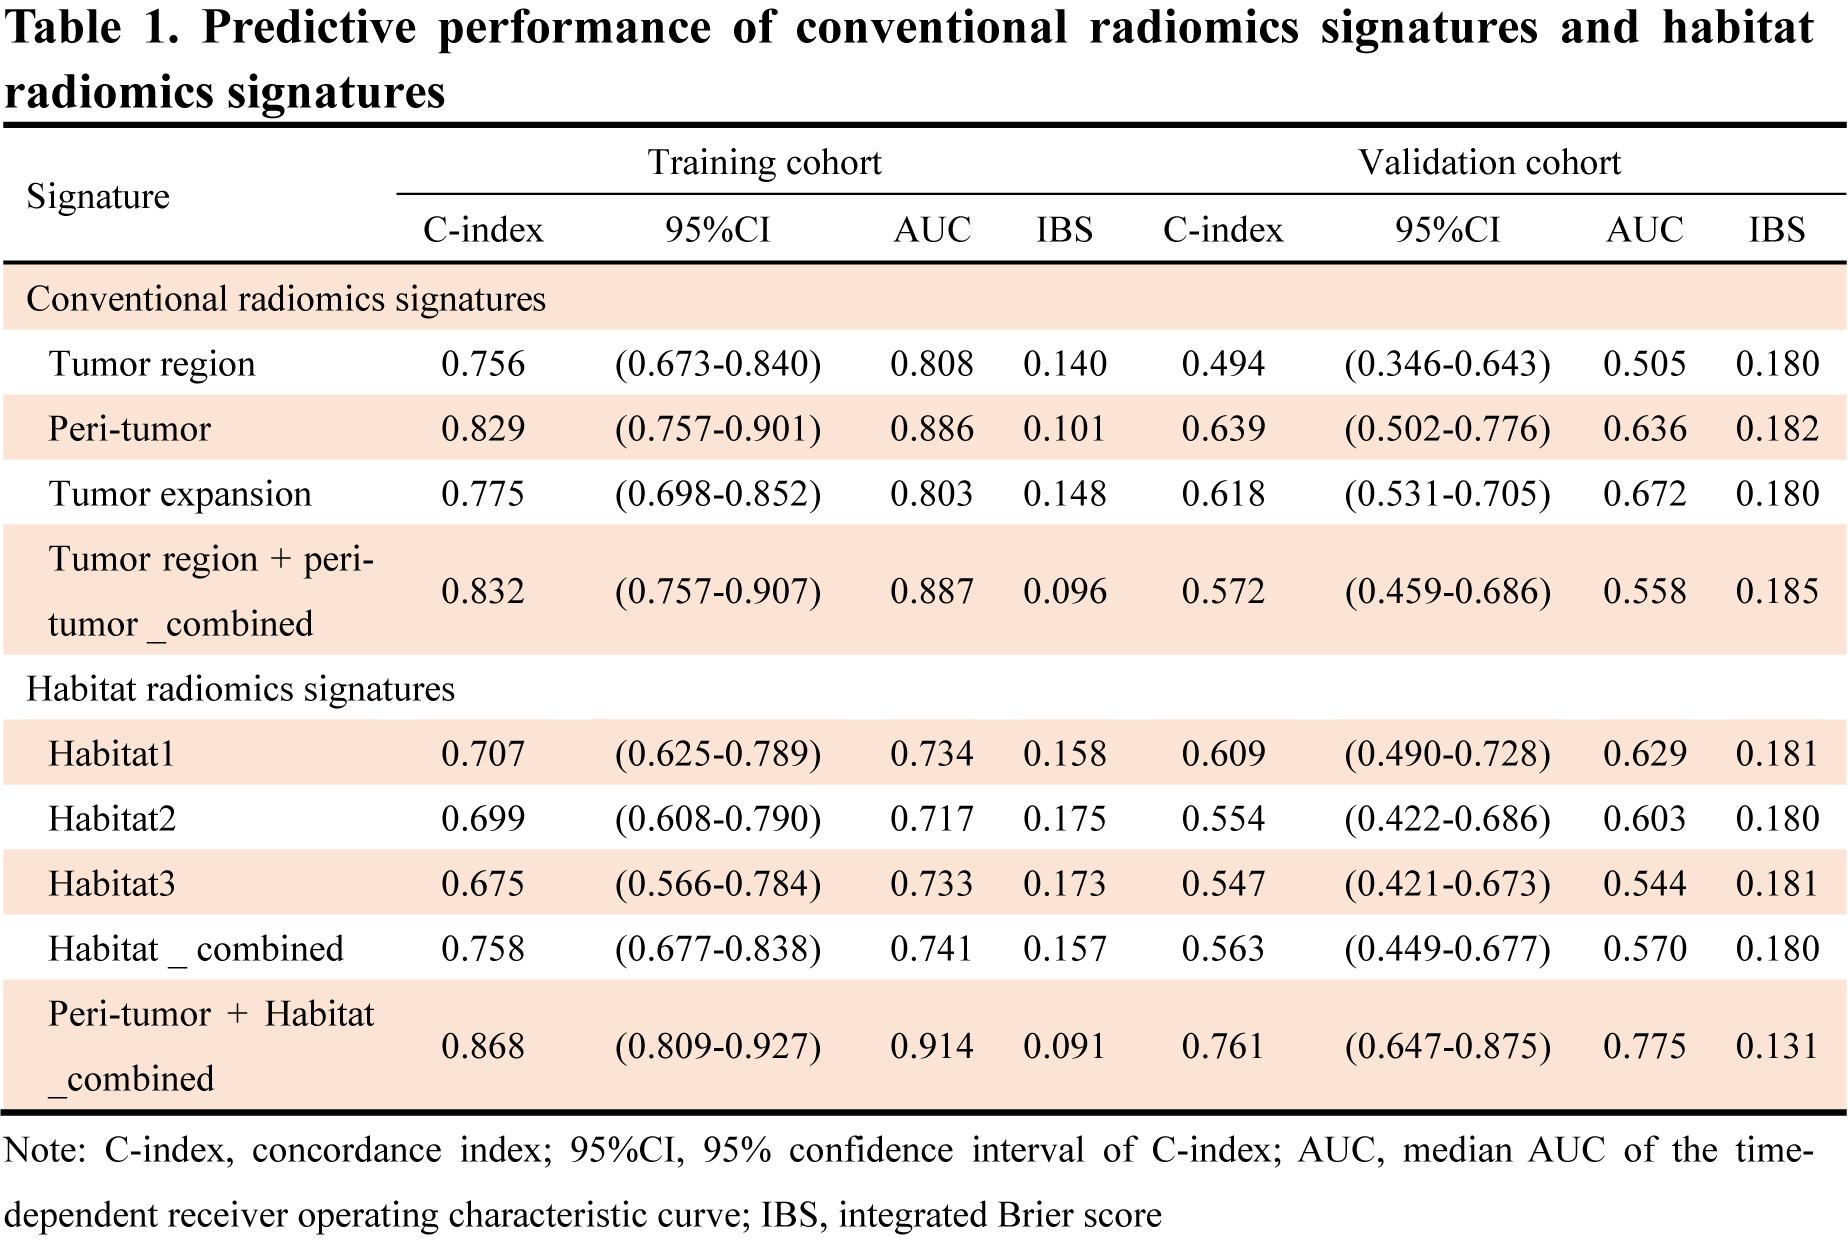
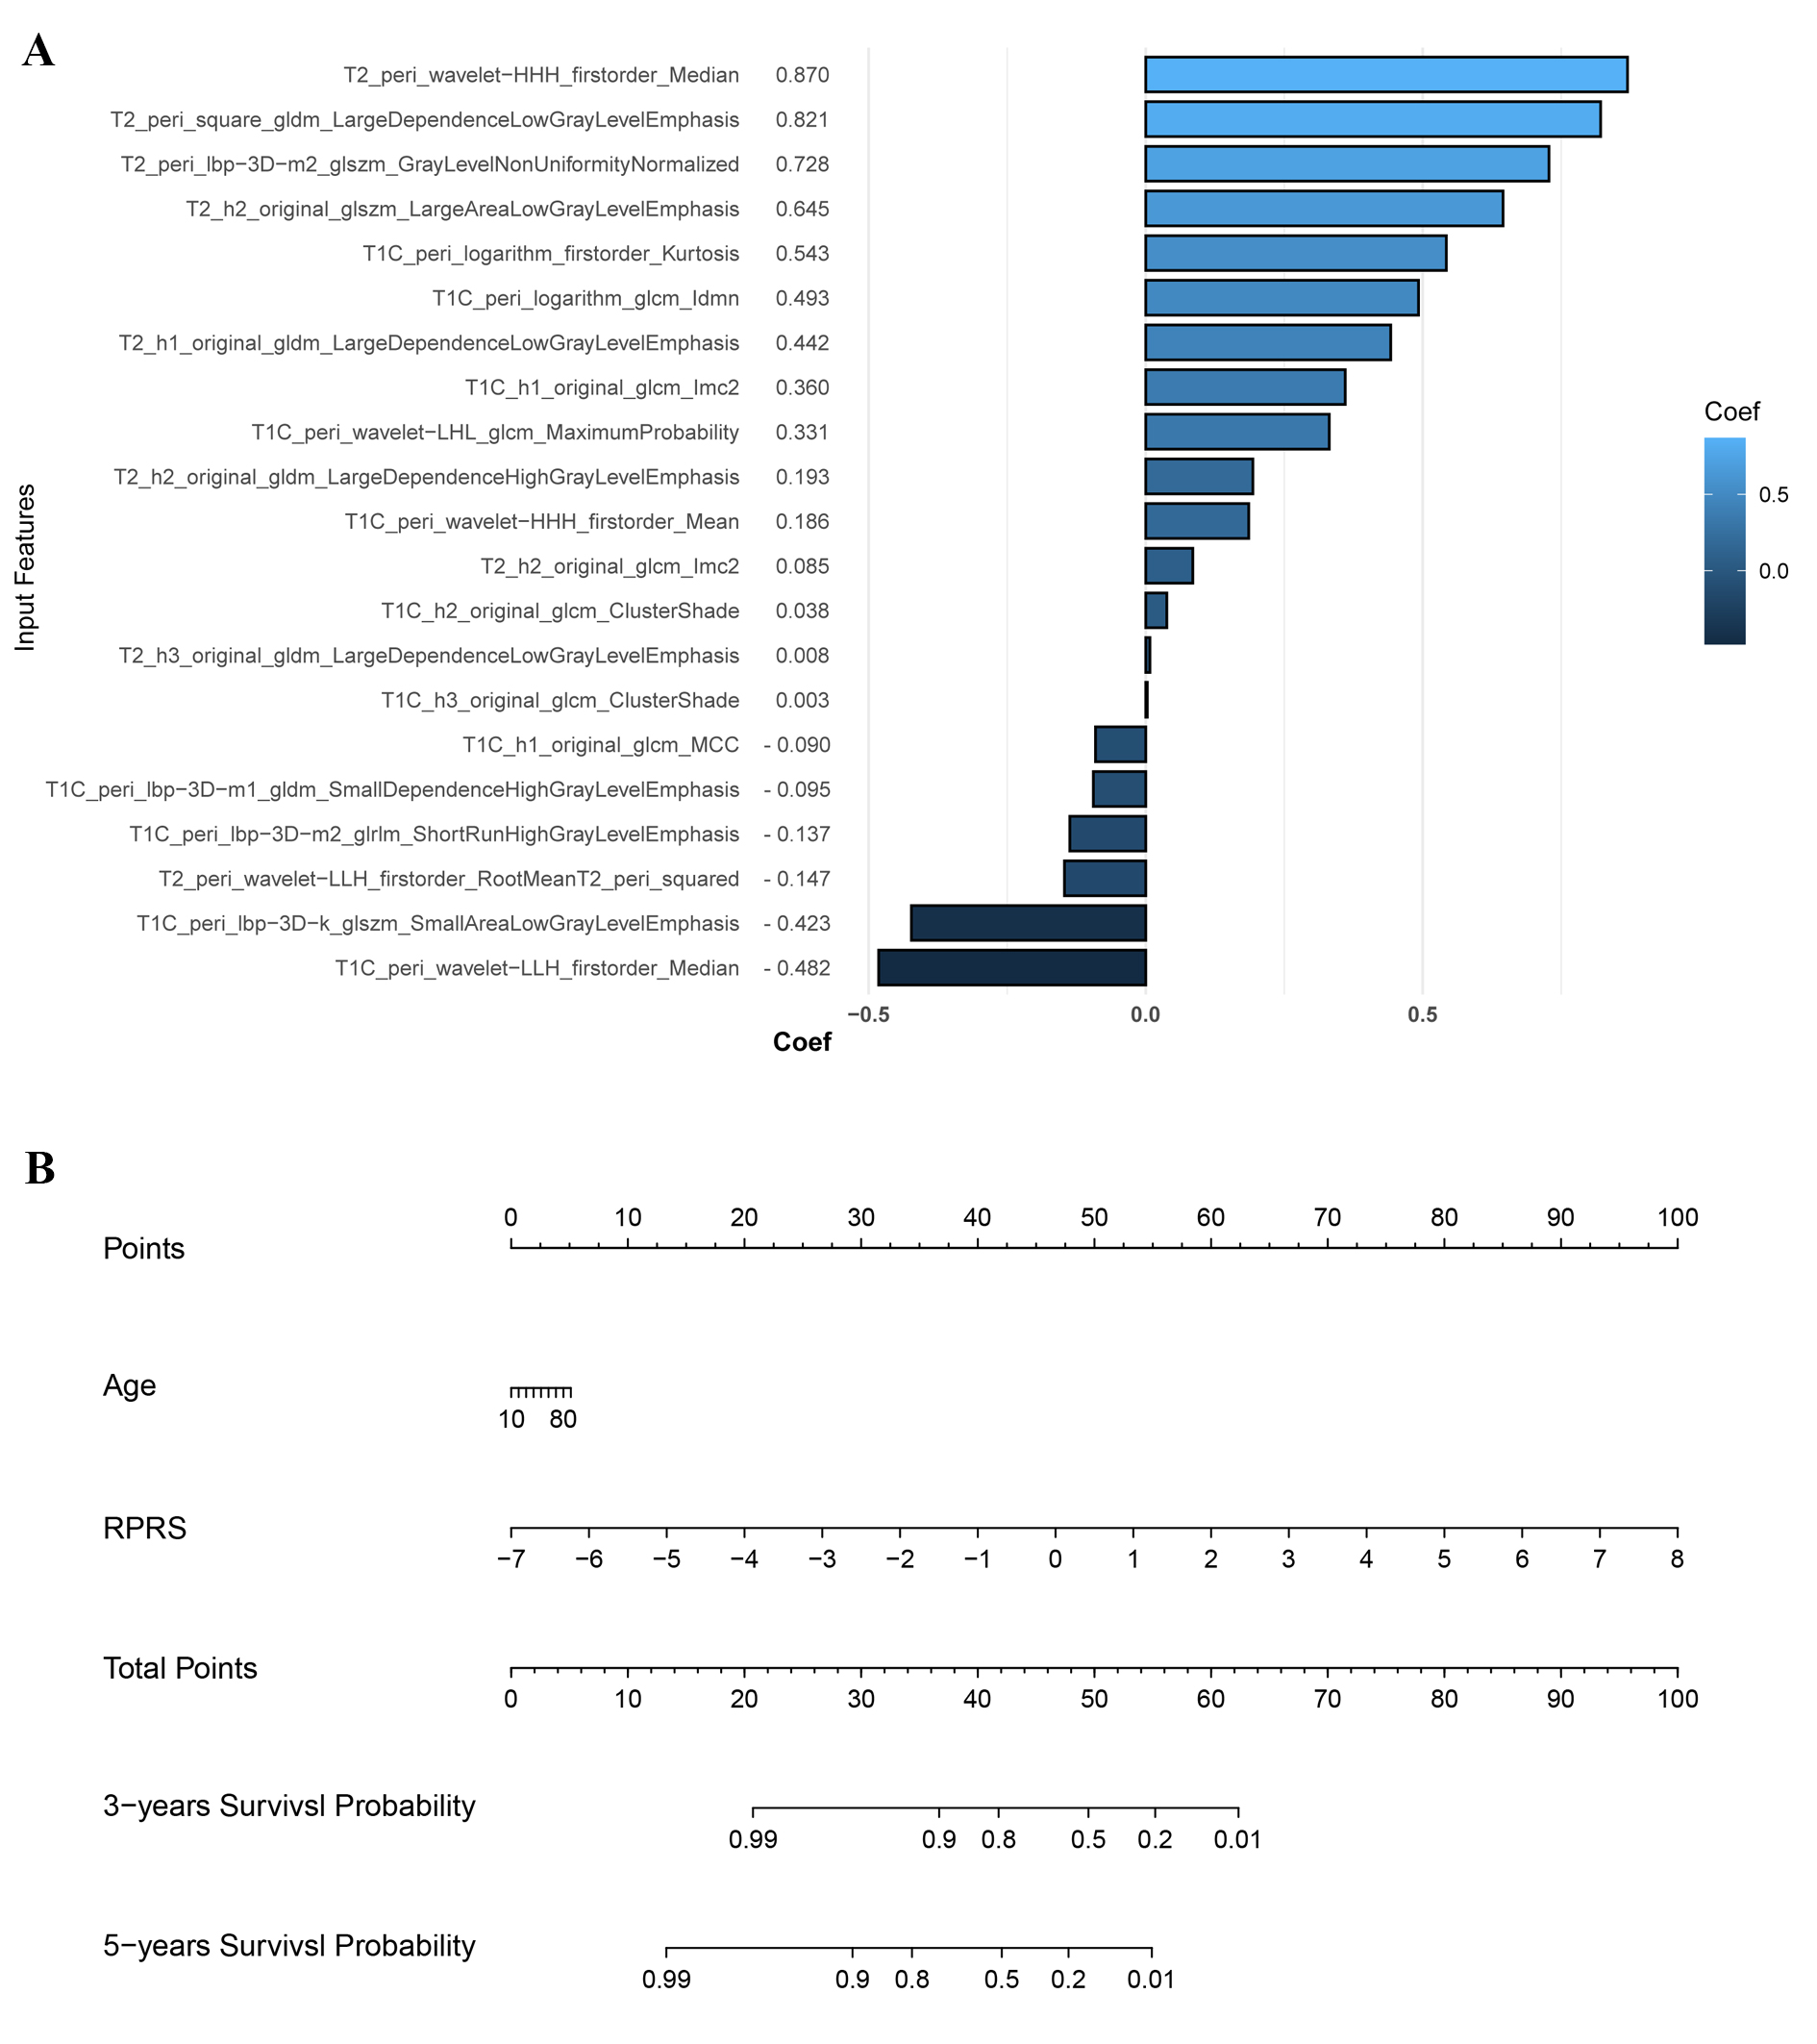
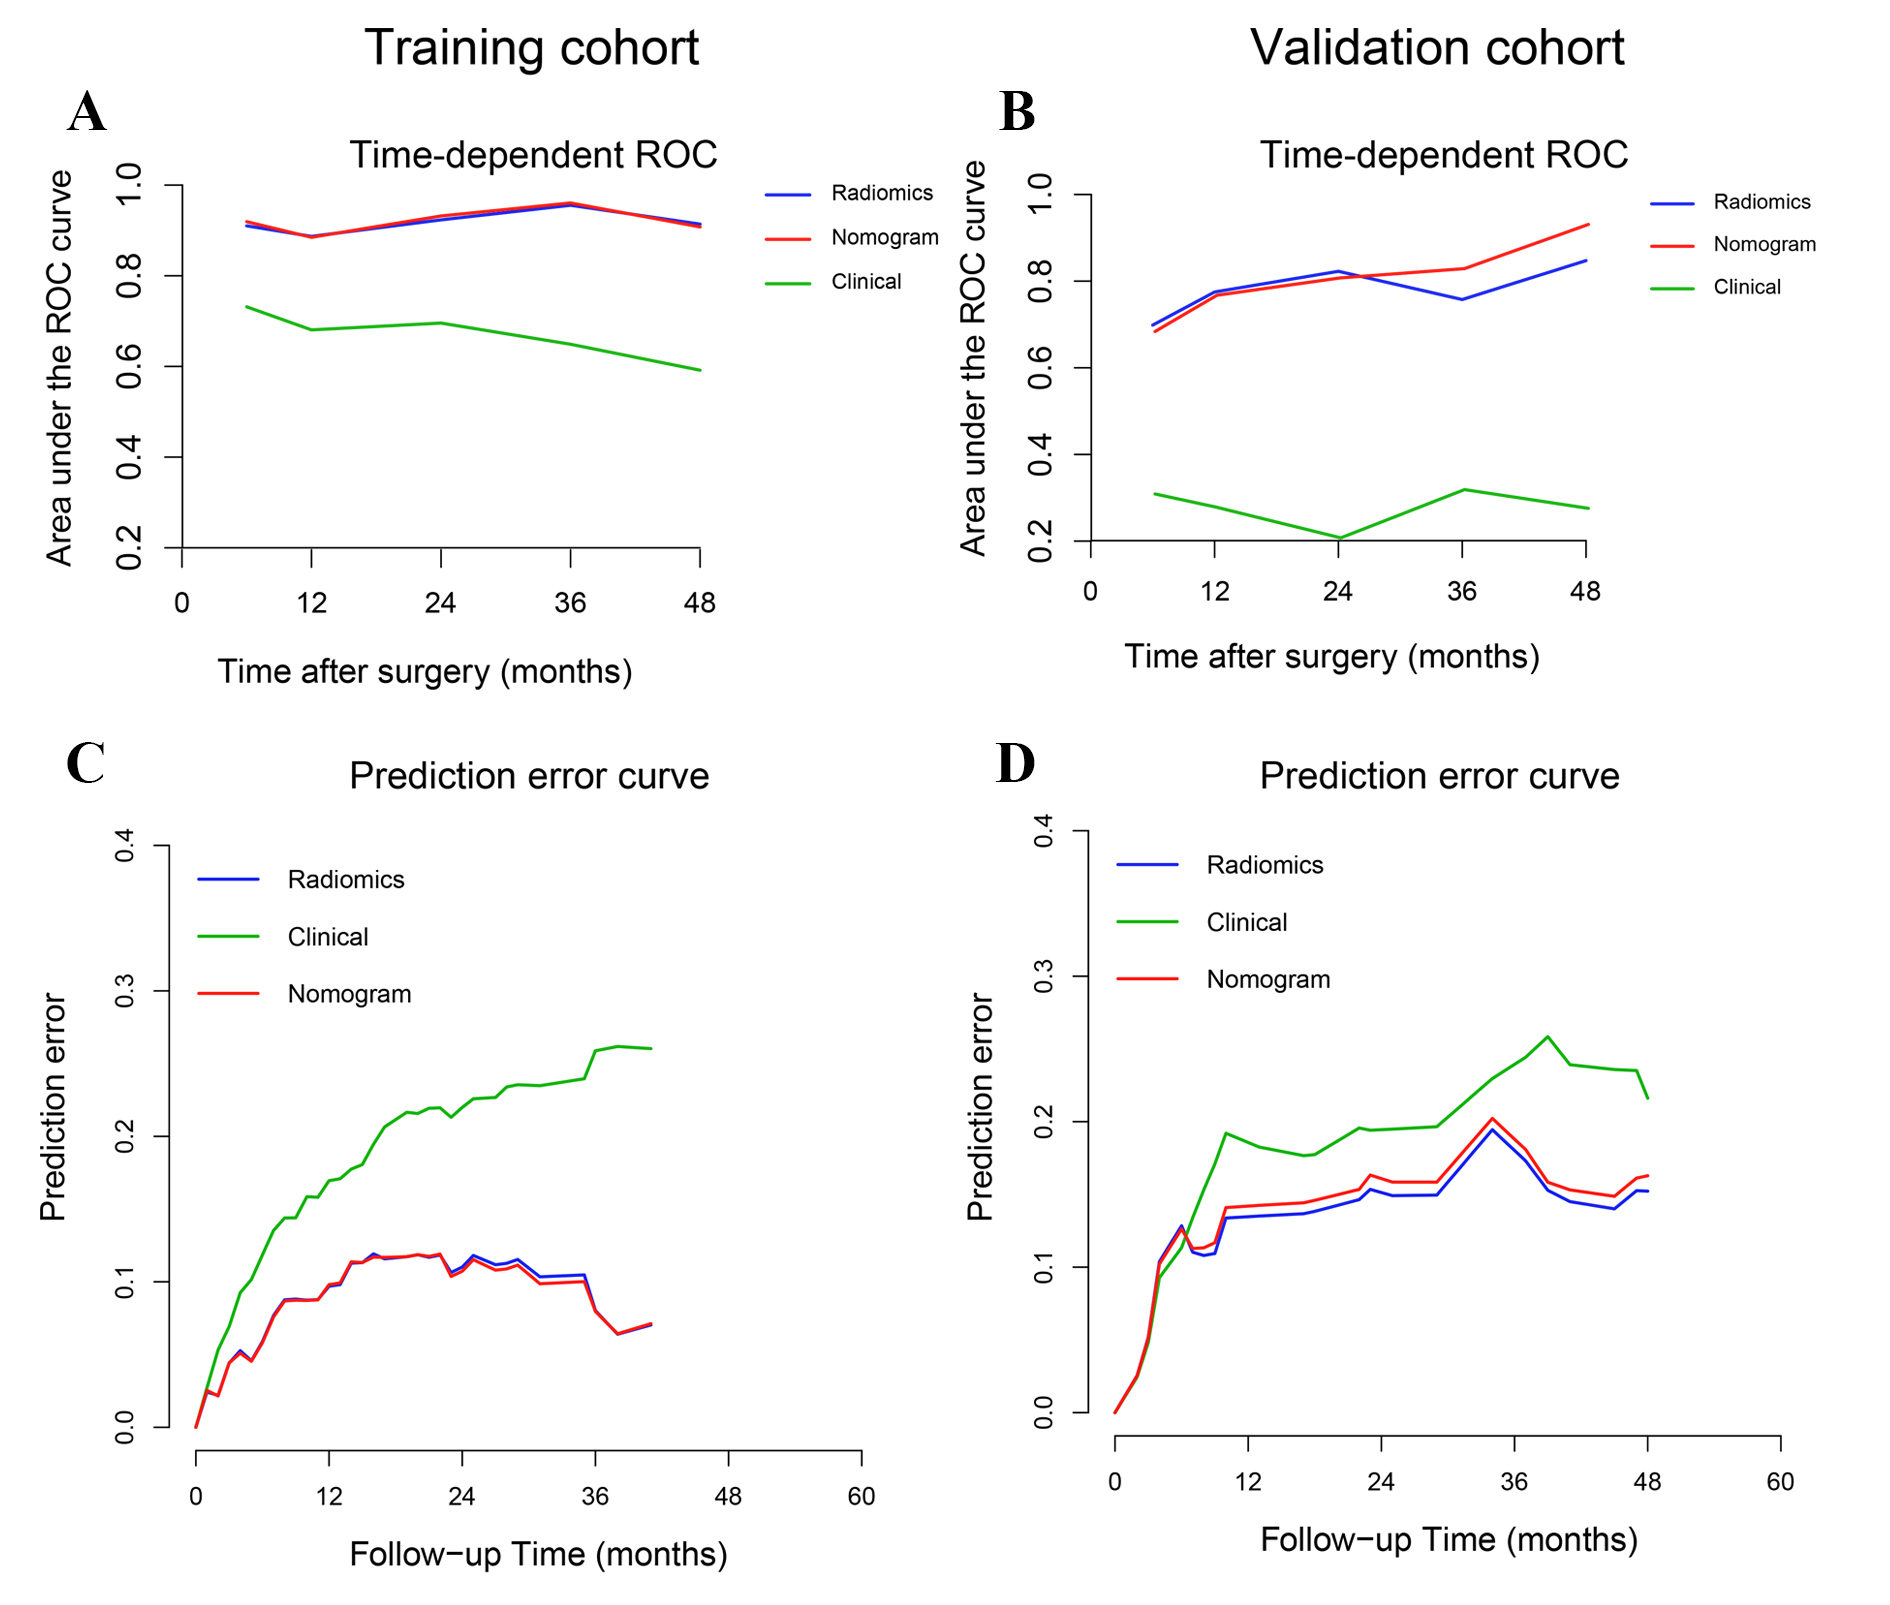
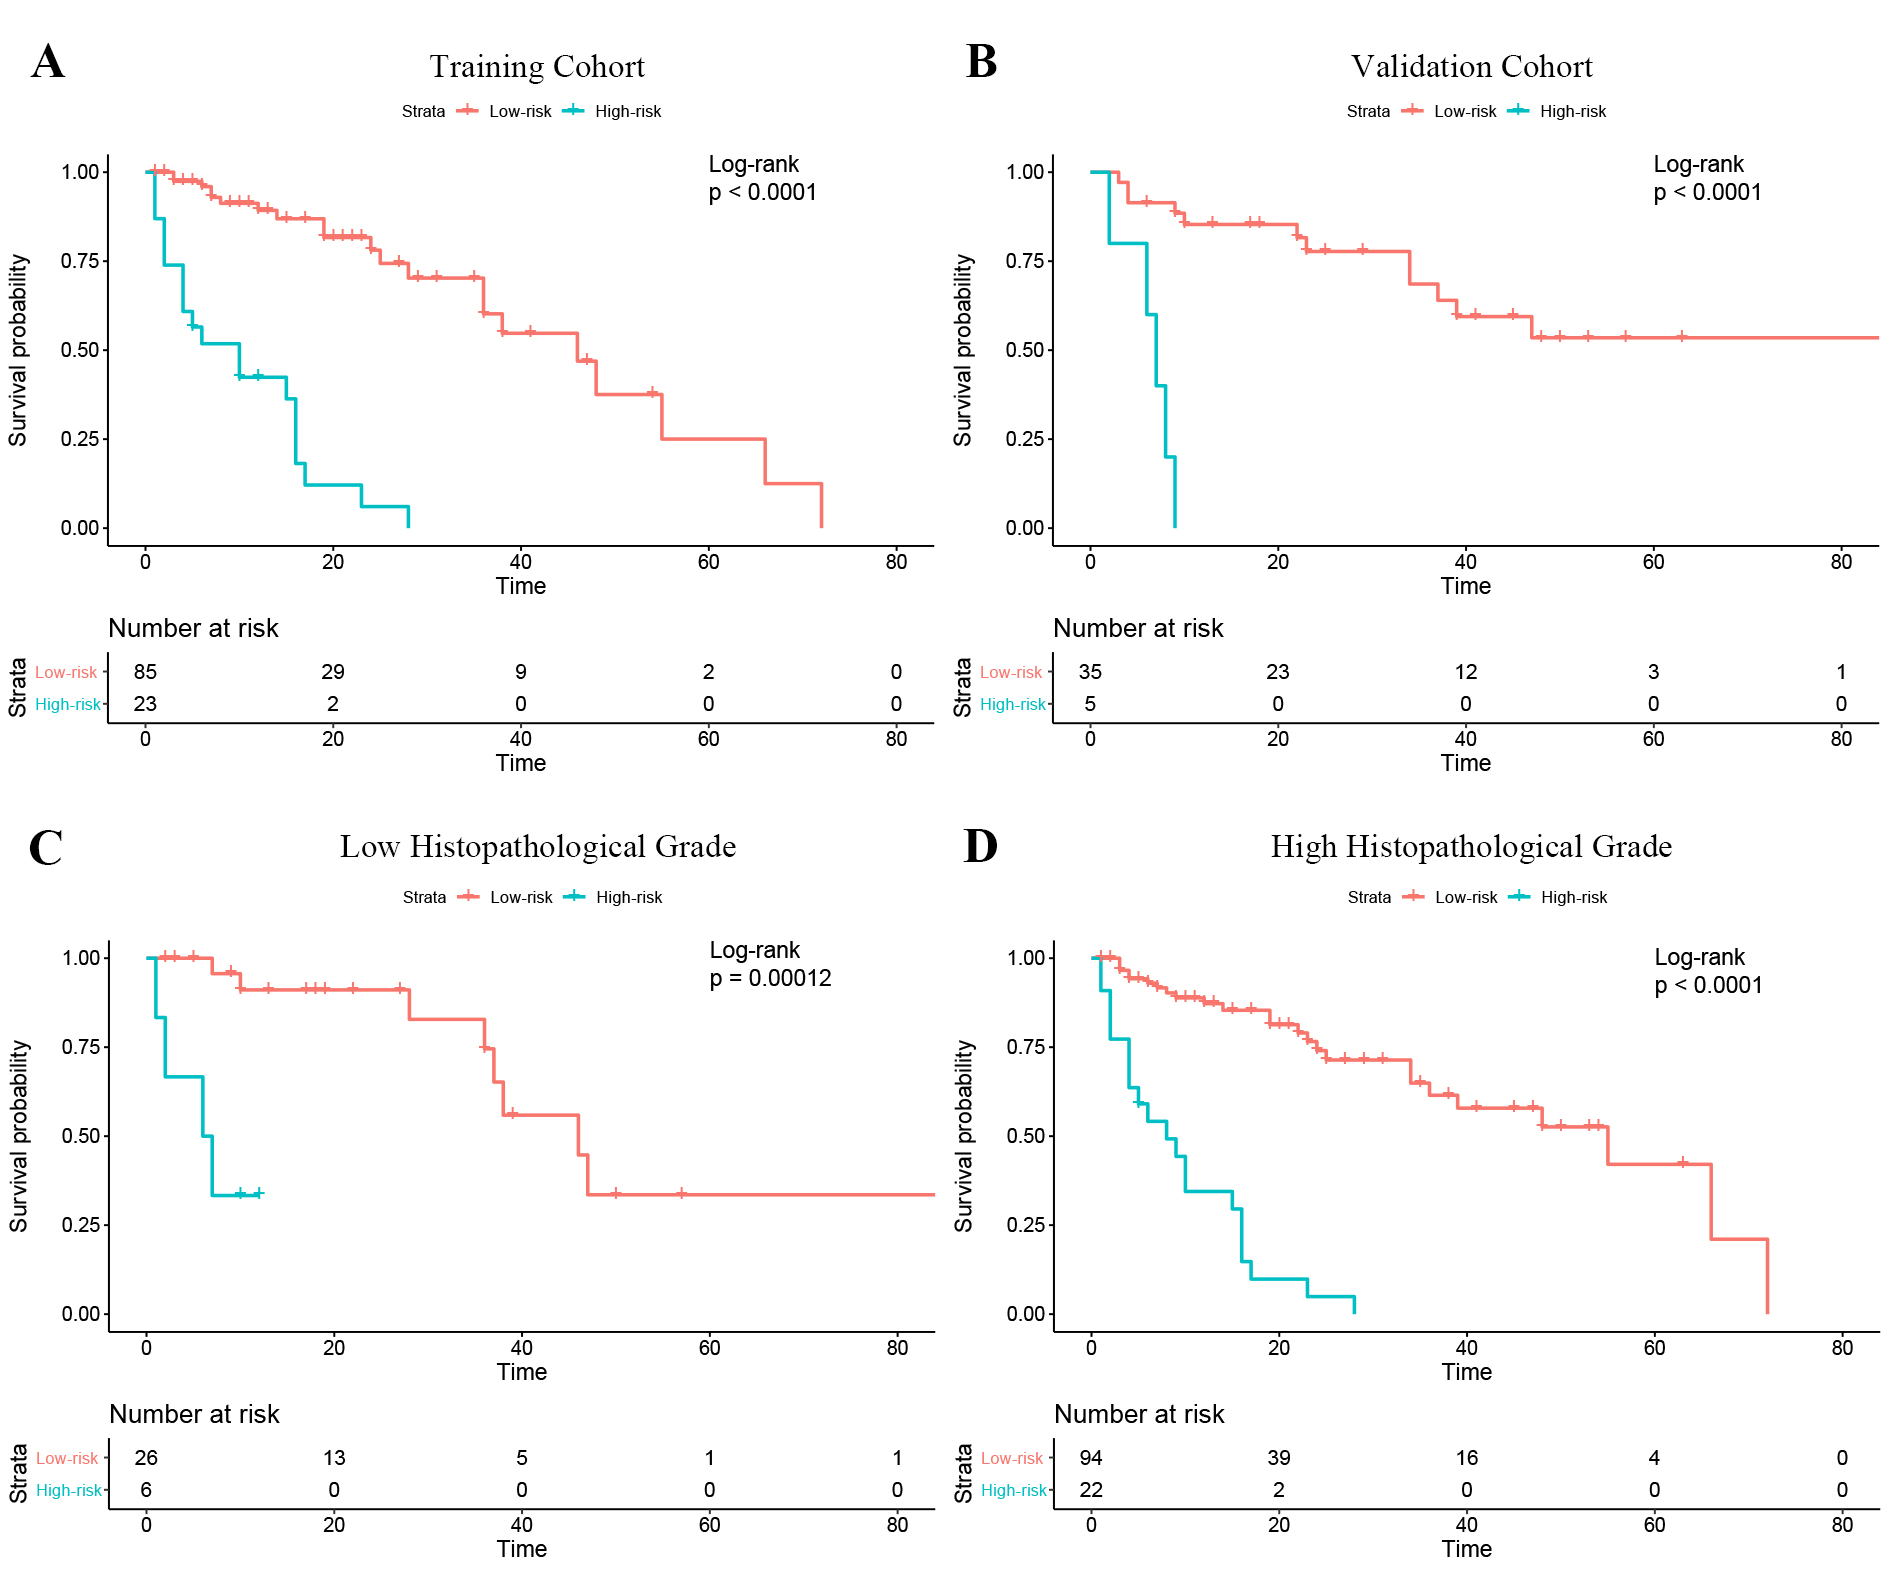
Among all the radiomics signatures, the Peri-tumor + Habitat _combined signature (enrolling the intratumoral habitats and peritumor radiomics features) yielded relatively stable performance for progression prediction: the C-index was 0.761 (95% CI, 0.647–0.875), median AUC was 0.775, and IBS was 0.131 (Table 1). The nomogram (Figure 1) yielded superior prediction performance and less predictive error (C-index, 0.777; median AUC, 0.808; IBS, 0.135) (Figure 2, 3). When patients were stratified according to risk of progression (low and high) based on the nomogram, KM survival analysis demonstrated significant differences in PFS between the groups (Figure 4A and B). In addition, it could attach incremental value to histopathological grade system in progression risk evaluation (Figure 4C and D).Discussion
Our study demonstrated that a radiomics model combining intratumoral habitat and peritumor features can predict tumor progression in STS patients. Compared with analyzing radiomics features derived from intratumoral habitats or regions, the peritumor region, or tumoral expansion, the combined radiomics features signature yielded better predictive performance. Moreover, the nomogram showed a convincing level of performance, good calibration, and convincing clinical usefulness. Conventionally, radiomics has focused on analyzing the primary tumor as a whole. However, subregions within the tumor and regions surrounding it could contain complementary useful information (17). In our study, intra- and peritumoral features were integrally analyzed to construct a survival prediction model, which achieved a convincing performance and revealed that comprehensive analysis of multi-regional and multi-scale radiomics information can quantify tumor heterogeneity.Conclusion
A nomogram based on intratumoral habitat and peritumor radiomics predicts tumor progression in STS patients and stratifies them according to the risk of progression.Acknowledgements
We thank Onekey AI platform (http://www.medai.icu/) and its developers for providing Python technical guidance.References
1. Siegel R, Naishadham D, Jemal A. Cancer statistics, 2012. CA Cancer J Clin 2012;62(1):10-29. doi: 10.3322/caac.20138
2. Hansen T, Katenkamp K, Brodhun M, Katenkamp D. Low-grade fibrosarcoma--report on 39 not otherwise specified cases and comparison with defined low-grade fibrosarcoma types. Histopathology 2006;49(2):152-160. doi: 10.1111/j.1365-2559.2006.02480.x
3. Tan MC, Brennan MF, Kuk D, Agaram NP, Antonescu CR, Qin LX, Moraco N, Crago AM, Singer S. Histology-based Classification Predicts Pattern of Recurrence and Improves Risk Stratification in Primary Retroperitoneal Sarcoma. Ann Surg 2016;263(3):593-600. doi: 10.1097/sla.0000000000001149
4. MacDermed DM, Miller LL, Peabody TD, Simon MA, Luu HH, Haydon RC, Montag AG, Undevia SD, Connell PP. Primary tumor necrosis predicts distant control in locally advanced soft-tissue sarcomas after preoperative concurrent chemoradiotherapy. Int J Radiat Oncol Biol Phys 2010;76(4):1147-1153. doi: 10.1016/j.ijrobp.2009.03.015
5. Liu S, Sun W, Yang S, Duan L, Huang C, Xu J, Hou F, Hao D, Yu T, Wang H. Deep learning radiomic nomogram to predict recurrence in soft tissue sarcoma: a multi-institutional study. Eur Radiol 2022;32(2):793-805. doi: 10.1007/s00330-021-08221-0
6. Tagliafico AS, Bignotti B, Rossi F, Valdora F, Martinoli C. Local recurrence of soft tissue sarcoma: a radiomic analysis. Radiol Oncol 2019;53(3):300-306. doi: 10.2478/raon-2019-0041
7. Vallières M, Freeman CR, Skamene SR, El Naqa I. A radiomics model from joint FDG-PET and MRI texture features for the prediction of lung metastases in soft-tissue sarcomas of the extremities. Phys Med Biol 2015;60(14):5471-5496. doi: 10.1088/0031-9155/60/14/5471
8. Spraker MB, Wootton LS, Hippe DS, Ball KC, Peeken JC, Macomber MW, Chapman TR, Hoff MN, Kim EY, Pollack SM, Combs SE, Nyflot MJ. MRI Radiomic Features Are Independently Associated With Overall Survival in Soft Tissue Sarcoma. Adv Radiat Oncol 2019;4(2):413-421. doi: 10.1016/j.adro.2019.02.003
9. Crombé A, Périer C, Kind M, De Senneville BD, Le Loarer F, Italiano A, Buy X, Saut O. T(2) -based MRI Delta-radiomics improve response prediction in soft-tissue sarcomas treated by neoadjuvant chemotherapy. J Magn Reson Imaging 2019;50(2):497-510. doi: 10.1002/jmri.26589
10. Gatenby RA, Grove O, Gillies RJ. Quantitative imaging in cancer evolution and ecology. Radiology 2013;269(1):8-15. doi: 10.1148/radiol.13122697
11. Gu Y, She Y, Xie D, Dai C, Ren Y, Fan Z, Zhu H, Sun X, Xie H, Jiang G, Chen C. A Texture Analysis-Based Prediction Model for Lymph Node Metastasis in Stage IA Lung Adenocarcinoma. Ann Thorac Surg 2018;106(1):214-220. doi: 10.1016/j.athoracsur.2018.02.026
12. Zhong Y, Yuan M, Zhang T, Zhang YD, Li H, Yu TF. Radiomics Approach to Prediction of Occult Mediastinal Lymph Node Metastasis of Lung Adenocarcinoma. AJR Am J Roentgenol 2018;211(1):109-113. doi: 10.2214/ajr.17.19074
13. Even AJG, Reymen B, La Fontaine MD, Das M, Mottaghy FM, Belderbos JSA, De Ruysscher D, Lambin P, van Elmpt W. Clustering of multi-parametric functional imaging to identify high-risk subvolumes in non-small cell lung cancer. Radiother Oncol 2017;125(3):379-384. doi: 10.1016/j.radonc.2017.09.041
14. Braman N, Prasanna P, Whitney J, Singh S, Beig N, Etesami M, Bates DDB, Gallagher K, Bloch BN, Vulchi M, Turk P, Bera K, Abraham J, Sikov WM, Somlo G, Harris LN, Gilmore H, Plecha D, Varadan V, Madabhushi A. Association of Peritumoral Radiomics With Tumor Biology and Pathologic Response to Preoperative Targeted Therapy for HER2 (ERBB2)-Positive Breast Cancer. JAMA Netw Open 2019;2(4):e192561. doi: 10.1001/jamanetworkopen.2019.2561
15. Wang T, She Y, Yang Y, Liu X, Chen S, Zhong Y, Deng J, Zhao M, Sun X, Xie D, Chen C. Radiomics for Survival Risk Stratification of Clinical and Pathologic Stage IA Pure-Solid Non-Small Cell Lung Cancer. Radiology 2022;302(2):425-434. doi: 10.1148/radiol.2021210109
16. Schröder MS, Culhane AC, Quackenbush J, Haibe-Kains B. survcomp: an R/Bioconductor package for performance assessment and comparison of survival models. Bioinformatics 2011;27(22):3206-3208. doi: 10.1093/bioinformatics/btr511
17. Hu Y, Xie C, Yang H, Ho JWK, Wen J, Han L, Chiu KWH, Fu J, Vardhanabhuti V. Assessment of Intratumoral and Peritumoral Computed Tomography Radiomics for Predicting Pathological Complete Response to Neoadjuvant Chemoradiation in Patients With Esophageal Squamous Cell Carcinoma. JAMA Netw Open 2020;3(9):e2015927. doi: 10.1001/jamanetworkopen.2020.15927
Figures