3613
Comparing a Fully Automated Hybrid Approach on MRI and FibroScan for Triaging Clinically Significant Liver Fibrosis:A Multi-center Cohort Study1Jiangsu Key Laboratory of Molecular and Functional Imaging, Department of Radiology, Zhongda Hospital, School of Medicine, Southeast University, Nanjing, China, Nanjing, China, 2MR Scientific Marketing, Siemens Healthineers Ltd., Shanghai, China, Shanghai, China
Synopsis
Keywords: Diagnosis/Prediction, Liver
Motivation: MRI-derived texture analysis could assess liver fibrosis effectively, yet lacking large-scale datasets for validation or comparisons with transient elastography-based liver stiffness measurement (TE-LSM).
Goal(s): develop and validate the combined radiomics-clinic model (CoRC) on MRI for triaging clinically significant liver fibrosis (≥ F2), comparing or combining with TE-LSM.
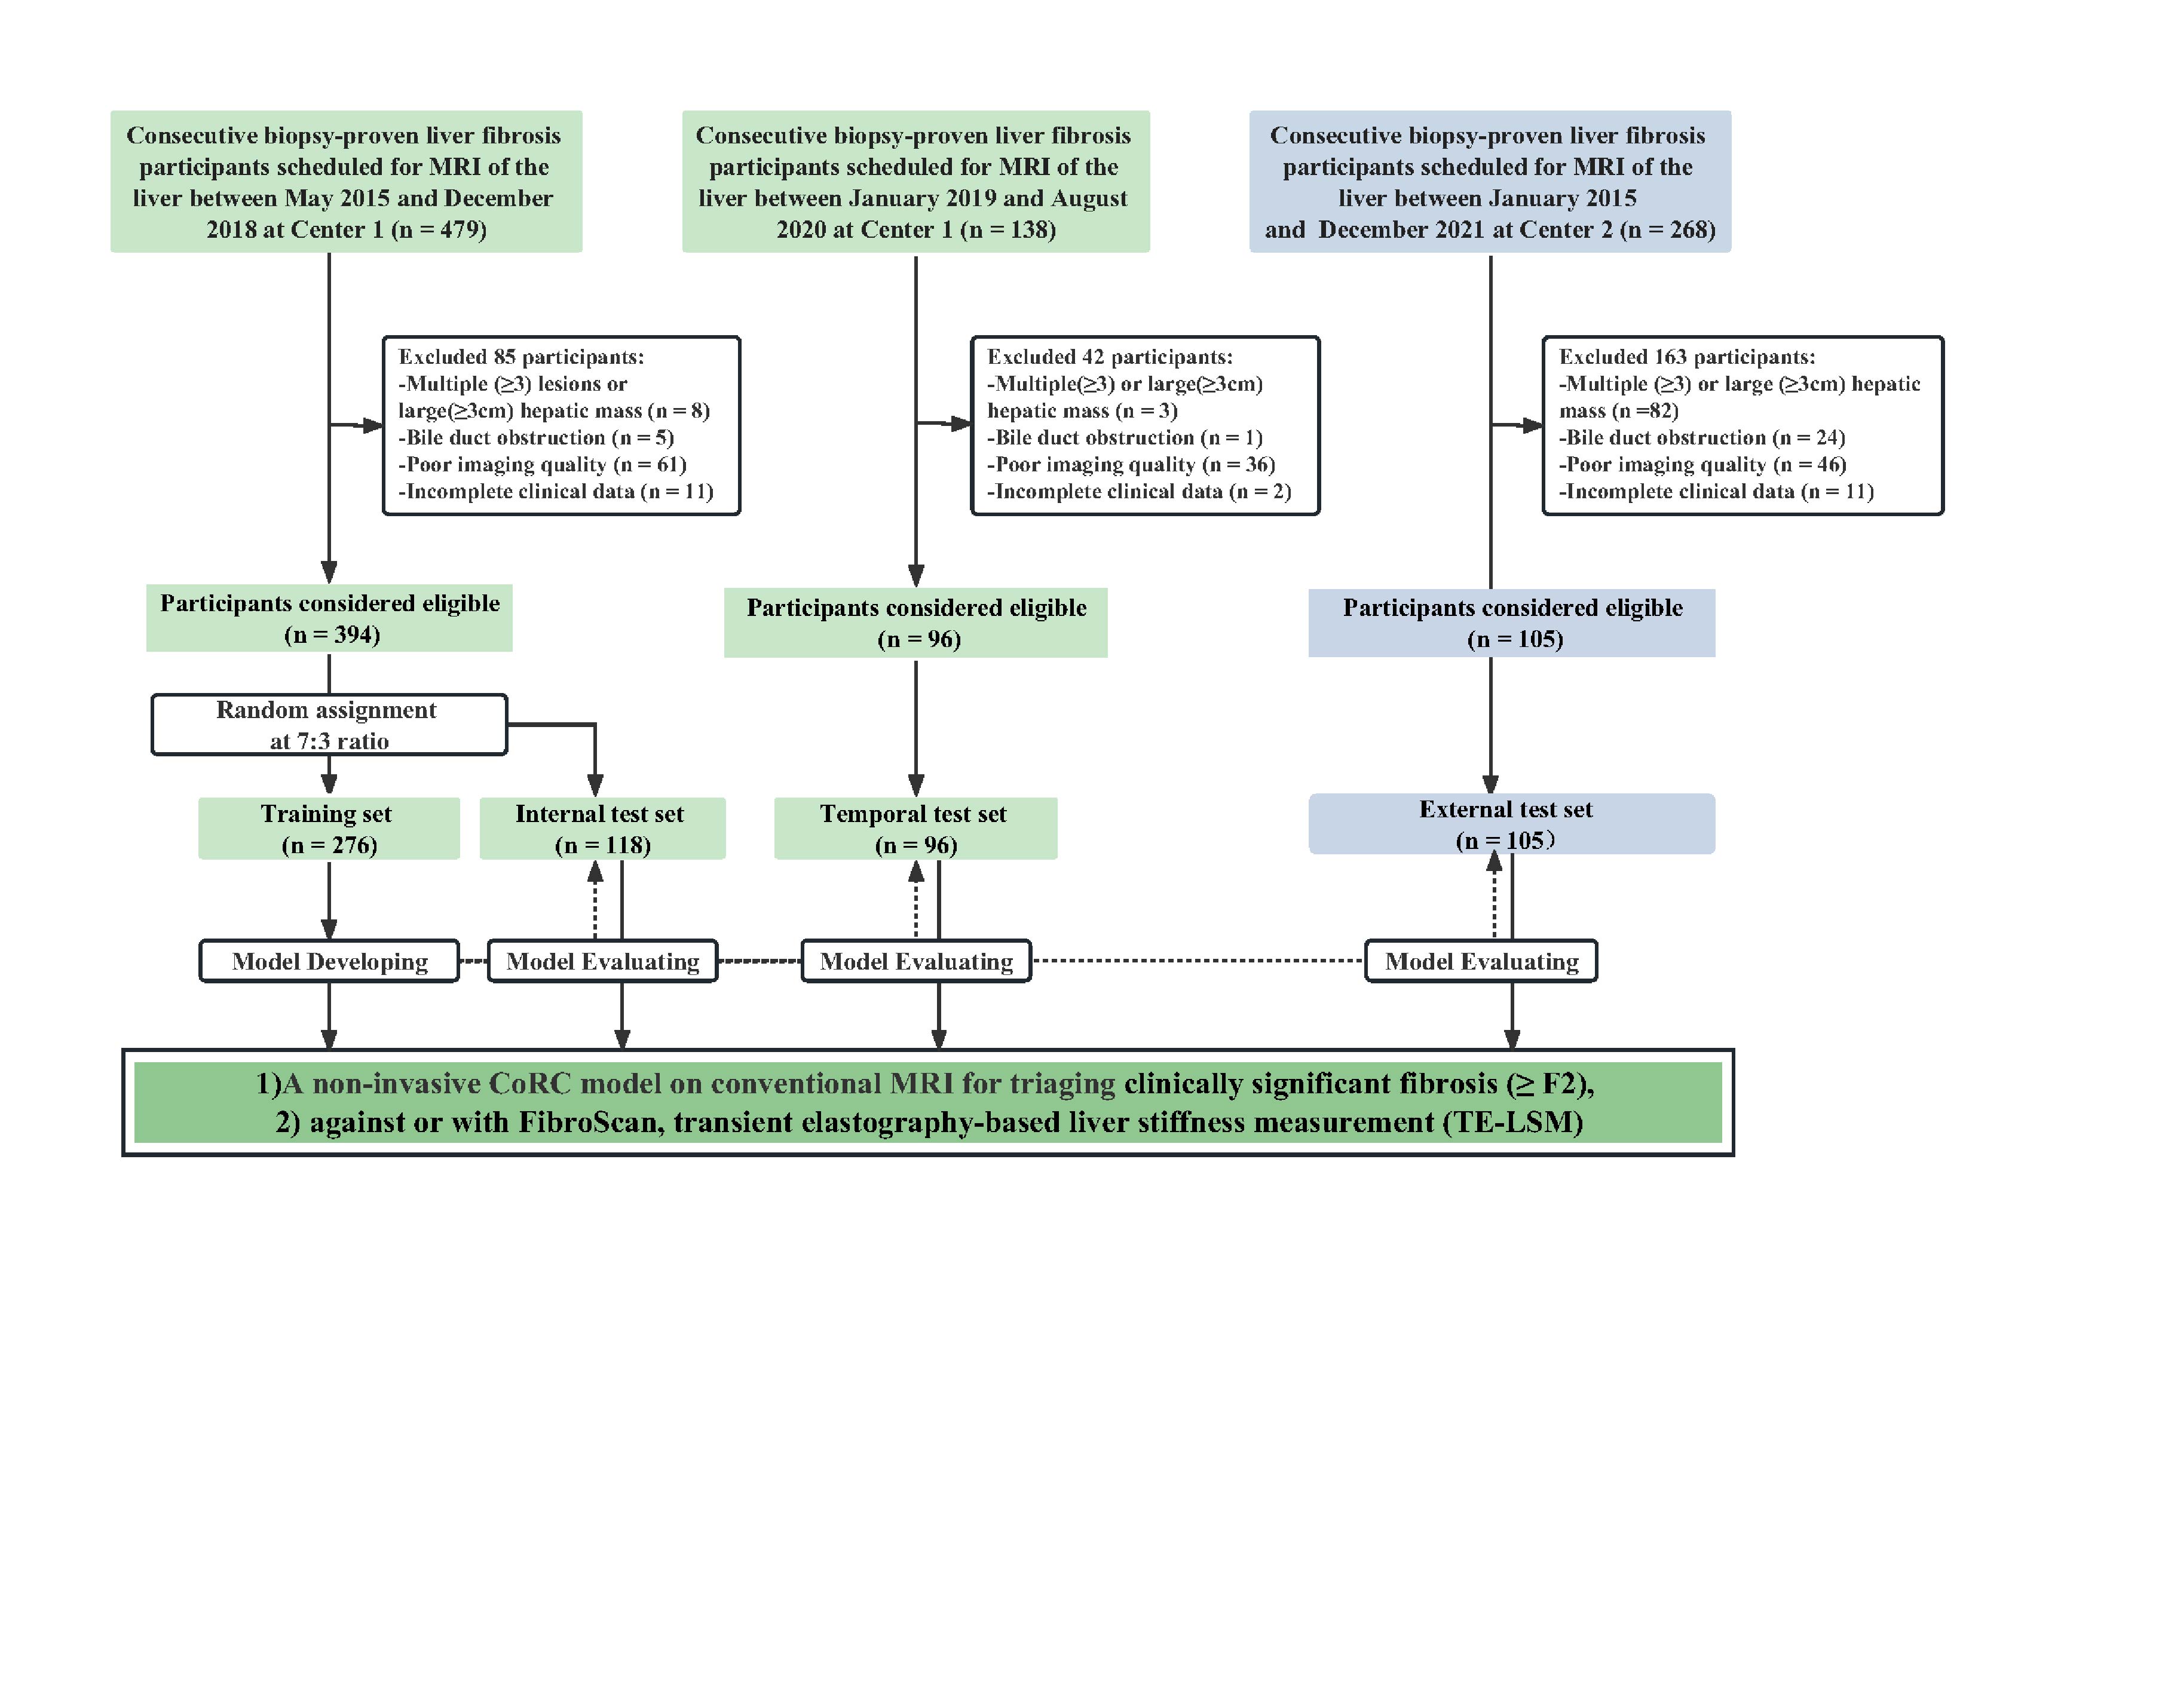
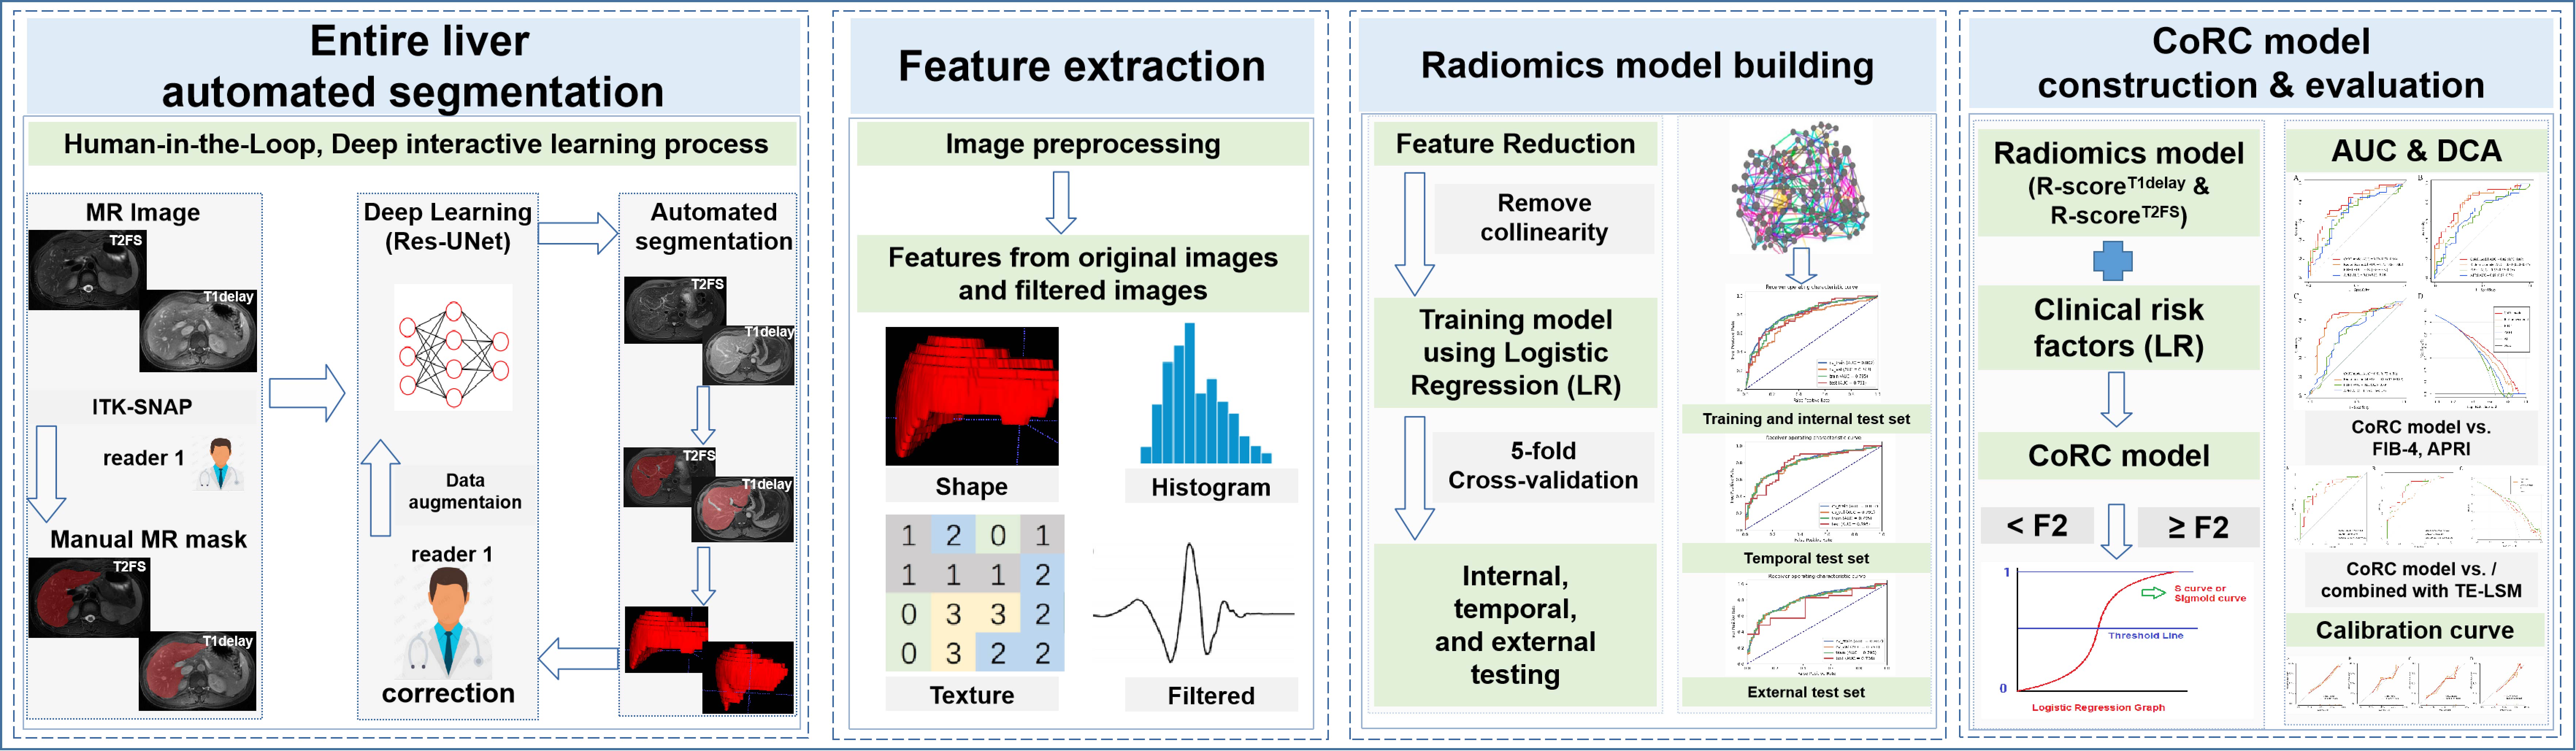
Approach: This retrospective multi-center study recruited 595 patients with biopsy proven liver fibrosis. CoRC model integrated Radiomics features extracted from the ResUNet-based automated entire liver segmentation and clinical variables with multivariate logistic regression.
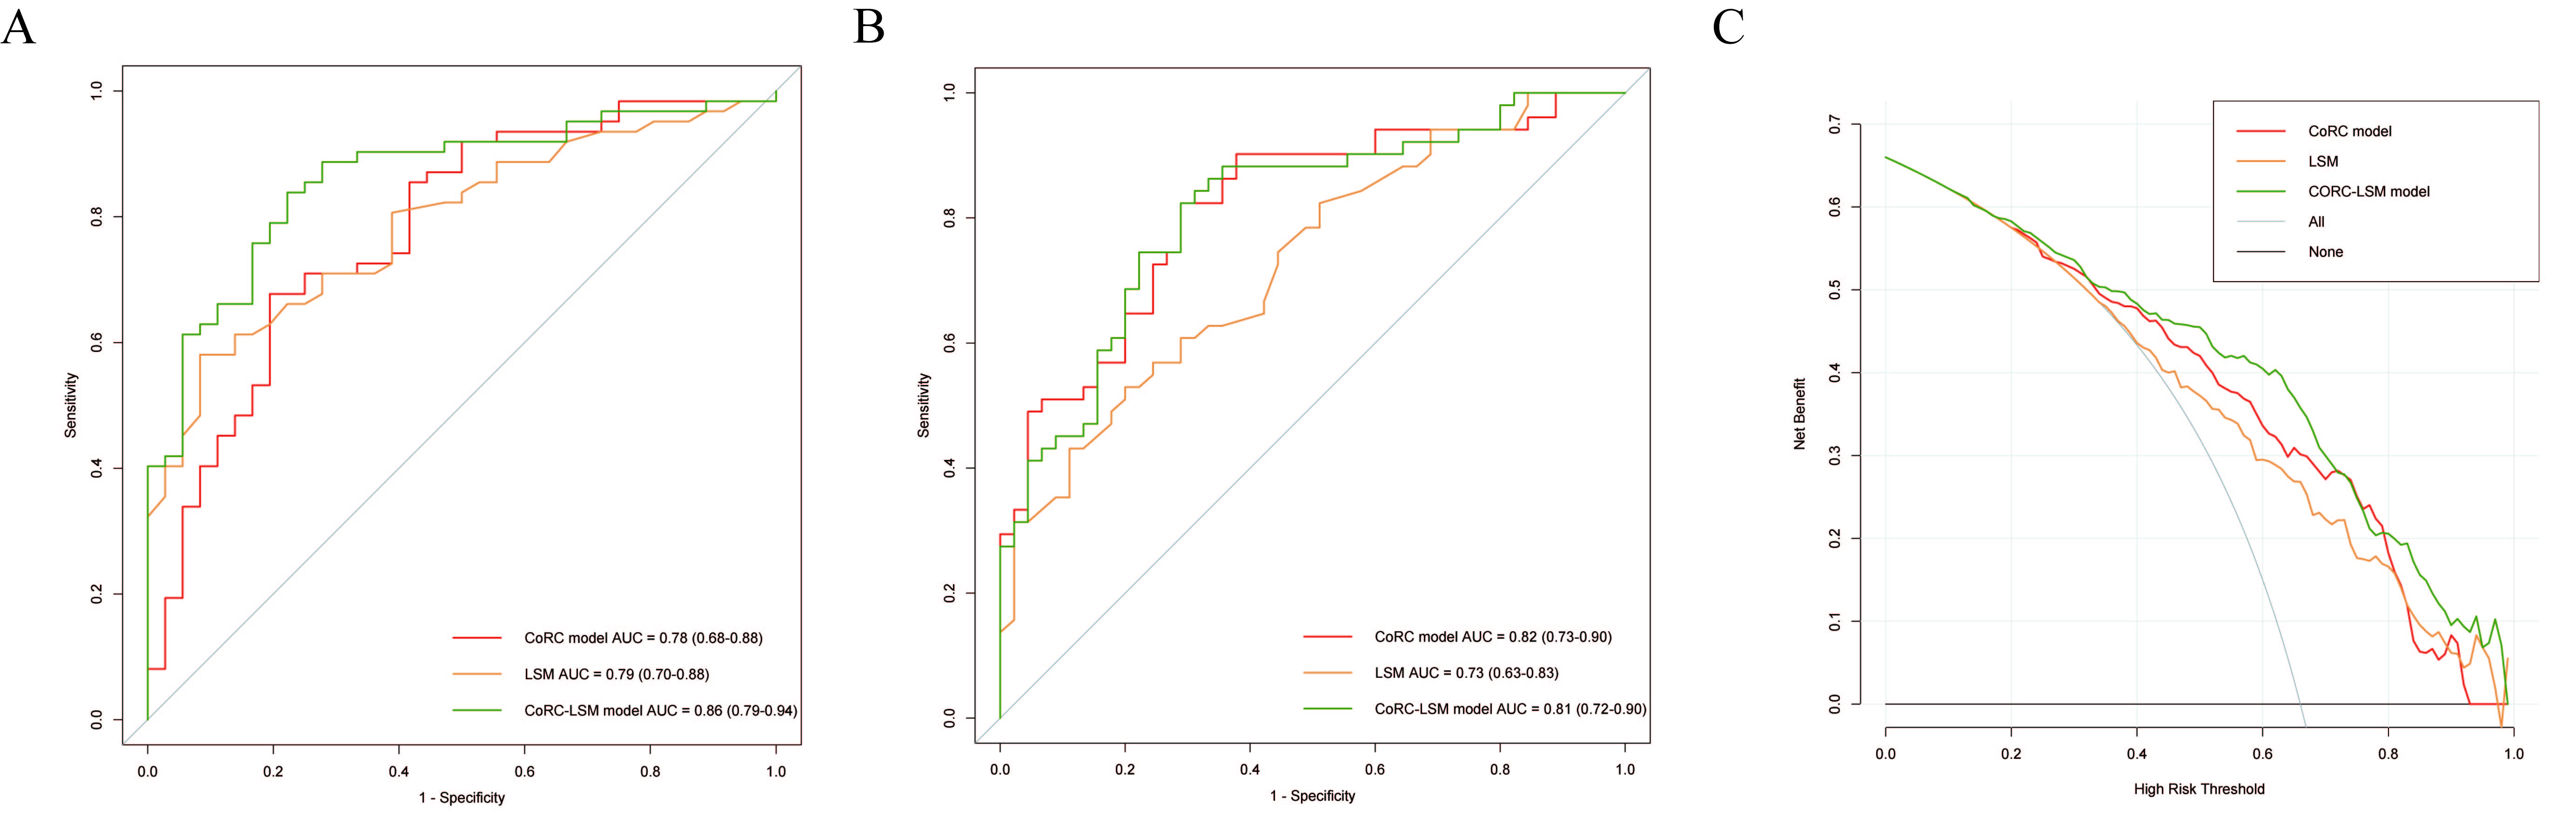
Results: Additive value of CoRC model to TE-LSM was explored with combined AUC of 0.86, and 0.81 in the internal, and temporal sets.
Impact: Complementary information provided by Radiomics features could be in combination with clinical risk factors in order to assist clinicians in assessing liver fibrosis comprehensively. CoRC models exhibited promising diagnostic performances for clinically significant liver fibrosis, complementary to TE-LSM.
Abstract
Introduction There is still an increasing need for establishing reliable non-invasive tools to accelerate progress in prognosis, risk stratification, and guiding therapy of liver fibrosis. We aimed to 1) develop and validate the combined radiomics-clinic (CoRC) model on MRI for triaging clinically significant liver fibrosis (≥ F2), 2) compare or combine with transient elastography-based liver stiffness measurement (TE-LSM) in large-scale samples.Methods This retrospective multi-center study recruited 595 patients with biopsy proven liver fibrosis from Jan 2015 to Dec 2021. Training (n = 276) and internal test (n = 118) sets were randomly allocated. A temporal test set (n = 96) and an external test set (n = 105) were used for validation. Radiomics features were extracted from the ResUNet-based automated MRI entire liver segmentation on fat-suppressed T2-weighted and delayed enhanced T1-weighted images, respectively. CoRC model integrated Radiomics scores and optimal clinical variables in the training set with multivariate logistic regression. Diagnostic performance was mainly evaluated by the area under the receiver operating characteristic curve (AUC) in the test sets.
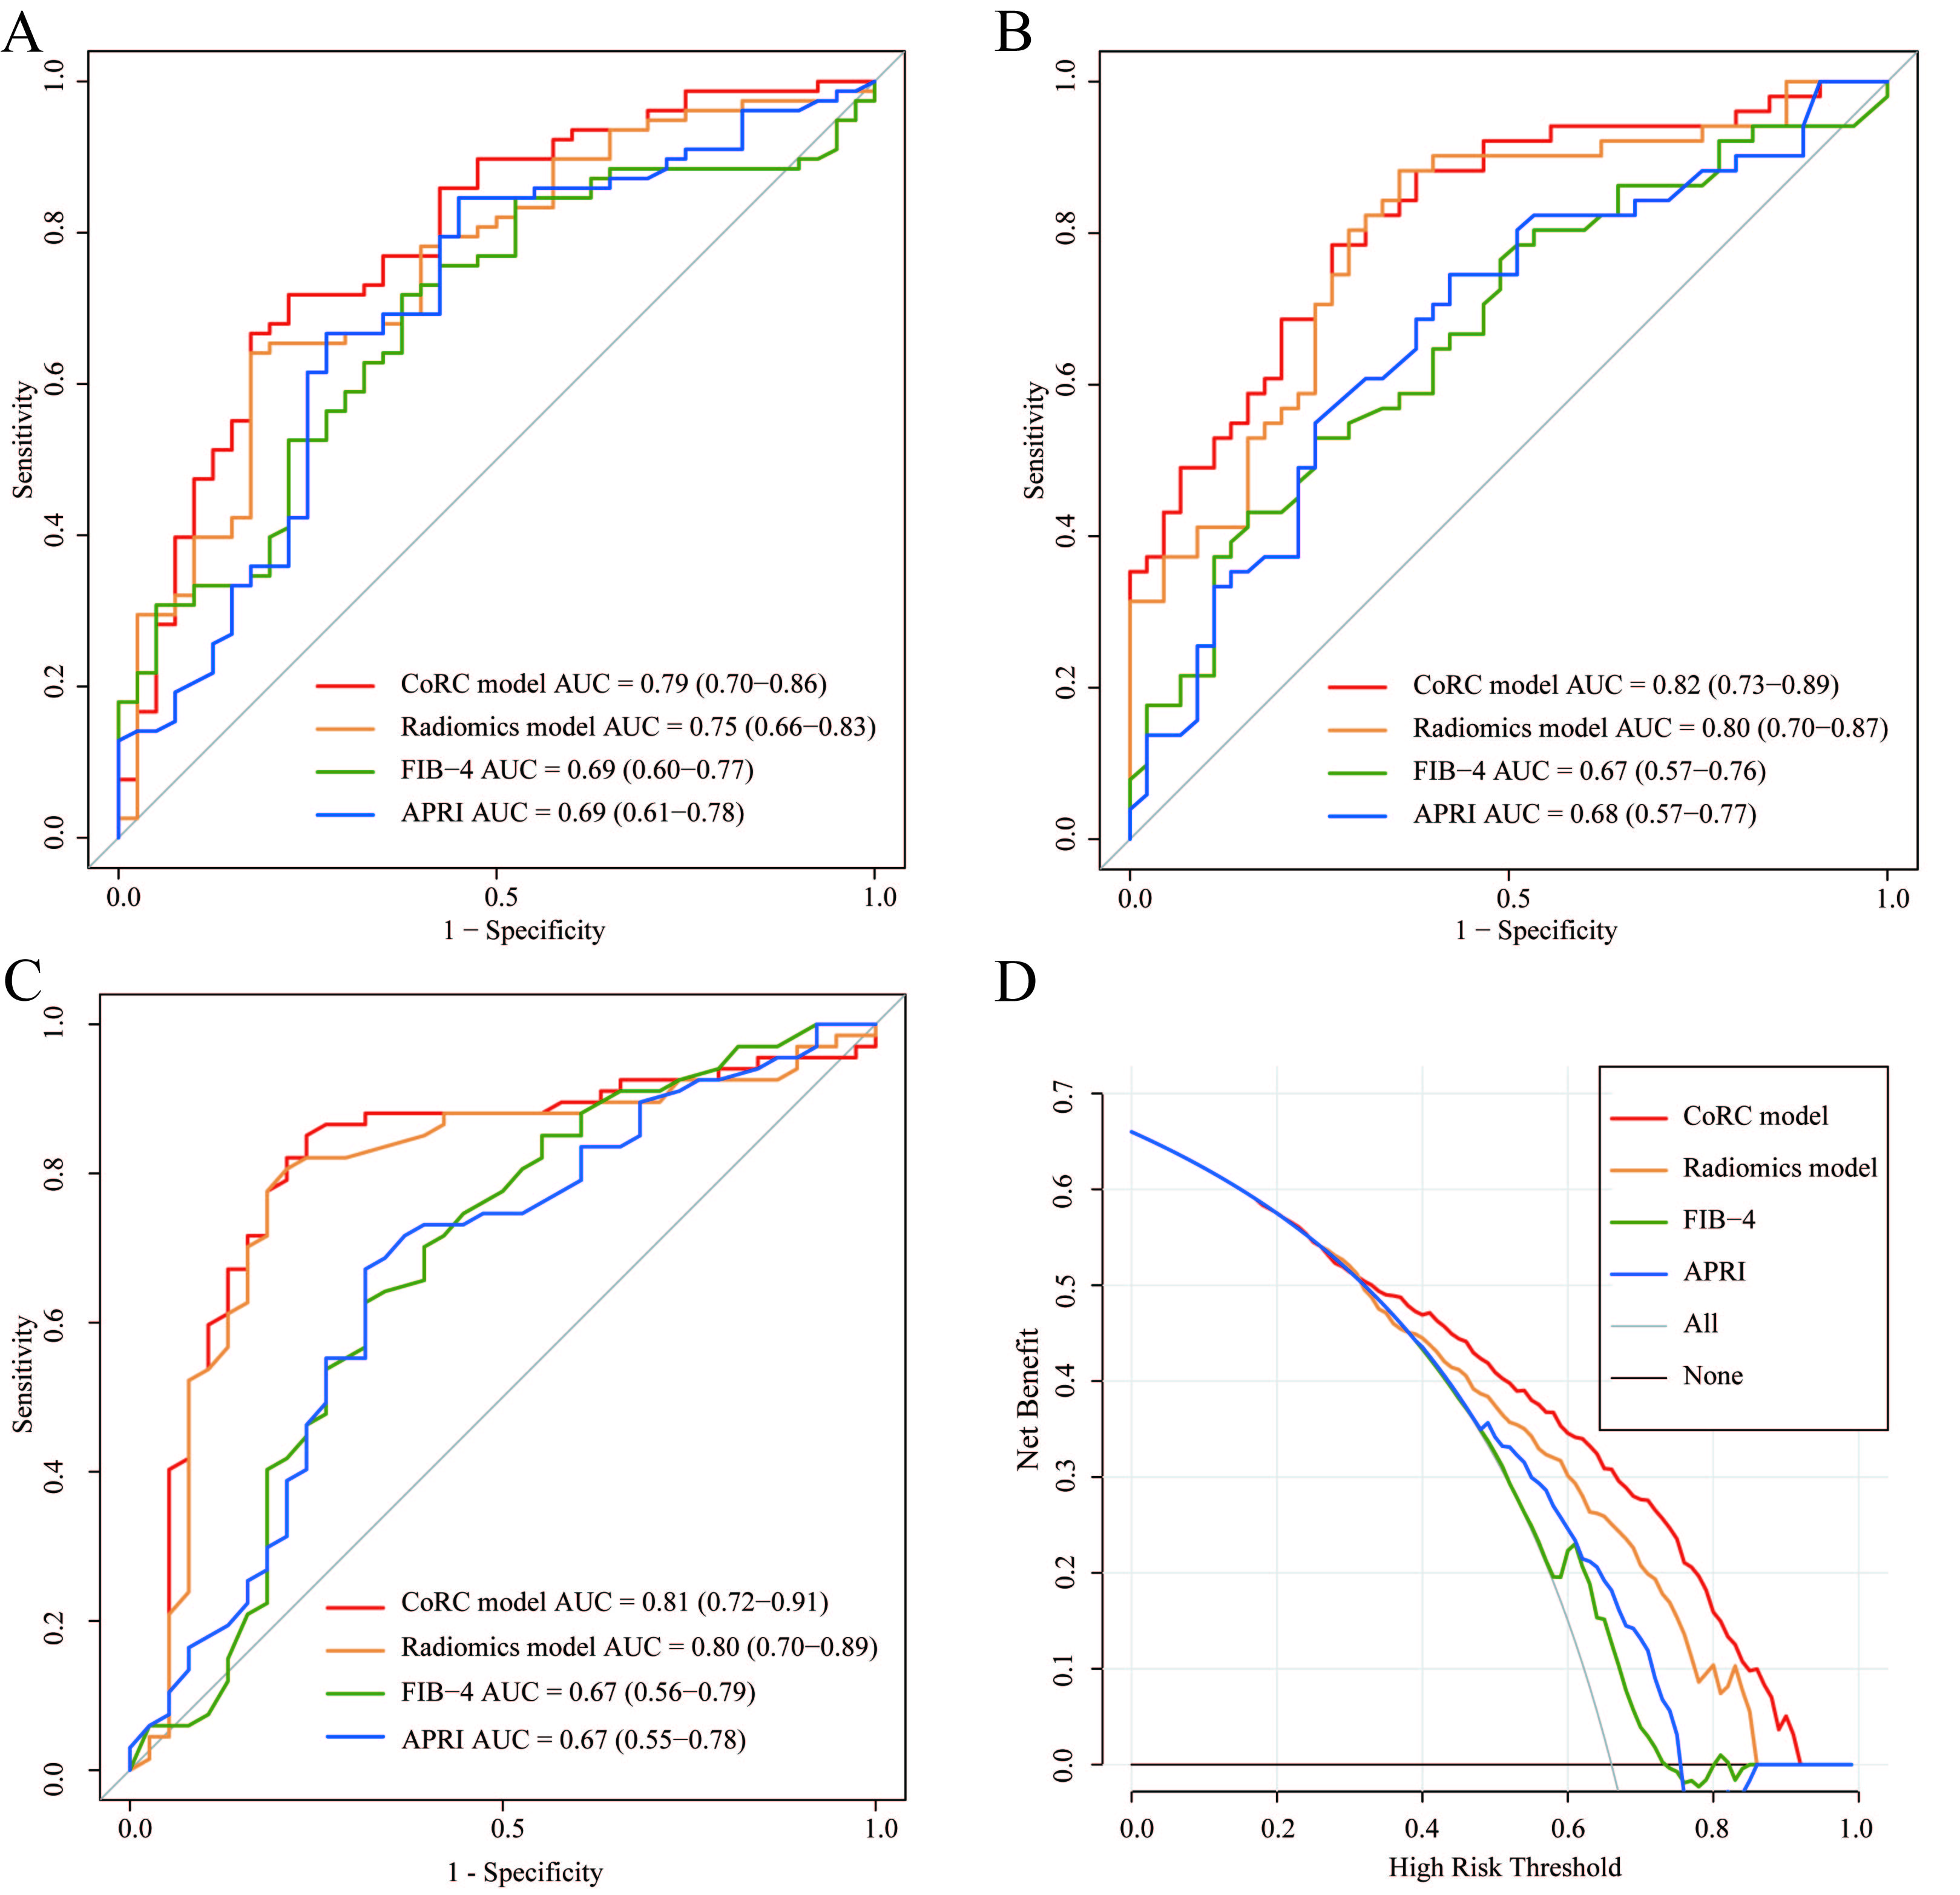
Results In the internal, temporal, and external test sets, the CoRC model yielded AUCs of 0.79 (0.70, 0.86), 0.82 (0.73, 0.89), and 0.81 (0.72-0.91), and outperformed TE-LSM in the temporal test set (integrated discrimination improvement, 12.9% [2.4-23.4%]; P = .02). Additive value of CoRC model to TE-LSM was explored, with combined AUC of 0.86 (0.79-0.94), and 0.81 (0.72-0.90) in the internal, and temporal sets (P = .01). Considering necroinflammation, CoRC model maintained the discriminatory power in the test sets (AUCs range, 0.74-0.86).
Conclusion CoRC models exhibited promising diagnostic performances for clinically significant liver fibrosis, complementary to TE-LSM.
Acknowledgements
We would like to thank Prof. Yongyue Wei, Department of Biostatistics, Nanjing Medical University, and Prof. Duolao Wang, Liverpool School of Tropical Medicine, for the professional statistical and methodological consulting. Further, we would like to thank Prof. Yicheng Ni, K.U.Leuven for providing native language help.References
1. Faria SC, Ganesan K, Mwangi I, et al. MR imaging of liver fibrosis: current state of the art. Radiographics 2009; 29(6):1615-1635. doi:10.1148/rg.296095512.
2. Harris R, Harman DJ, Card TR, et al. Prevalence of clinically significant liver disease within the general population, as defined by non-invasive markers of liver fibrosis: a systematic review. The Lancet Gastroenterol& Hepatol 2017; 2(4):288-297. doi:10.1016/s2468-1253(16)30205-9.
3. Park HJ, Lee SS, Park B, et al. Radiomics Analysis of Gadoxetic Acid-enhanced MRI for Staging Liver Fibrosis. Radiology 2019; 290(2):380-387. doi:10.1148/radiol.2018181197.
4. Yasaka K, Akai H, Kunimatsu A, et al. Liver Fibrosis: Deep Convolutional Neural Network for Staging by Using Gadoxetic Acid-enhanced Hepatobiliary Phase MR Images. Radiology 2018; 287(1):146-155. doi:10.1148/radiol.2017171928.
Figures