3611
MRI radiomics and machine learning for prediction of adherent perinephric fat1Department of Biomedical Sciences, Chonnam National University Medical School, Hwasun-gun, Korea, Republic of, 2Department of Urology, Saint Paul hospital, Hanoi, Vietnam, 3Department of Urology, Chonnam National University Hwasun Hospital, Hwasun-gun, Korea, Republic of, 4Department of Radiology, Chonnam National University Hwasun Hospital, Hwasun-gun, Jeollanam-do, Korea, Republic of, 5Department of Artificial Intelligence Convergence, Chonnam National Univeristy, Gwangju, Korea, Republic of, 6Department of Radiology, Chonnam National University Medical School, Gwangju, Korea, Republic of, 7Department of Data Science, Chonnam National University, Gwangju, Korea, Republic of, 8Department of Radiology, Chonnam National University Hospital, Gwangju, Korea, Republic of
Synopsis
Keywords: Diagnosis/Prediction, Machine Learning/Artificial Intelligence, Adherent perinephric fat
Motivation: Sticky perinephric fat (SPF) poses a surgical challenge for patients with renal cell carcinoma and the pre-operative identification of SPF is of clinical interest.
Goal(s): The aim of this study was to investigate the effectiveness of using MRI-based radiomics features in predicting the presence of SPF.
Approach: Machine learning algorithms were trained using radiomics features from T1-weighted contrast-enhanced MRI images and clinical factors (gender and BMI).
Results: The promising results on internal and external test sets pave the way to validate the current approach in a larger data set.
Impact: Machine learning models trained with MRI-derived radiomics features can provide a tool for preoperative prediction of sticky perinephric fat. The results from this study suggest that this approach may assist in improving surgical prognosis and outcomes.
INTRODUCTION
Adherent perinephric fat (APF) poses surgical risks for patients with renal cell carcinoma. The presence of APF is associated with prolonged operation time and higher intraoperative blood loss [1, 2]. Preoperative prediction of APF is, therefore, of clinical importance. Existing scoring systems such as the Mayo Adhesive Probability score [3] adopt findings on computed tomography (CT) or magnetic resonance imaging (MRI) scans. These imaging findings are evaluated by radiologists and thus susceptible to possible intra- and inter-observer variability.Another approach to predict APF is utilizing texture features from radiological images. Radiomics applies pattern-recognizing mathematical formula to pixel intensities [4]. Although researchers have reported promising results using machine learning models trained with radiomics features extracted from CT images [5, 6], to the best of our knowledge, the predictive value of MRI-derived radiomics features remains unknown. This study aimed to investigate the usefulness of integrating MRI-radiomics analysis and machine learning algorithms in APF prediction.
METHODS
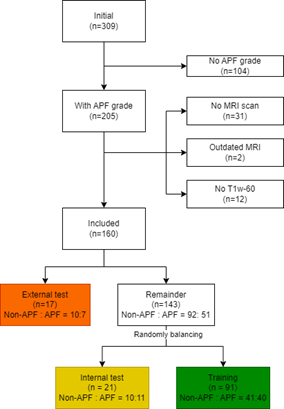
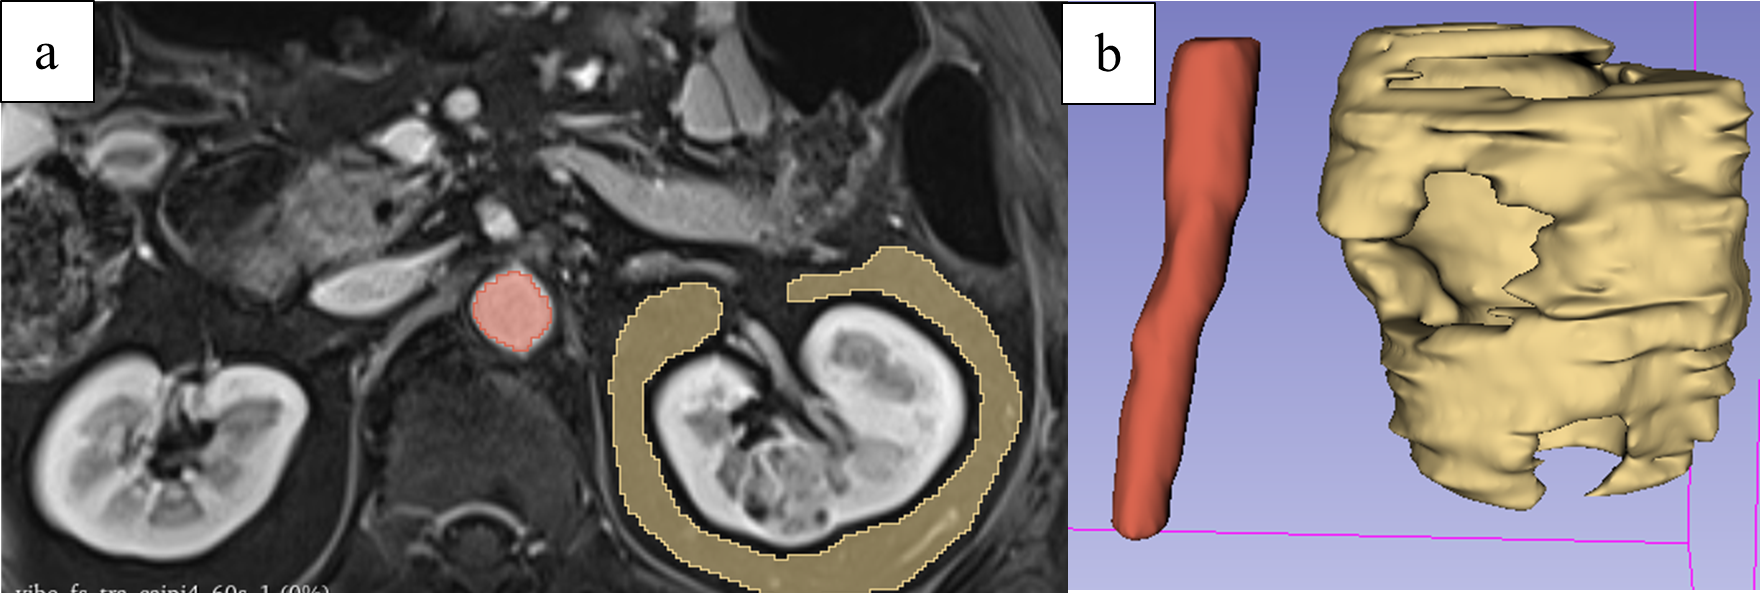
Patients who were diagnosed with renal cell carcinoma and underwent surgery between April 2019 and February 2022 at Chonnam National University Hwasun Hospital were retrospectively screened. An experienced uro-oncological surgeon reviewed available surgical note(s) and video recording(s) of each patient and stratified the data into “APF” or “non-APF. Pre-operative T1-weighted MRI scans acquired at 60 second following contrast injection (T1w-60) were collected. Seventeen patients with MRI scans from outside hospitals were set aside as an external test set. The remaining cohort was significantly imbalanced; therefore, a random downsampling was applied to the non-APF group to make the number of two groups balanced. The data were, then, randomly divided into an internal test and a training set (Figure 1).Regions of interest (ROI) were manually delineated on T1w-60 using 3D-Slicer (v. 5.2.2) [7]. For each scan, two ROIs were defined: perinephric fat tissue and the segment of aorta on the same level as the targeted kidney (Figure 2).
Preprocessing steps included voxel resizing to 1x1x1, N4 Bias Correction filtering, and aorta-based normalization. We assumed that the relative mean intensity of voxels inside the segment of aorta ROI should be similar across T1w-60 scans and applied the aorta-based normalization as follows:
$$$I^*(a) = {1000.I(a) \over µ_A}$$$ , where I*(a), I(a) and µA are the intensity of voxel a in the normalized image, the intensity of voxel a in the original image and the mean intensity of voxels inside the segment of aorta ROI, respectively. 1000 is an arbitrary constant.
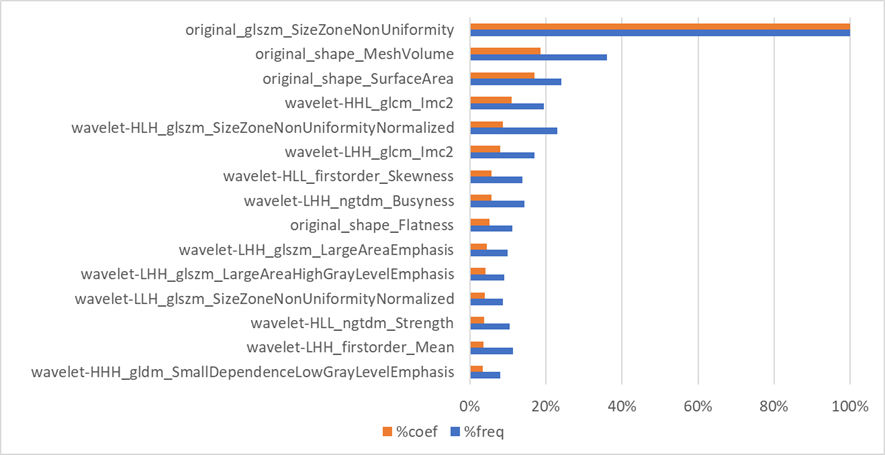
The feature extraction process provided a total of 851 original and wavelet features. Furthermore, gender and Body Mass Index (BMI) were added to the set of features because they have been known to be predictive factors in previous studies [2, 3]. Highly correlated features with Pearson’s correlation coefficient greater than 0.95 were removed, leading to the final set of 252 features for each patient. Least Absolute Shrinkage and Selection Operator (LASSO) was then implemented for feature selection. The final feature set was determined based on both the highest summation of LASSO’s coefficients and the frequency of selection in LASSO.
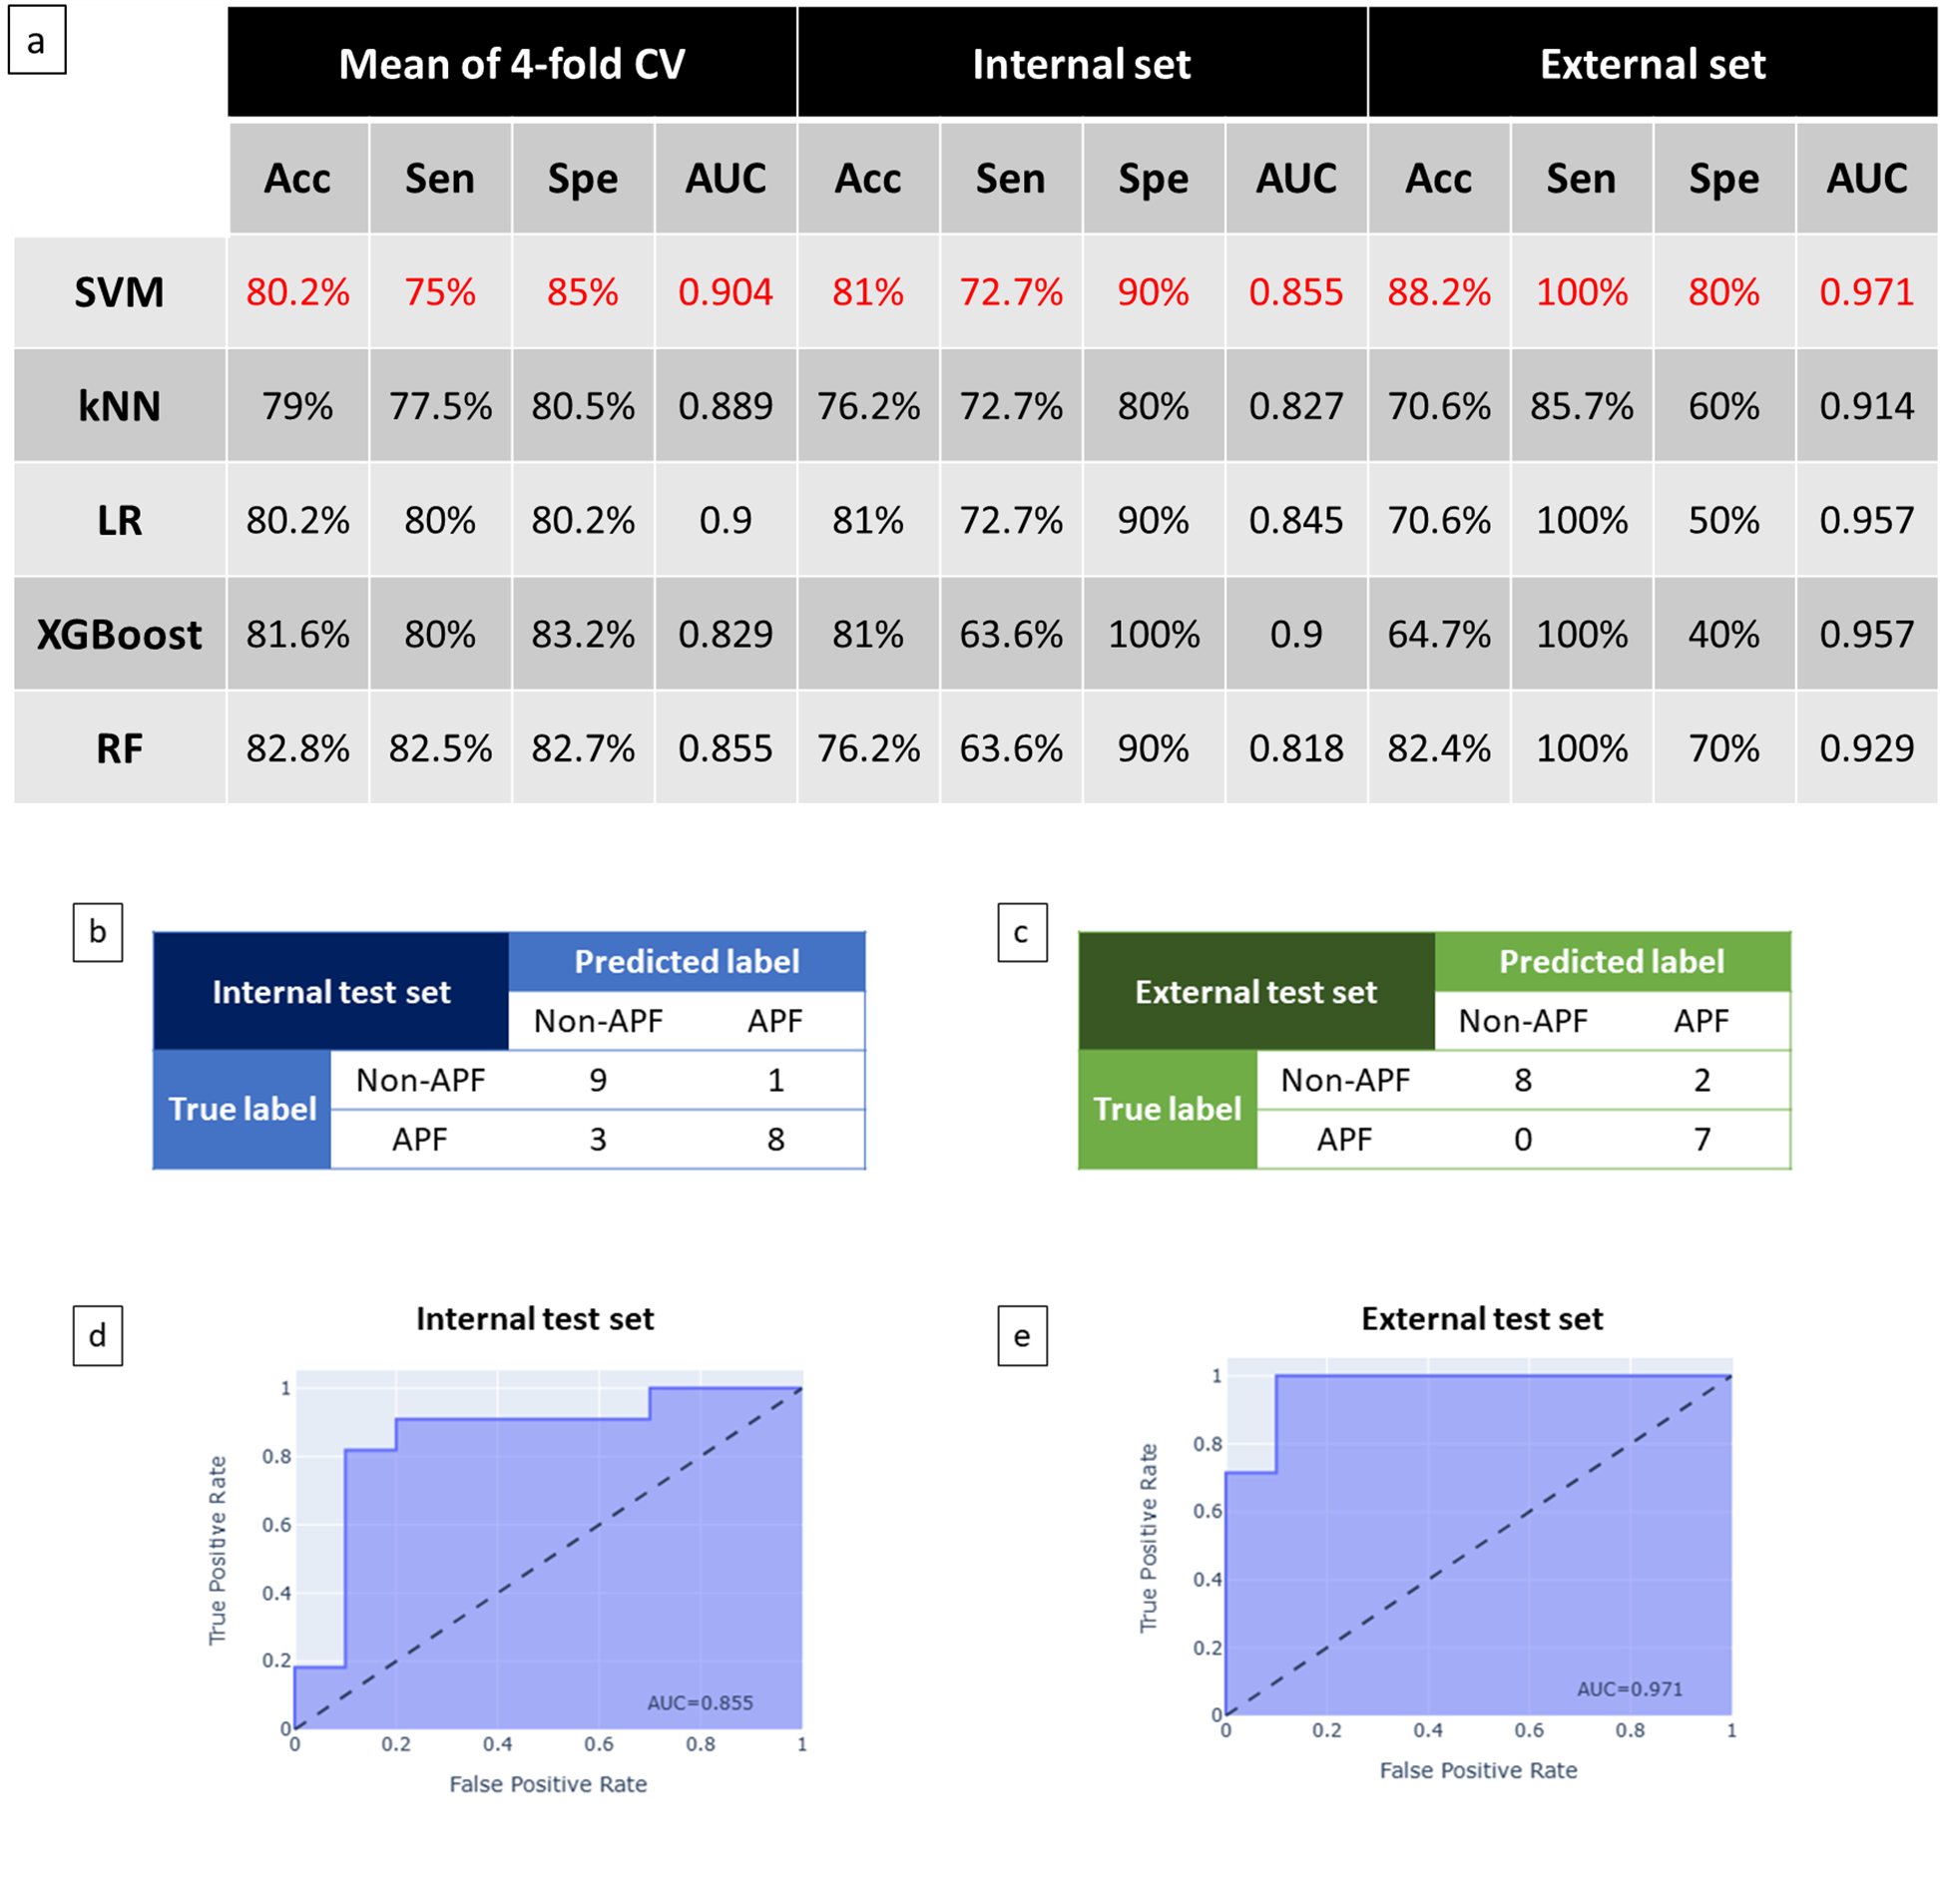
The final feature set was then used for model development and training. Various algorithms were implemented using 4-fold cross validation (4-fold CV), including K-nearest neighbors (kNN), Logistic Regression (LR), Support Vector Machine (SVM), Random Forest (RF), and XGBoost (XGB). The model that achieved the highest mean AUC was finally chosen and its performance was evaluated using the internal and external test sets.
RESULTS AND DISCUSSION
Research population characteristics are demonstrated in Figure 3. Of note, the training and internal test sets had significantly more men than women, while gender was similarly distributed in external test set. BMI was evenly distributed across different sets.In contrast to the previous works where gender and BMI were predictive factors [2, 3], both were not among the selected features in this study (Figure 4).
Figure 5a shows the performances of models that were fine-tuned following 4-fold CV strategy. SVM achieved the highest mean AUC across four folds and was chosen as the final model. Its performance on the internal and external test sets was exhibited in more detail in Figure 5b-e.
The limitations of this study include a small data set and ground truth provided by only one expert.
CONCLUSIONS
The results from this study suggest that APF may be predicted by machine learning algorithms trained with radiomics features from MRI scans. Further evaluation of a larger data set is necessary to validate our findings.Acknowledgements
No acknowledgement found.References
Figures