3607
Utility of whole tumor texture analysis based on MRI and ADC values in differentiating uterine sarcomas from cellular uterine leiomyomas1Department of Radiology, Graduate school of Bengbu Medical College, Bengbu, China, 2Department of Radiology, The First Affiliated Hospital of USTC, Hefei, China
Synopsis
Keywords: Diagnosis/Prediction, Machine Learning/Artificial Intelligence
Motivation: The treatment methods and prognosis of cellular uterine leiomyomas (CULs) and uterine sarcomas (USs) are different. The ADC values has certain differential diagnostic value, but there is some overlap between them. Texture analysis (TA) may have some potential and complementary role in differential diagnosis.
Goal(s): To explore the capability of TA based on MRI and ADC values in the differential diagnosis of USs from CULs.
Approach: Combining the ADC values and texture parameters to set up diagnostic model and evaluate the diagnosis value and clinical usefulness of the model.
Results: Texture analysis combined with DWI could be helpful to distinguish USs and CULs.
Impact: Texture analysis combined with DWI give a better method to identify uterine sarcomas and cellular uterine leiomyomas, providing a more reliable basis for the choice of clinical treatment.
Purpose
This study aimed to evaluate the capability of whole tumor texture analysis (TA) based on MRI and apparent diffusion coefficient (ADC) values in the differential diagnosis of uterine sarcoma (US) from cellular uterine leiomyoma (CUL).Methods
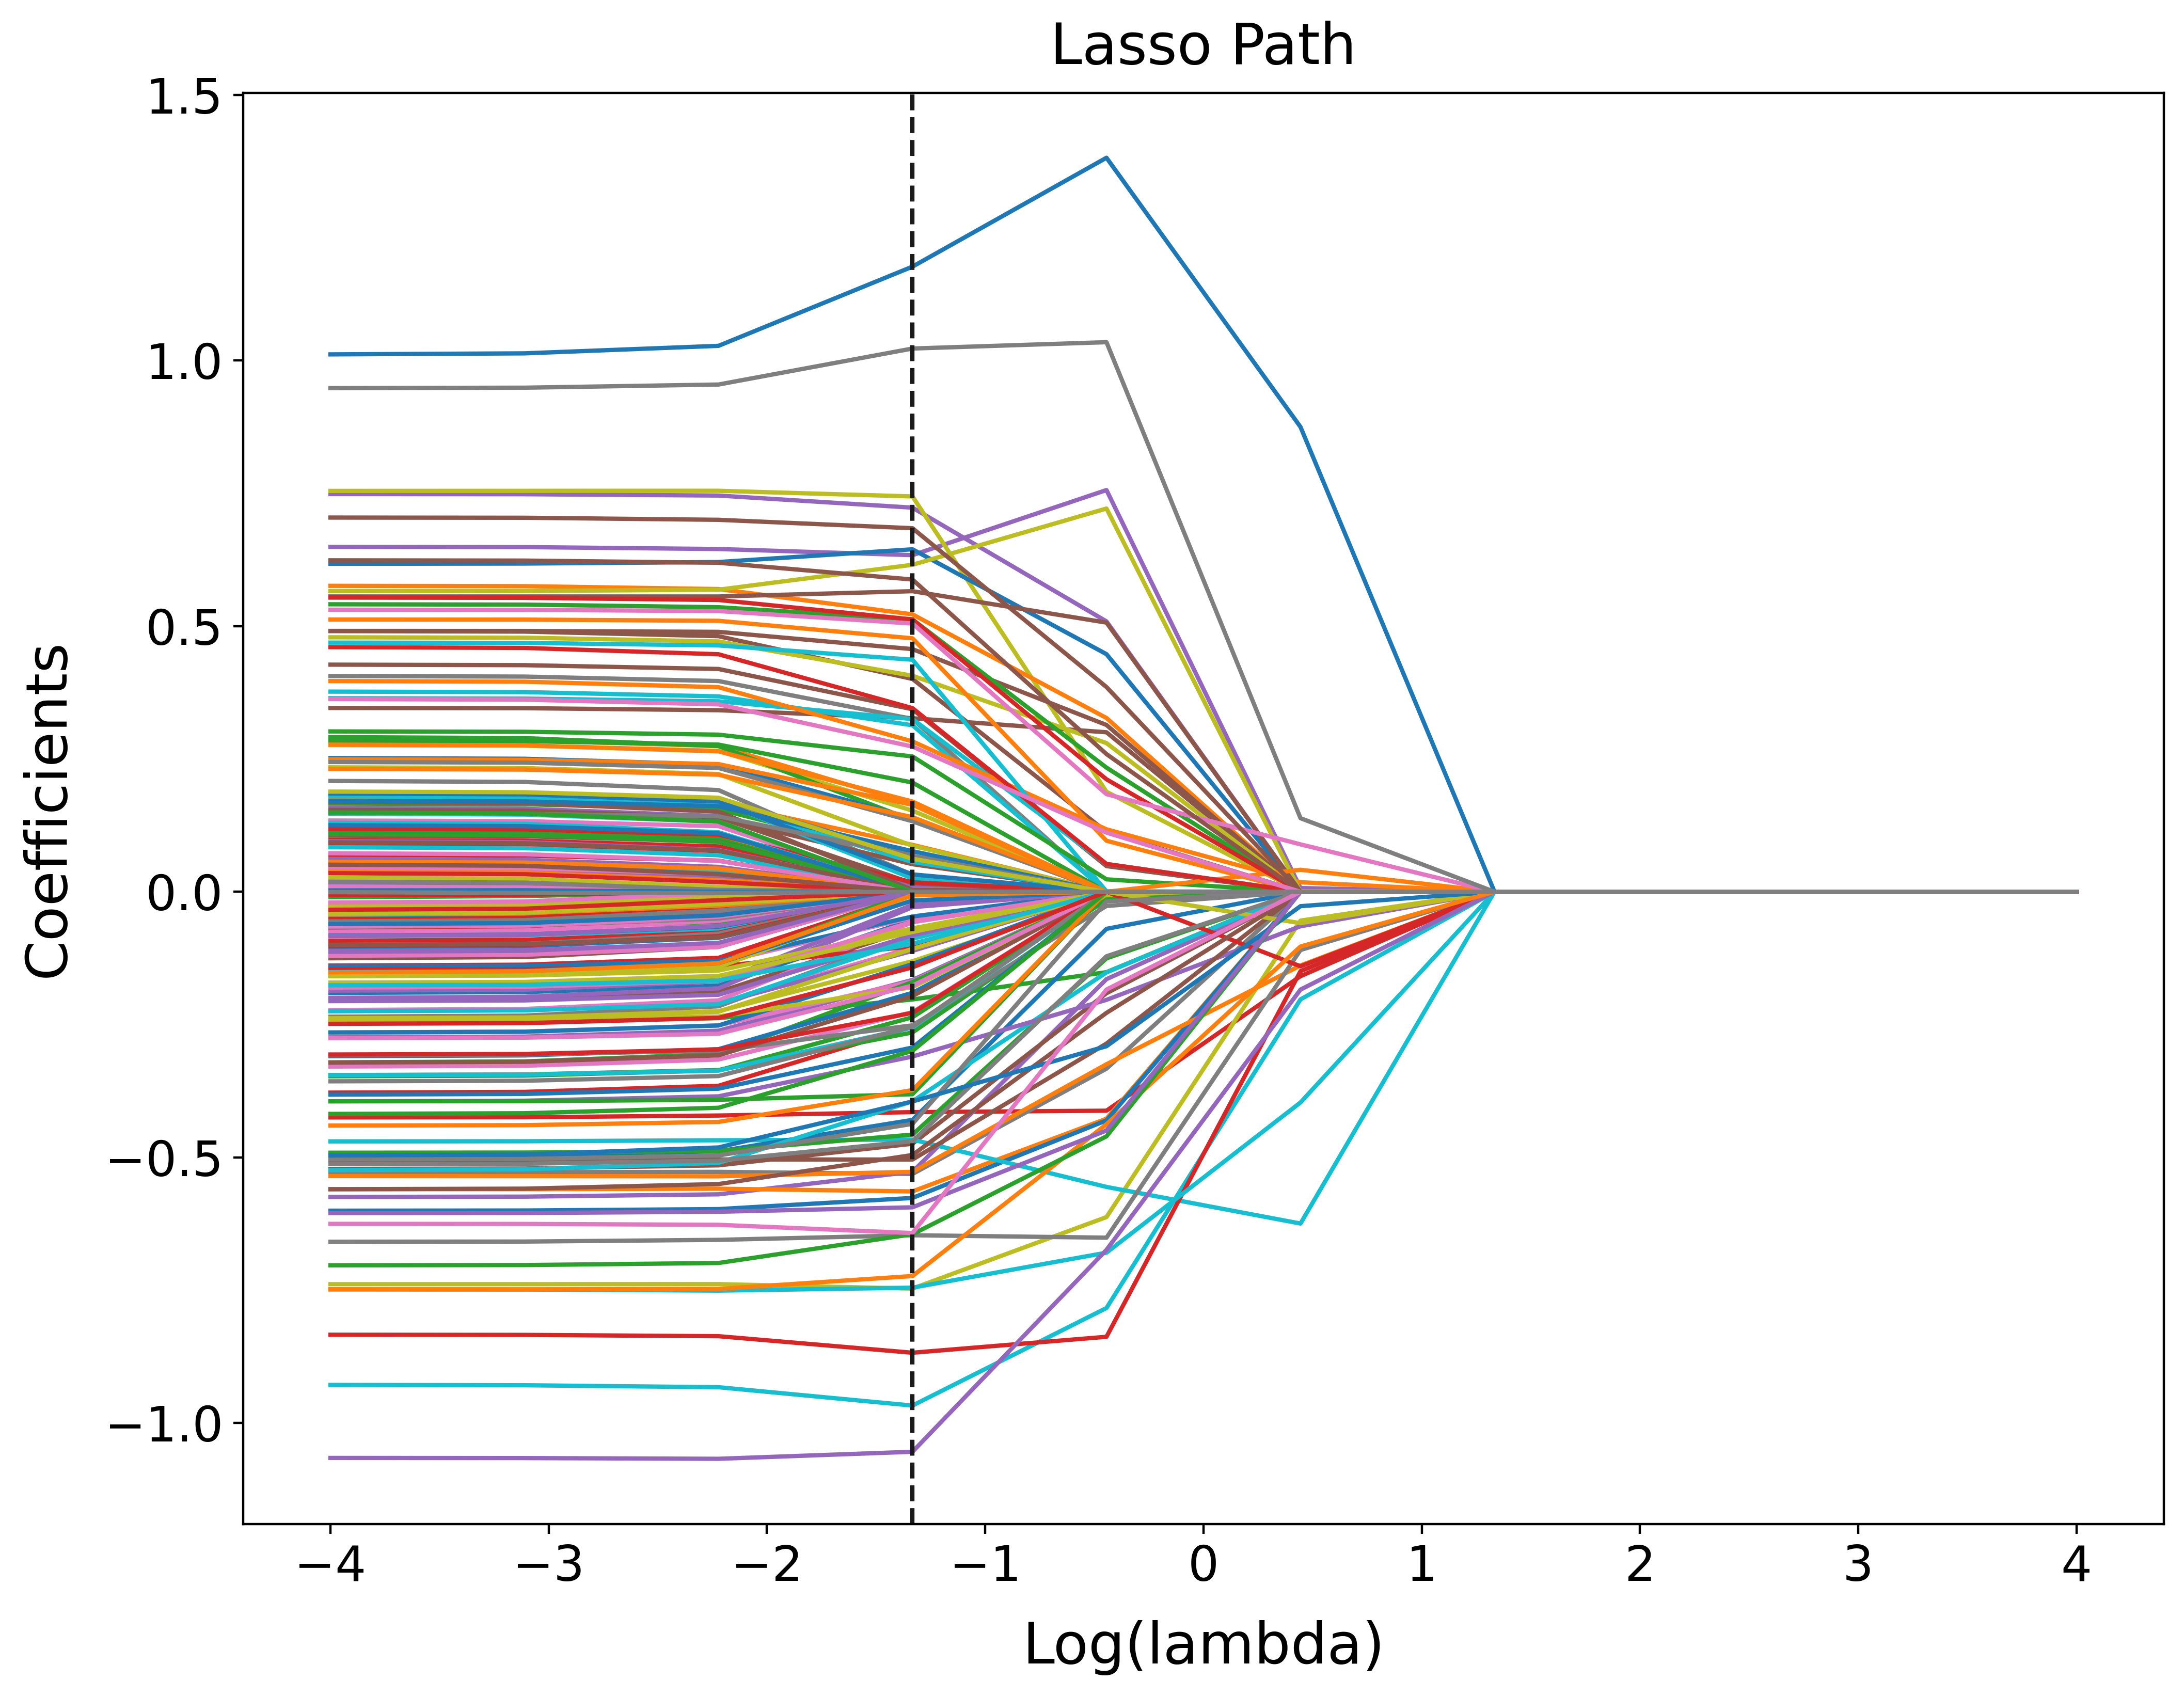
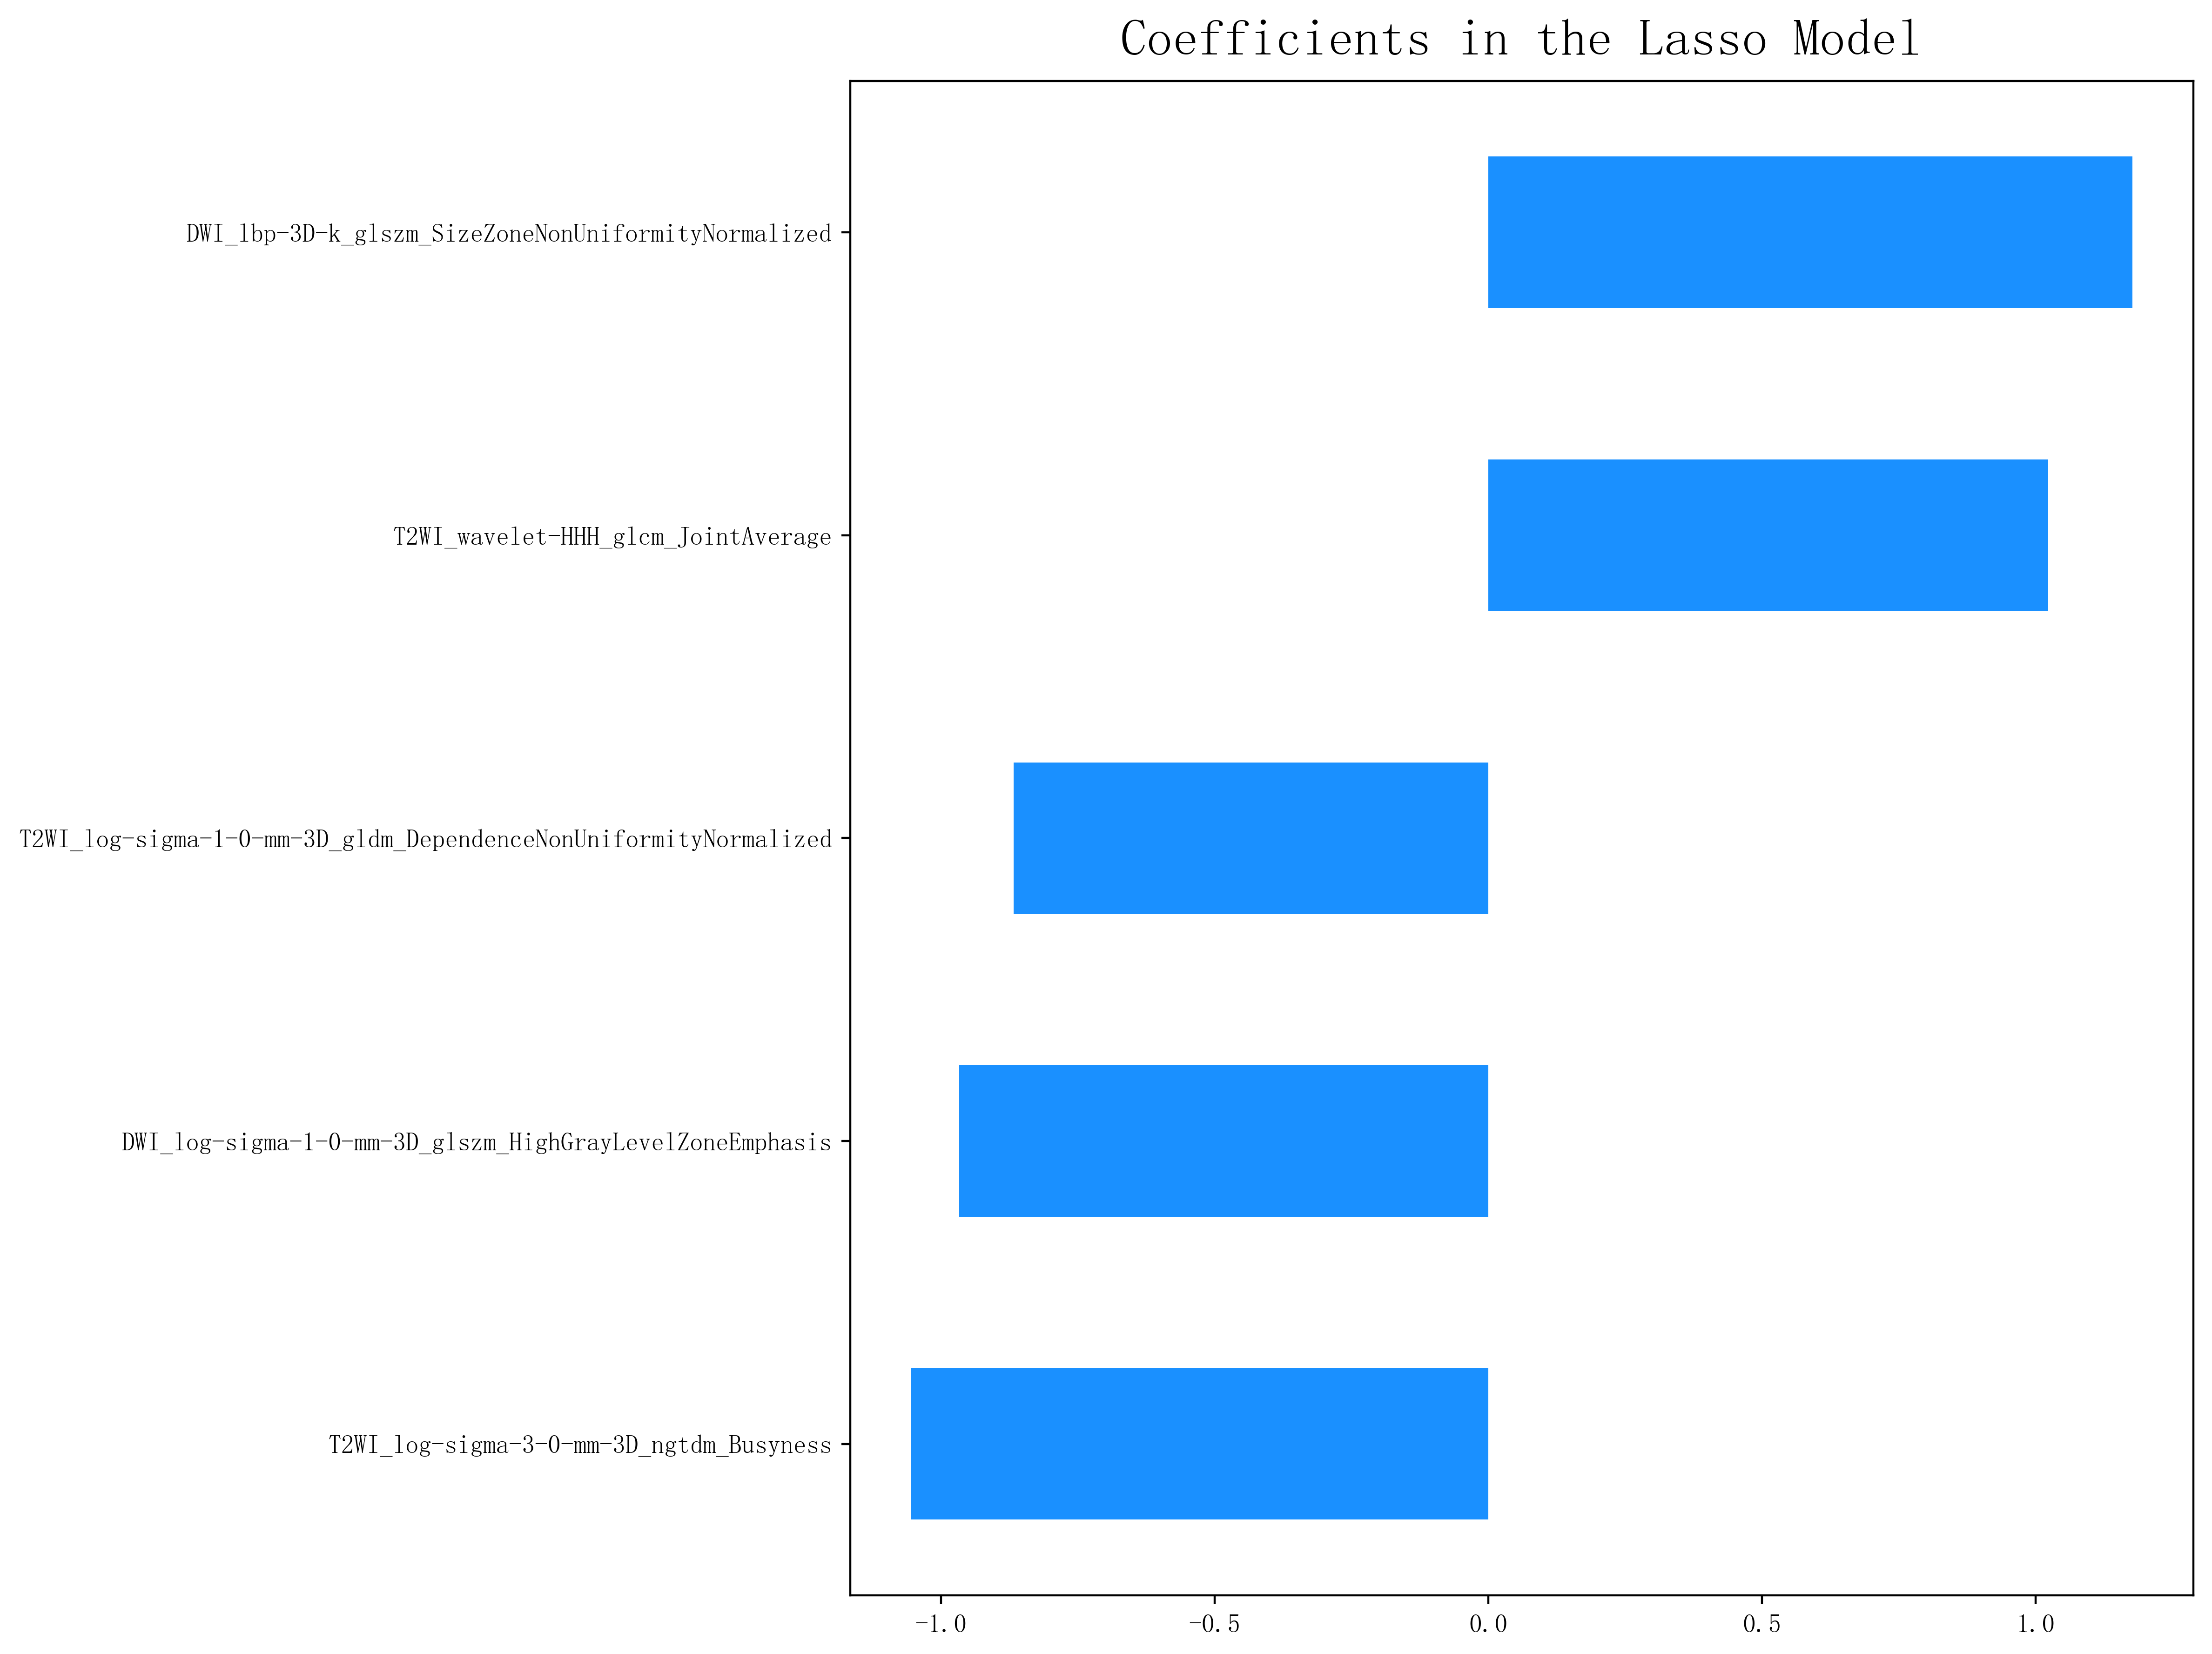
61 patients confirmed by pathology was retrospectively reviewed, including 34 cases of cellular uterine leiomyoma and 27 cases of uterine sarcoma. All patients underwent conventional MRI and DWI (b values of 0 and 1000 s/mm2), and the ADC values (mean ADC, min ADC and standardized ADC (sT-ADC): tumor ADC/gluteus maximus ADC) were measured and calculated. Whole tumors were segmented by manually drawing the lesion contours on each slice of T2WI and DWI images, then the texture features were selected by using the Intraclass correlation efficient (ICC) analysis, Pearson correlation analysis, and the least absolute shrinkage and selection operator (LASSO). Mann-Whitney U test to compare the ADC values. The model was developed using Logistic regression analysis based on the selected texture features and ADC values, and then its calibration, discrimination and clinical usefulness was assessed.Results
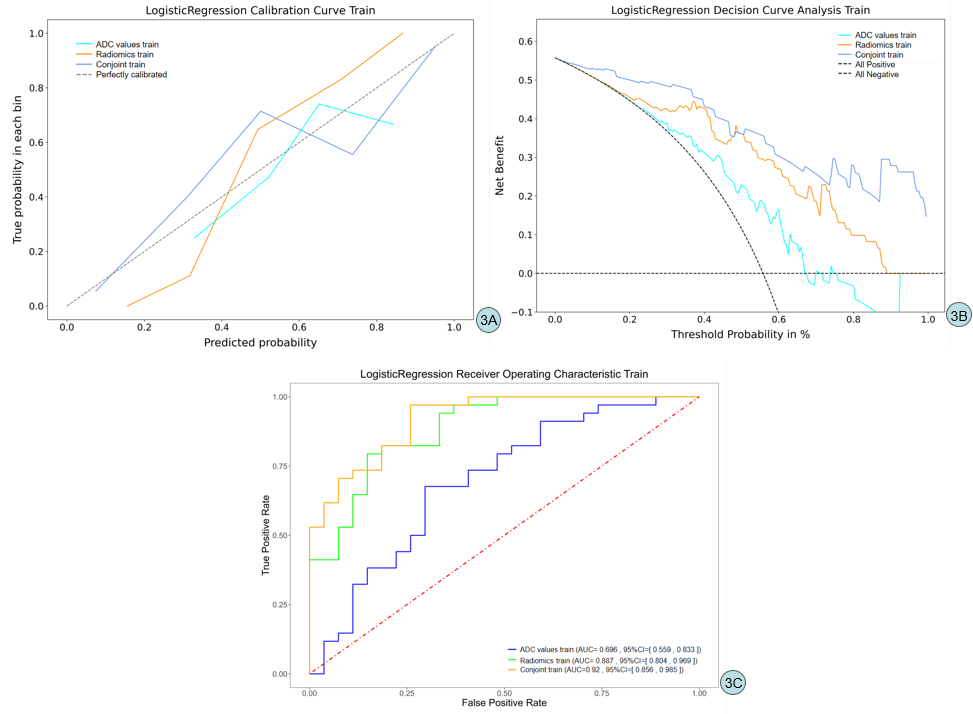
The mean ADC, min ADC and sT-ADC of USs were significantly lower than those of CULs(1.113(0.33) ×10-3 mm2/s vs 1.265(0.273) ×10-3 mm2/s, 0.927(0.246) ×10-3 mm2/s vs 1.078(0.233) ×10-3 mm2/s, 0.776(0.314) vs 0.876(0.152), P < 0.05), ROC curve analysis of their combinations yielded an AUC: 0.6961(95%CI:0.5572,0.8246).Additionally, five significant texture features were finally selected, incorporating these features into ADC values showed better performance for the tumor differentiation, with an AUC of 0.9205(95%CI :0.8467,0.9760), (z=3.358, P<0.001) as well as good calibration in both datasets. Decision curve analysis confirmed its clinical usefulness.Conclusion
The findings suggested that a combination of whole tumor texture analysis based on MRI and ADC values could be useful in the preoperative assessment of uterine masses to differentiate uterine sarcomas with cellular uterine leiomyomas. Incorporation of texture into ADC improves the differential diagnostic accuracy.Key words
Magnetic resonance imaging, Diffusion-weighted imaging, Texture analysis, Uterine sarcoma, Cellular uterine leiomyomaAcknowledgements
No acknowledgement found.References
No reference found.Figures