3605
Prediction of Postsurgical Progression of Prostate Cancer Using MRI Cancer Risk Maps1Radiology and Biomedical Imaging, University of California, San Francisco, San Francisco, CA, United States, 2Urology, University of California, San Francisco, San Francisco, CA, United States
Synopsis
Keywords: Diagnosis/Prediction, Prostate
Motivation: Biochemical recurrence (BCR) remains a significant concern for patients after radical prostatectomy.
Goal(s): This study’s objective was to determine whether automated mpMRI cancer risk maps could predict postsurgical prostate cancer (PCa) progression (Biochemical Recurrence (BCR).
Approach: Derived lesion volumes and mpMRI parameters from the cancer risk maps were used to analyze factors for BCR.
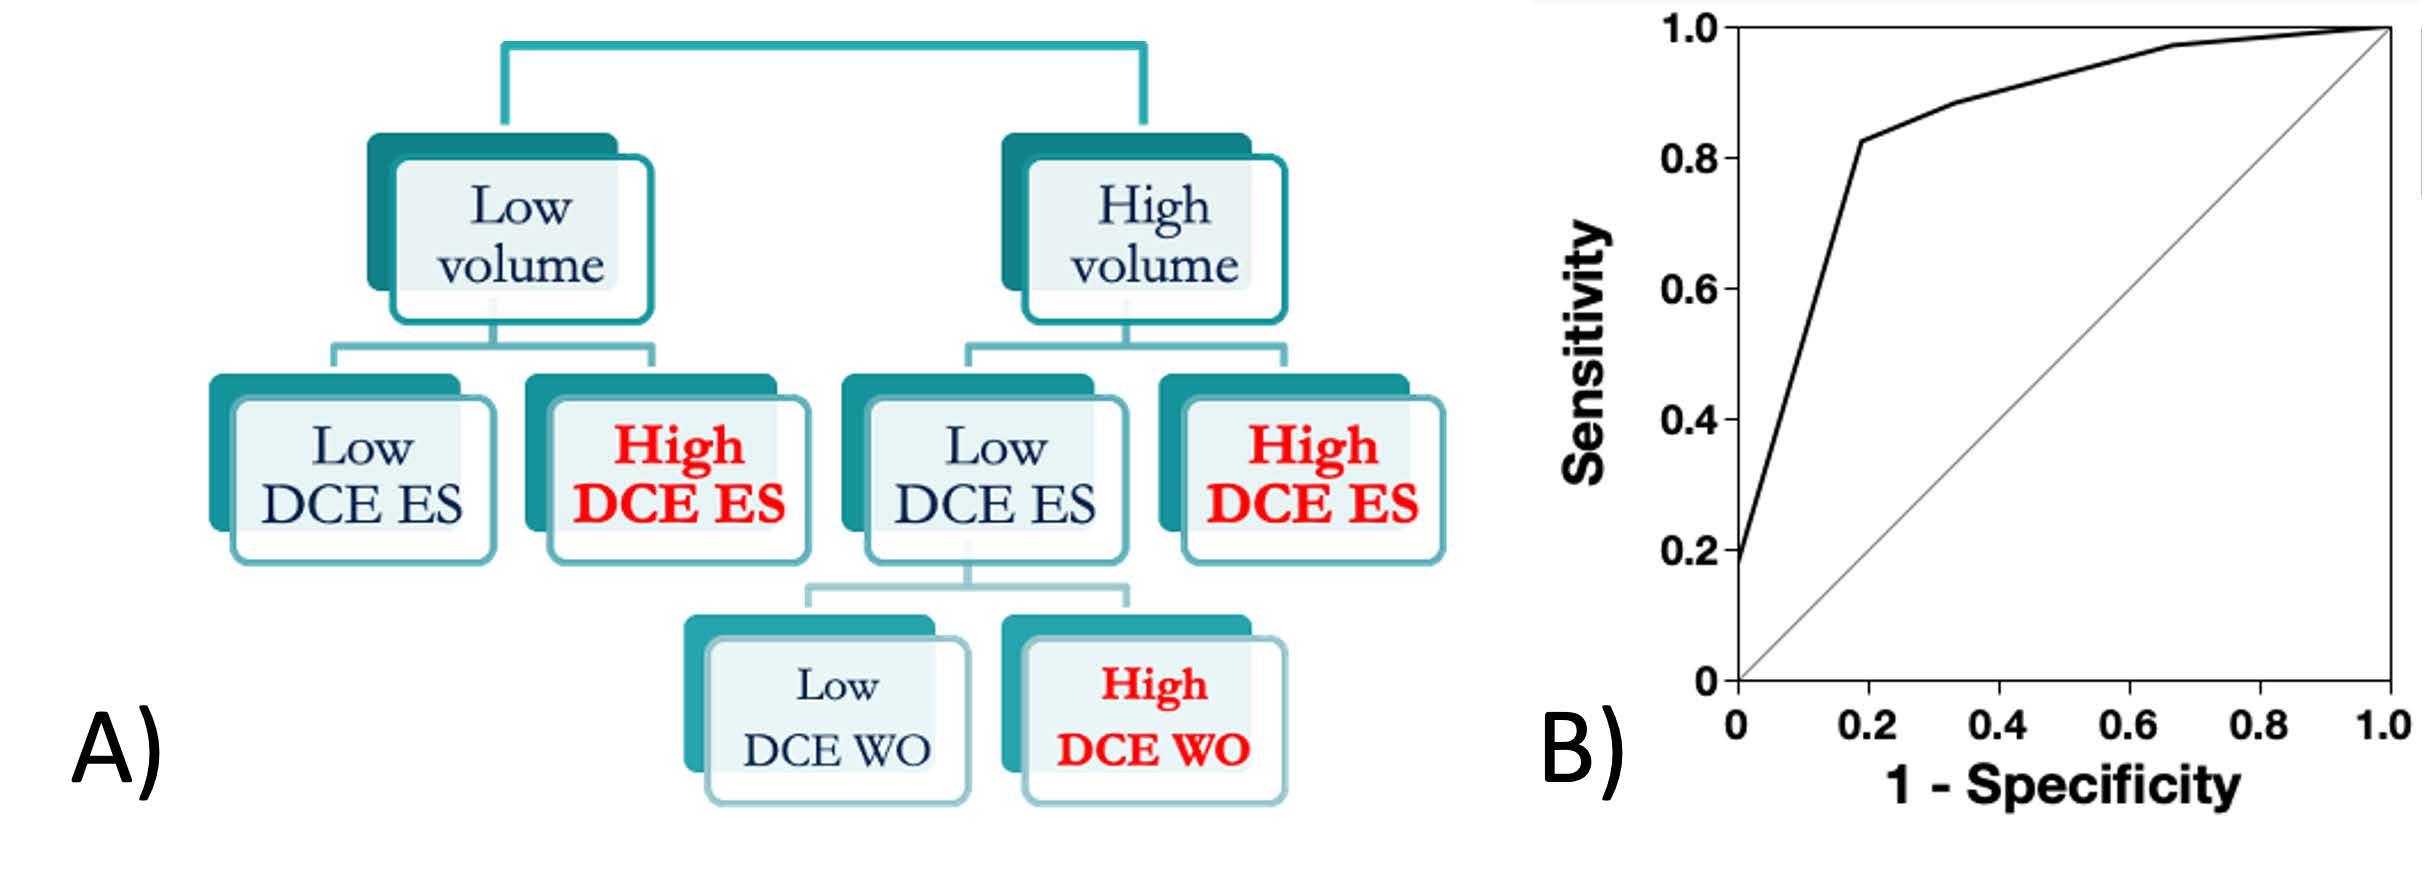
Results: A decision tree model for BCR was generated with sensitivity = 0.81, specificity = 0.82, and ROC AUC = 0.85. The prediction results indicate the potential of mpMRI and PCa risk maps to improve prediction of BCR after prostatectomy.
Impact: In this study we used preprostatectomy multiparametric MRI (mpMRI) cancer risk maps to analyze potential predictors of postsurgical prostate cancer (PCa) progression (Biochemical Recurrence (BCR) or treatment failure). A decision tree model was generated with ROC AUC 0.85.
Introduction
Biochemical recurrence (BCR) remains a significant concern for patients after radical prostatectomy with recurrence approximately 20 – 50% within 10 years after surgery [1]. Improvements in risk assessment would assist in tailoring clinical management. We have developed mpMRI PCa risk maps as a quantitative method to aid in detecting and quantifying PCa. The objective of this study was to assess the capability of MRI PCa risk maps to predict postsurgical biochemical recurrence in men who had radical prostatectomy.Methods
This was a retrospective study of PCa BCR for 78 patients who underwent RP between 2007 and 2014. CAPRA [2] clinical risk at diagnosis was 40% low (0-2), 46% intermediate (3-5), and 14% high (6-12). MRI cancer risk maps were generated from prior work [3][4]. For this study, cases (55) were included from this cohort and split into 2 categories: 1) evidence of progression within three years of surgery and 2) more than 3 years of clinical follow-up without evidence of progression. Patients were excluded if sufficient follow up was not available. Higher probability in the PCa maps reflect higher likelihood of cancer, or of aggressive cancer. The cancer risk maps and aggressive cancer risk maps were used to classify MRI voxels as cancer, or as aggressive cancer, respectively, from which PCa volumes and mpMRI mean characteristics within those volumes were calculated. The parameters evaluated for BCR included PCa volumes (total volume, volume of PCa connected to the prostate boundary, and aggressive PCa volume), DCE peak enhancement (PE), DCE enhancement slope (ES), DCE washout slope (WO), and ADC. The BCR and non-progression groups were compared by test of MRI parameters and PCa map metrics for statistical significance and reported as p-values. BCR was predicted through use of categorical decision trees. Capability of the models was assessed by receiver operating characteristic (ROC) area under the curve (AUC), sensitivity, and specificity.Results
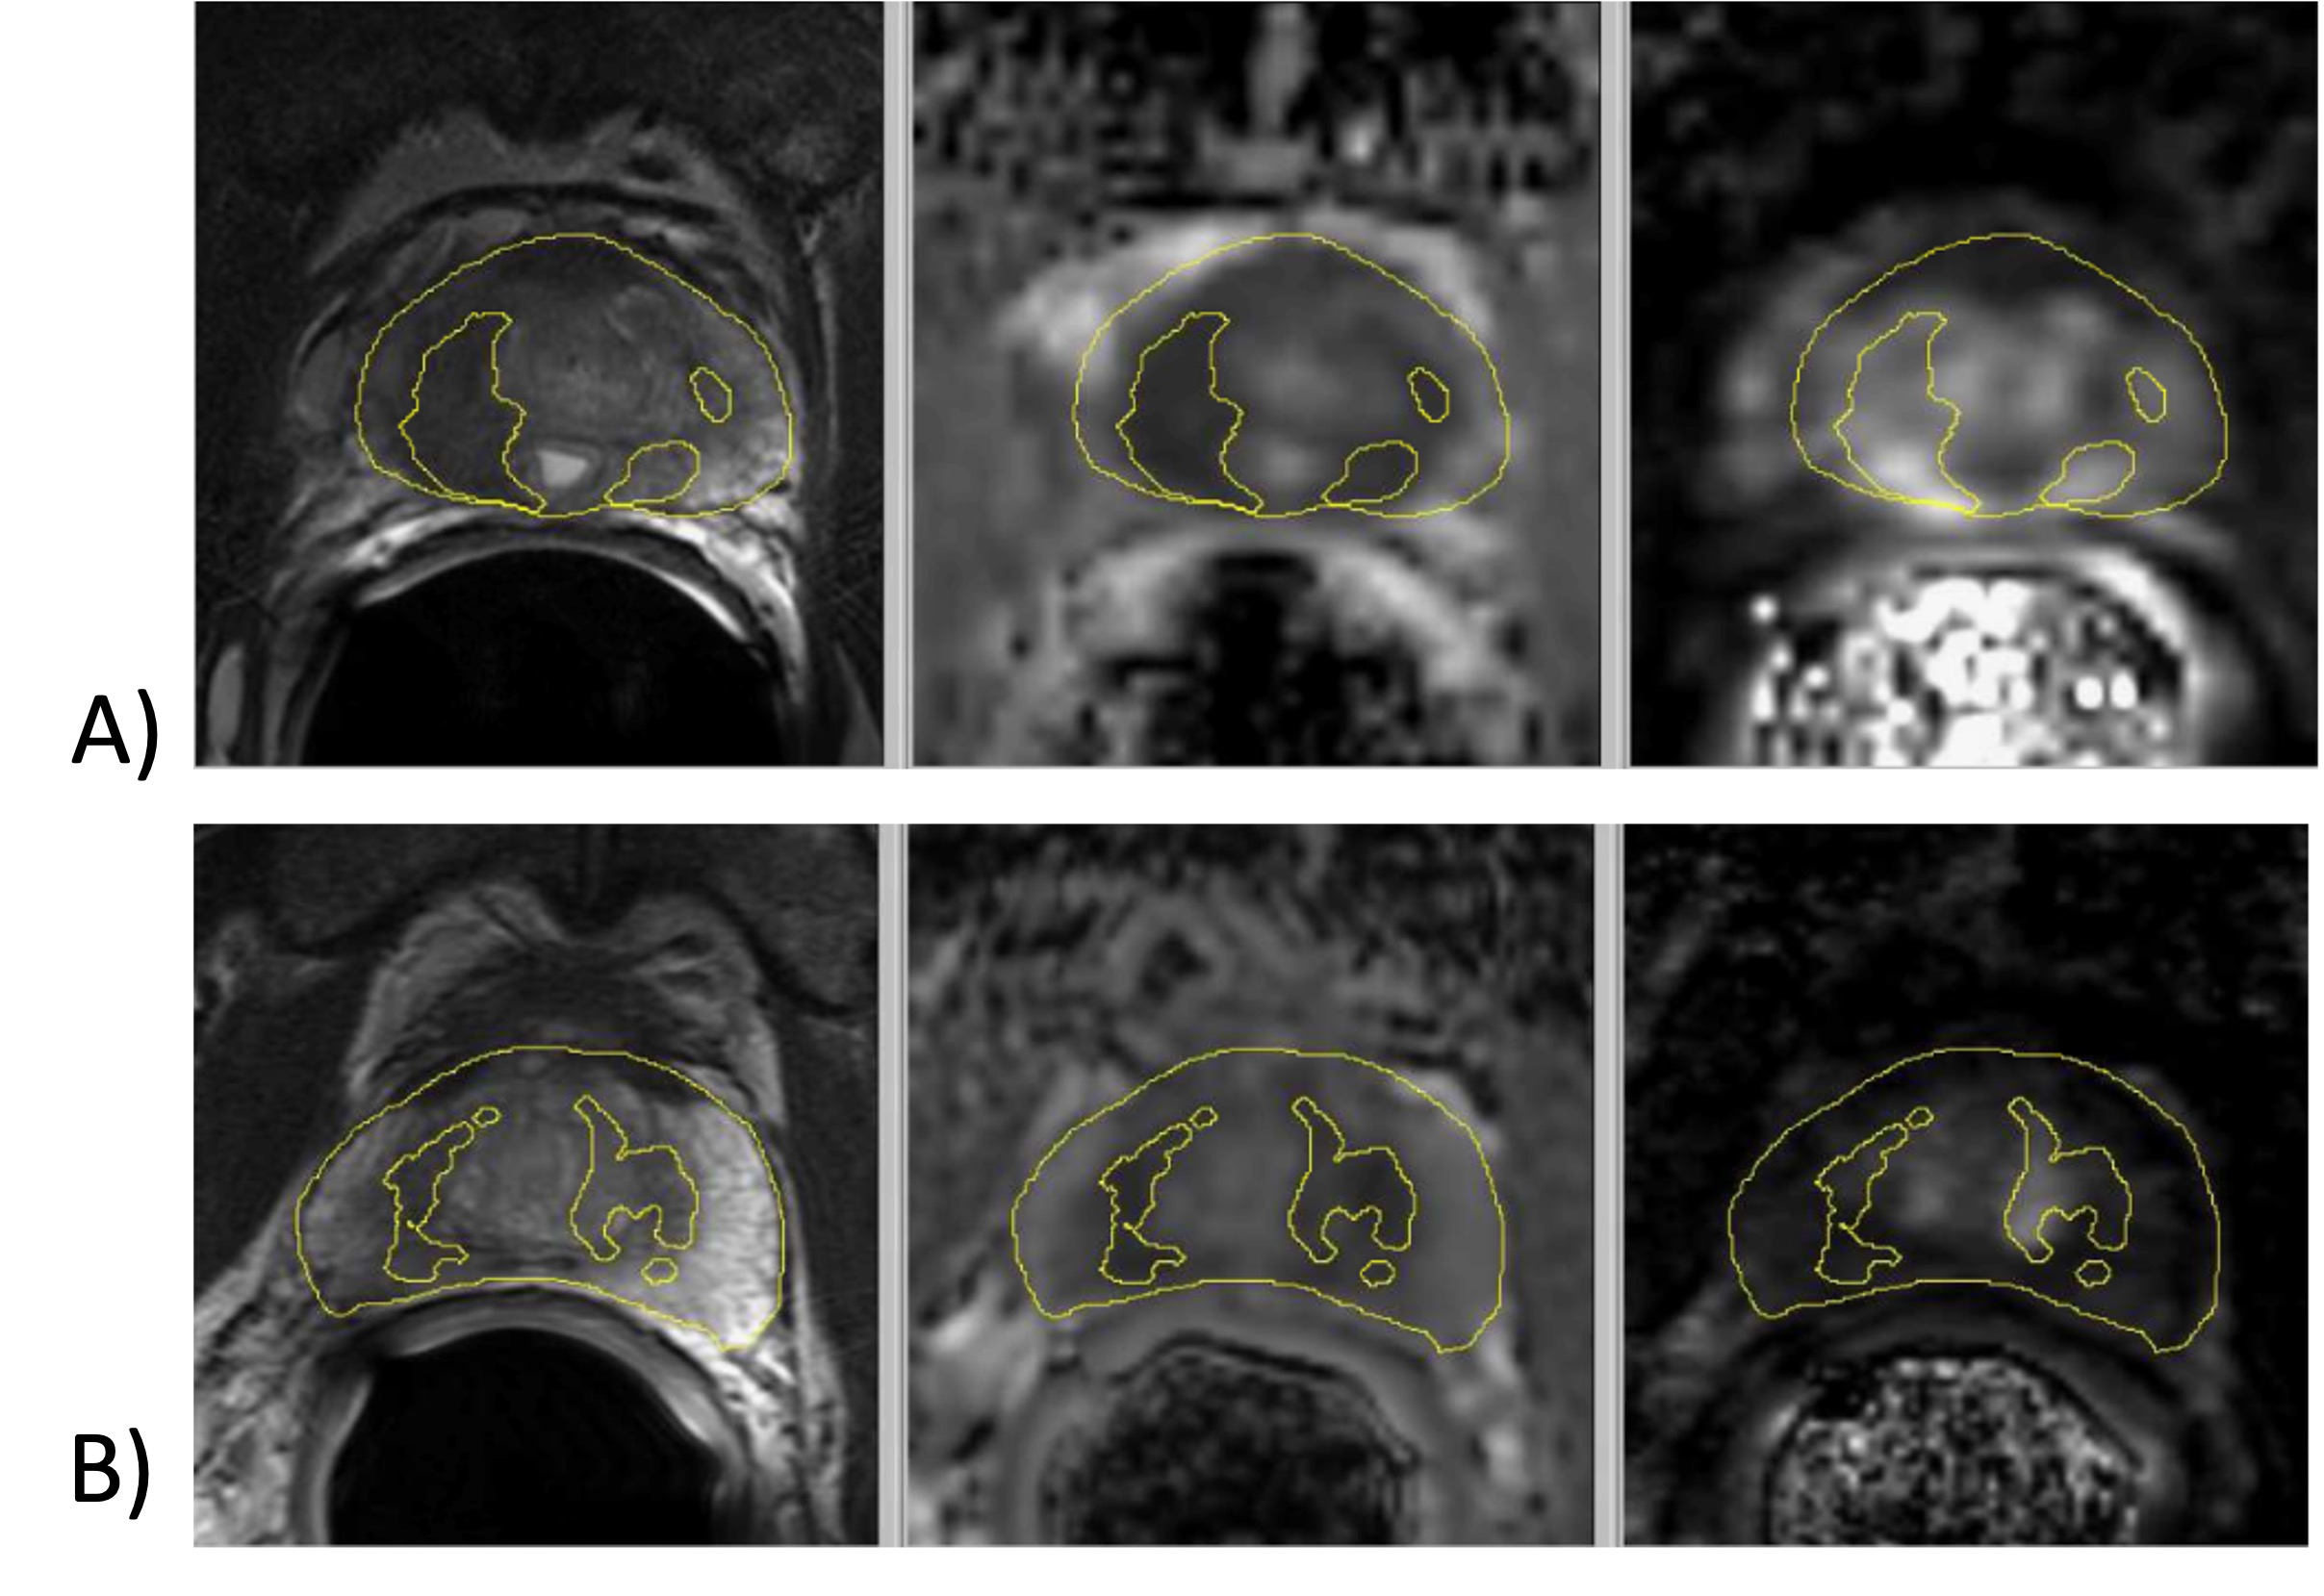
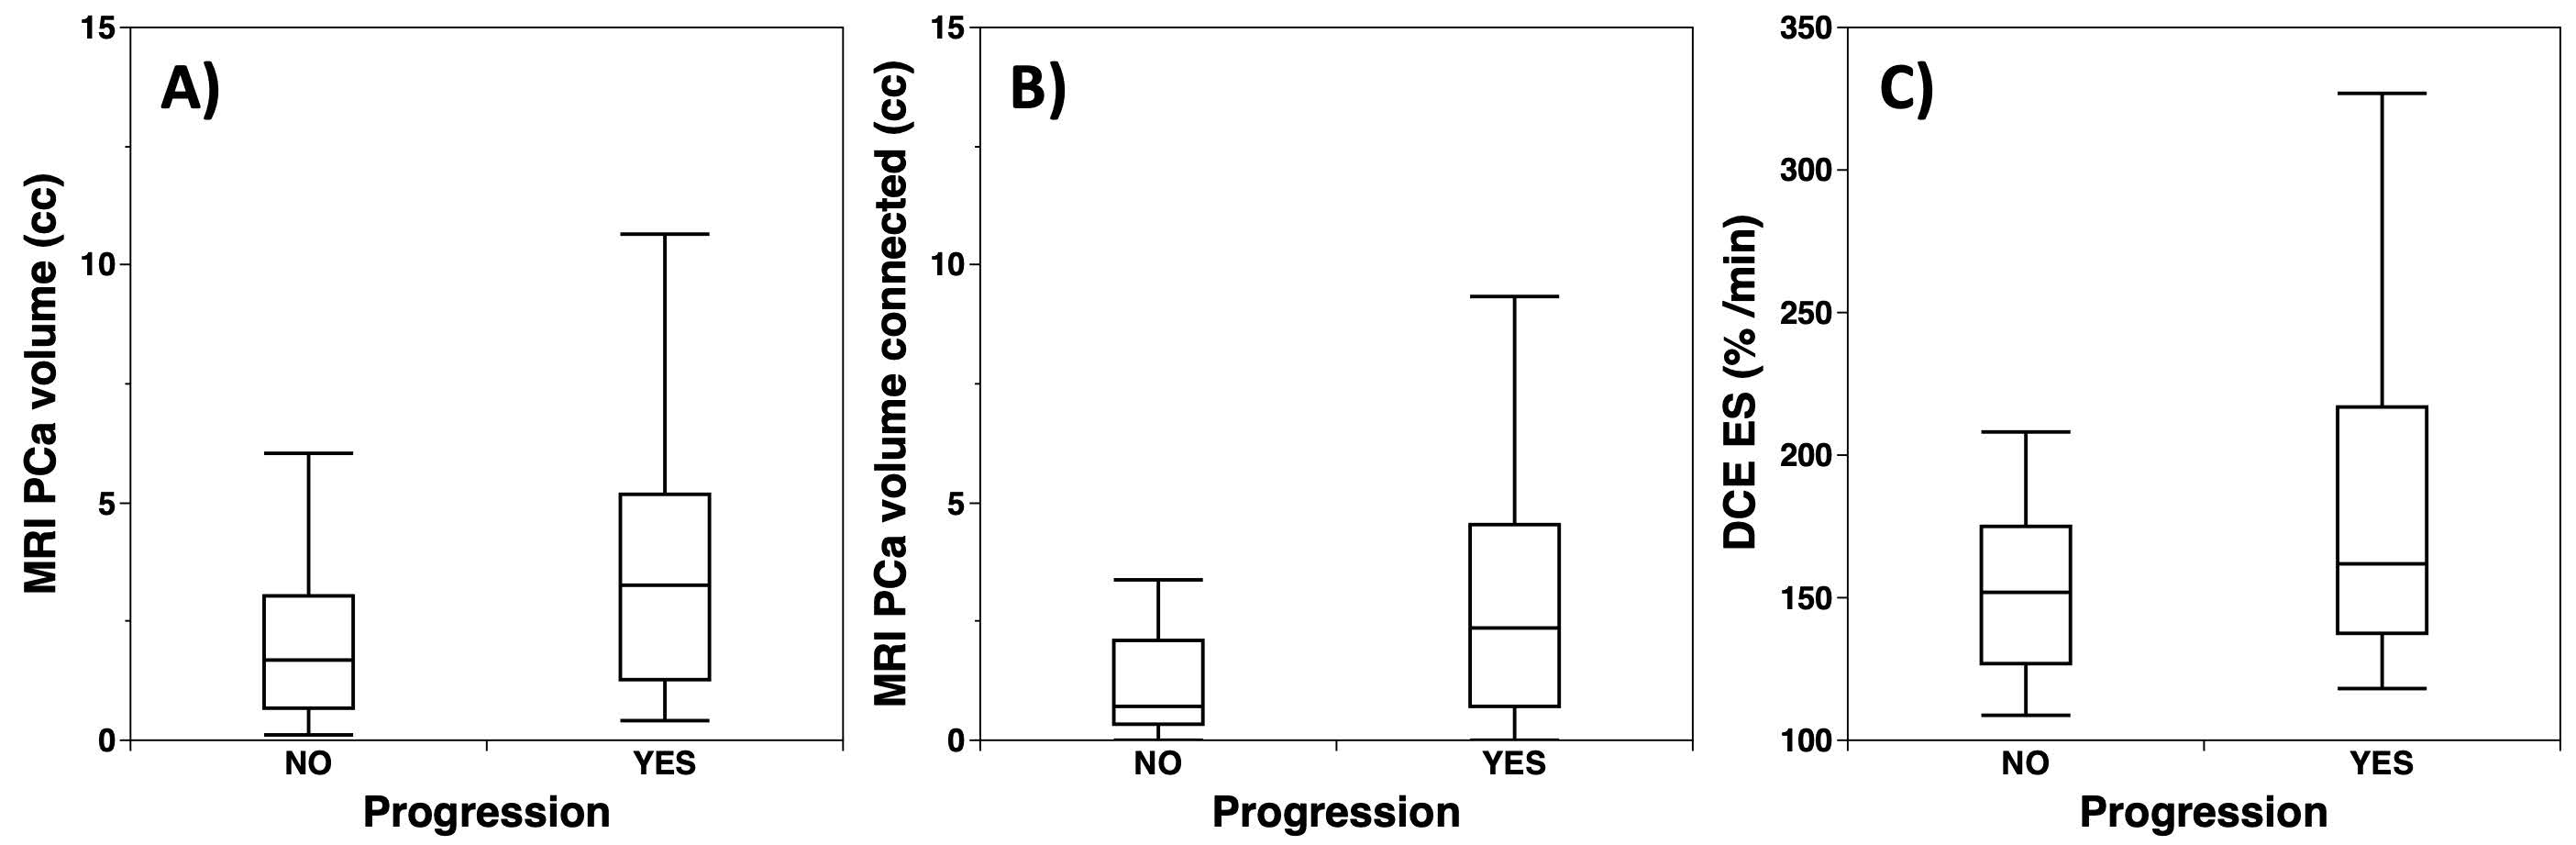
Figure 1 compares mpMRI images from a) BCR progression and b) non-progression cases. Superimposed on the T2W and ADC images are the PCa maps estimates of cancer lesions. Greater PCa volume in (a) is visible. Some scattered, small volumes exist which may be erroneous indications by the PCa maps model or other foci of cancer. BCR and non-BCR distributions are compared in Figure 2. The PCa volume parameters were defined as: 1) PCa volume = MRI cancer map volume within a prostate, 2) PCa connected volume = volume of PCa voxels connected to voxels which intersected the prostate boundary, and 3) PCa aggressive volume = volume of PCa voxels identified as high grade PCa. The BCR population exhibits larger PCa volumes and larger mean DCE enhancement slope (ES). DCE peak enhancement (PE) was the same between the groups. The parameters with statistically significant mean differences were PCa volume (p-value = 0.020), PCa connected volume (p-value = 0.010), PCa aggressive volume (p-value = 0.0085), and DCE ES (p-value = 0.015).A decision tree model was generated with sensitivity = 0.81, specificity = 0.82, and ROC AUC = 0.85 (Figure 3). The factors in the decision tree were higher PCa volume (higher for BCR), higher DCE-MRI enhancement slope (higher for BCR), and DCE-MRI washout (higher for BCR).
Discussion
The BCR prediction parameters identified here are consistent with both quantity and aggressiveness of cancer. The PCa volume characteristics not only indicate that larger volume is associated with BCR, but location near the prostate capsule or more high-grade volume are relevant. The DCE-MRI trends are also consistent with higher grade PCa as shown in prior work for development of the PCa models [3][4]. Note that ADC within the PCa volume was not determined to be a statistically significant factor. Since ADC is the main parameter determining PCa volume, its contribution was already applied through the volume metrics.In the decision tree model, BCR was identified with a combination of factors not all of which exhibited statistical significance in univariate analysis. However, in concert with other factors DCE WO became statistically significant in multivariate analysis. Errors in the PCa map results [3], which may be due to image artifacts, alignment errors, or biological differences, impact the capability of the prediction model. Despite these limitations, prediction of BCR using PCa risk maps appears feasible.
Conclusion
In addition to standard parameters, the PCa risk maps yield quantitative metrics such as estimates of PCa volume and aggressiveness. Our results indicate that use of these metrics improved predictive capability for post-surgical progression at the time of presurgical MRI. Thus, mpMRI and PCa risk maps have potential to assist PCa clinical management.Acknowledgements
Funding from California Tobacco-Related Disease Research Grant: 28IR-0060.References
[1] Tourinho-Barbosa R, et. al. Biochemical recurrence after radical prostatectomy: what does it mean? Int Braz J Urol. 2018 Jan-Feb; 44(1): 14–21. https://doi.org/10.1590/S1677-5538.IBJU.2016.0656.
[2] Cooperberg MR, Hilton JF, Carroll PR. The CAPRA-S score: A straightforward tool for improved prediction of outcomes after radical prostatectomy. Cancer. 2011 Nov 15;117(22):5039-46. doi: 10.1002/cncr.26169. Epub 2011 Jun 3. PMID: 21647869; PMCID: PMC3170662.
[3] Gibbons M, et. al. Identification of prostate cancer using multi-parametric MR imaging characteristics of prostate tissues referenced to whole mount histopathology, Magn Reson Imaging 2022; 85:251-261.
[4] Gibbons M, Simko JP, Carroll PR, Noworolski SM, Prostate cancer lesion detection, volume quantification and high-grade cancer differentiation using cancer risk maps derived from multiparametric MRI with histopathology as the reference standard, Magn Reson Imaging 2023; 99:48-57. https://doi.org/10.1016/j.mri.2023.01.006.
Figures