3595
Role of Gd-EOB-DTPA-enhanced MRI in Hepatic Fibrosis Staging: Insights from Hepatobiliary Phase Imaging1Zhujiang Hospital of Southern Medical University, Guangzhou, China, 2Shenzhen People's Hospital, The Second Clinical Medical College, Jinan University, Shenzhen, China, 3Philips Healthcare, Guangzhou, China
Synopsis
Keywords: Diagnosis/Prediction, Radiomics, hepatic fibrosis,Gd-EOB-DTPA,hepatobiliary phase
Motivation: Noninvasive assessment of hepatic fibrosis progression in individual patients.
Goal(s): To explore the value of signal intensity ratio (SIR) and radiomics analysis based on hepatobiliary phase (HBP) of Gd-EOB-DTPA-enhanced MRI in evaluating hepatic fibrosis staging.
Approach: The liver–muscle contrast ratio (LMCR) and liver–spleen contrast ratio (LSCR) were measured in HBP image, and the radiomics model and SIR–radiomics combined model were established. Finally, the diagnostic accuracy of SIR and both models in hepatic fibrosis staging were evaluated.
Results: The radiomics model exhibited higher diagnostic efficacy than SIR. The SIR–radiomics combined model demonstrated superior diagnostic performance in evaluating hepatic fibrosis staging .
Impact: This study constructed a noninvasive hepatic fibrosis diagnostic model using accessible routine sequence and improved the diagnostic efficiency. It offers a reliable approach for early diagnosis and treatment assessment, potentially reducing the need for unnecessary invasive biopsies in the future.
Introduction
Hepatic fibrosis is an inevitable stage in the progression of chronic liver disease to cirrhosis and even to liver cancer. Early aggressive treatment of hepatic fibrosis holds promise for its reversal1. Liver biopsy is currently the gold standard for diagnosing hepatic fibrosis, but its clinical application is limited due to its invasiveness2. Therefore, a noninvasive and accurate method is needed for diagnosing and staging hepatic fibrosis to assess the status of liver disease and provide an effective personalized treatment. Previous studies used liver–muscle contrast ratio (LMCR) and liver–spleen contrast ratio (LSCR) to evaluate the staging of hepatic fibrosis so as to diagnose mild and severe fibrosis3. Radiomics, which enables high-throughput extraction of image features, has been widely used in clinical research to mine vast amounts of otherwise visually inaccessible data4. Therefore, this study aimed to explore the value of signal intensity ratio (SIR) and radiomics analysis based on the hepatobiliary phase (HBP) imaging to assess the staging of hepatic fibrosis.Methods
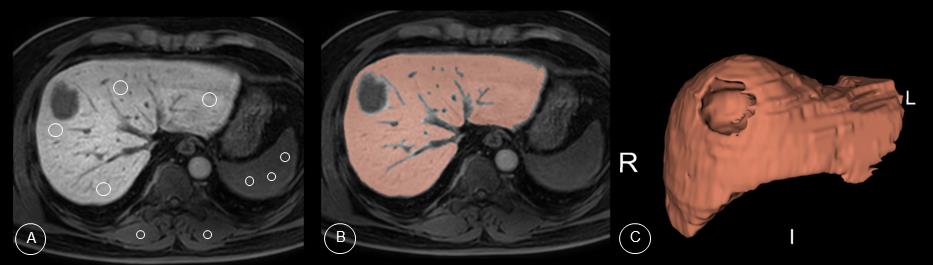
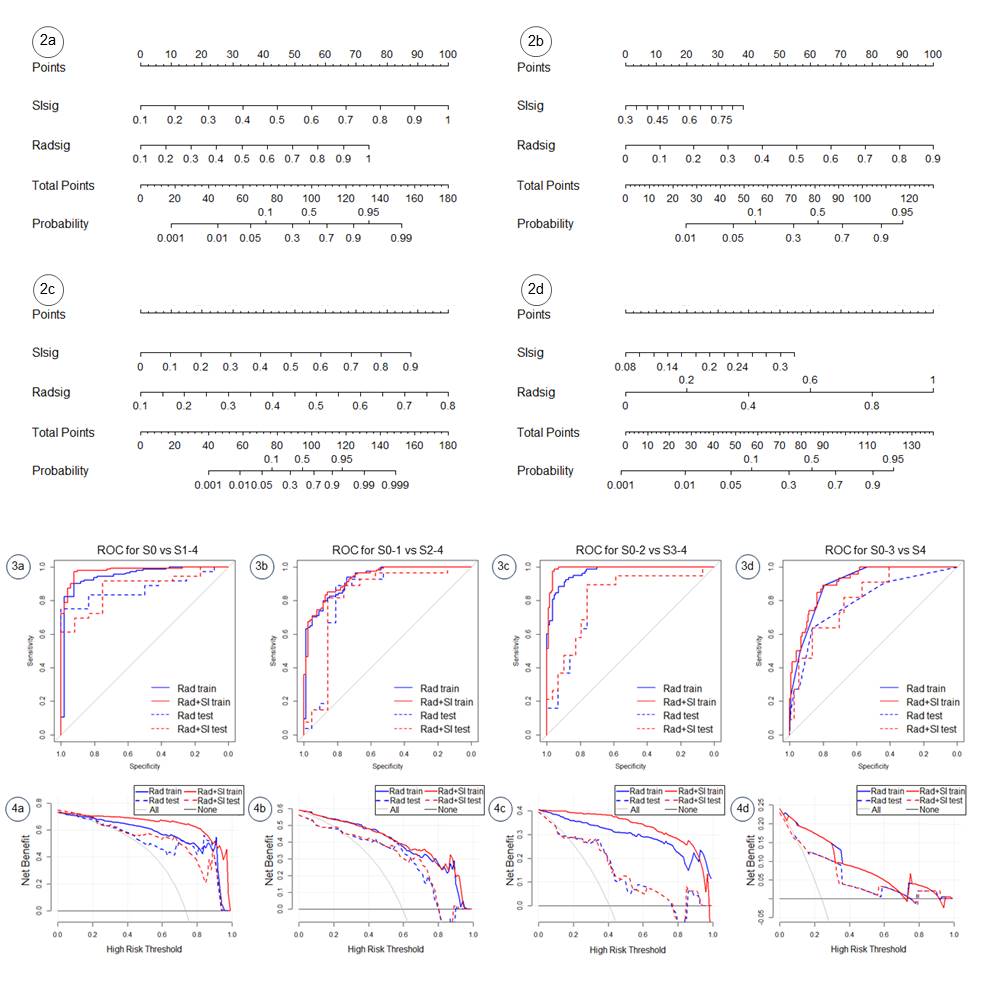
Data were retrospectively collected from 240 patients across 2 institutions (Zhujiang Hospital of Southern Medical University and Shenzhen People's Hospital) who underwent pathologic staging of hepatic fibrosis and Gd-EOB-DTPA-enhanced MRI. The Scheuer scoring system was used for hepatic fibrosis assessment. An experienced radiologist blinded to the pathologic classification drew a circular region of interest (ROI) of 1-3 cm2 in the HBP image at the level of the portal vein. The signal intensity (SI) of the liver, erector spinae muscles, and spleen were measured to obtain SIhep, SIspi, and SIspl, respectively. The LMCR and LSCR were calculated using the formulas SIhep/SIspi and SIhep/SIspl, respectively. Subsequently, the whole liver was manually outlined as ROI, avoiding liver blood vessels, bile ducts, artifacts, lesions, and liver edges (Fig. 1). Radiomics features were extracted from the ROIs, and feature selection was performed using t tests, Spearman’s correlation analysis, and Least Absolute Shrinkage and Selection Operator regression methods to construct the radiomics model and signature (Radsig). Machine learning models were established for SIR with statistical significance in univariate analysis, and the signal intensity signature (SIsig) was calculated. Finally, a multivariable logistic regression analysis was conducted using both Radsig and SIsig to construct the SIR–radiomics combined model. Receiver operating characteristic curves were used to evaluate the diagnostic performance of each model, and the area under the curve (AUC), sensitivity, specificity, and accuracy were calculated.Results
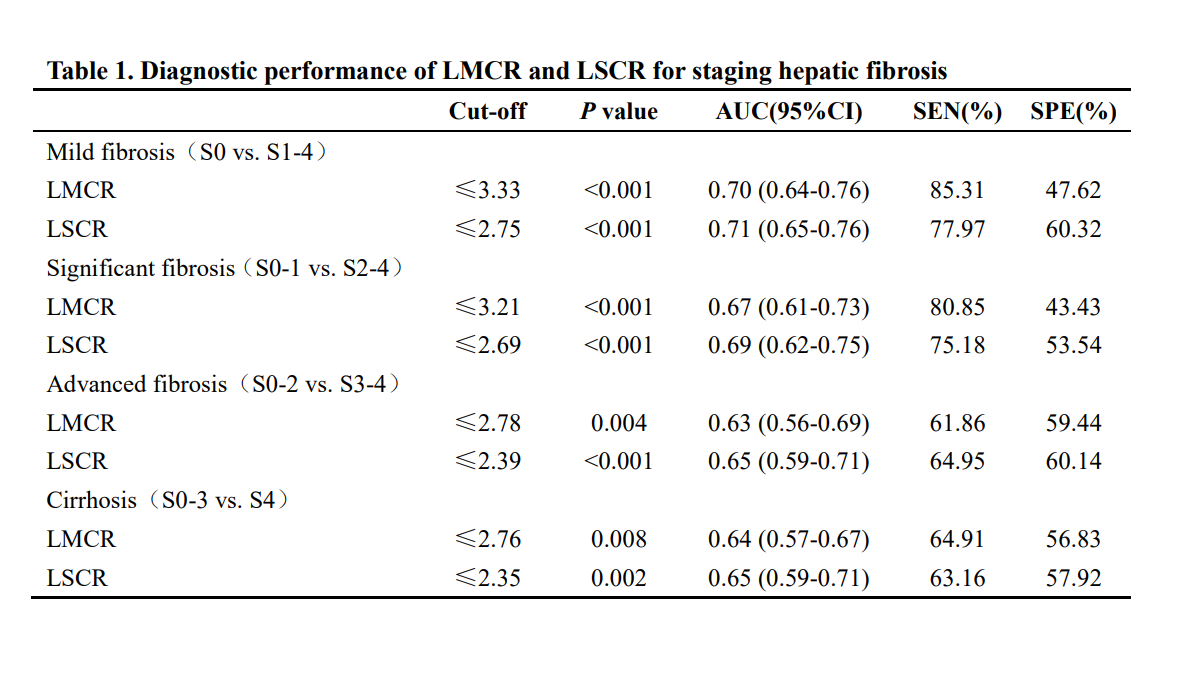
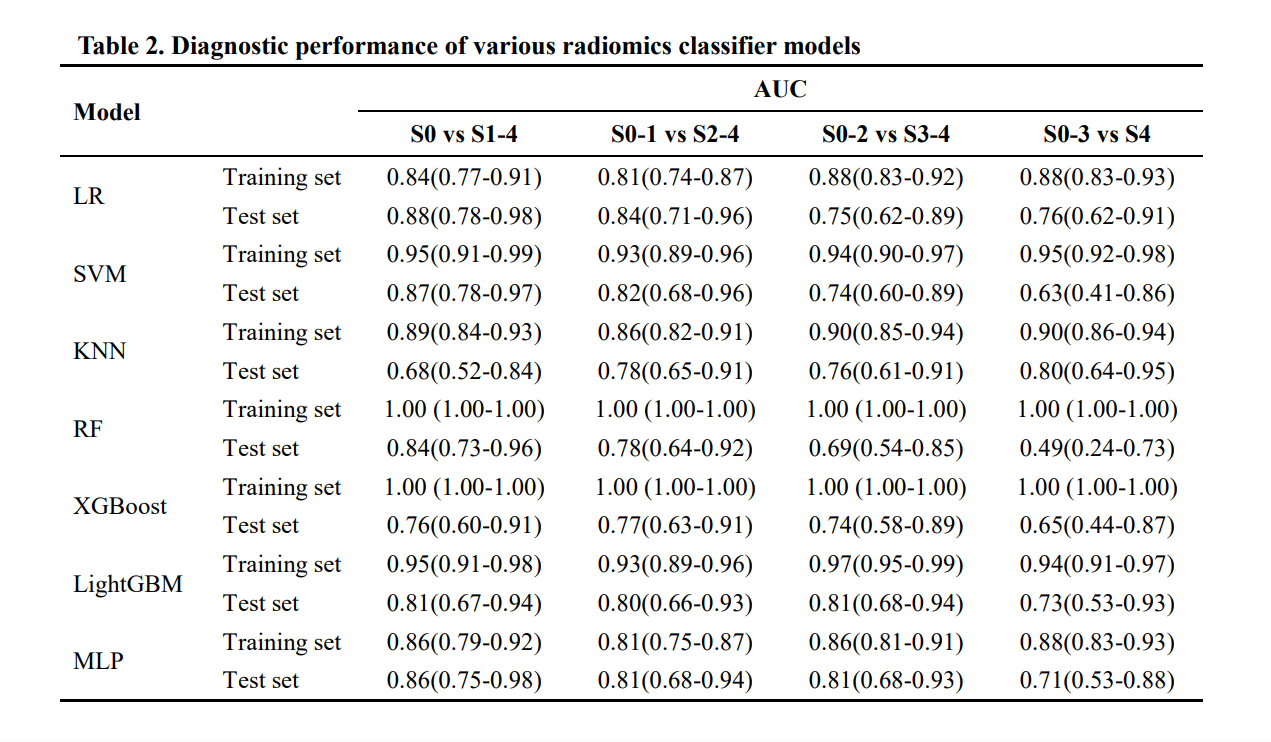
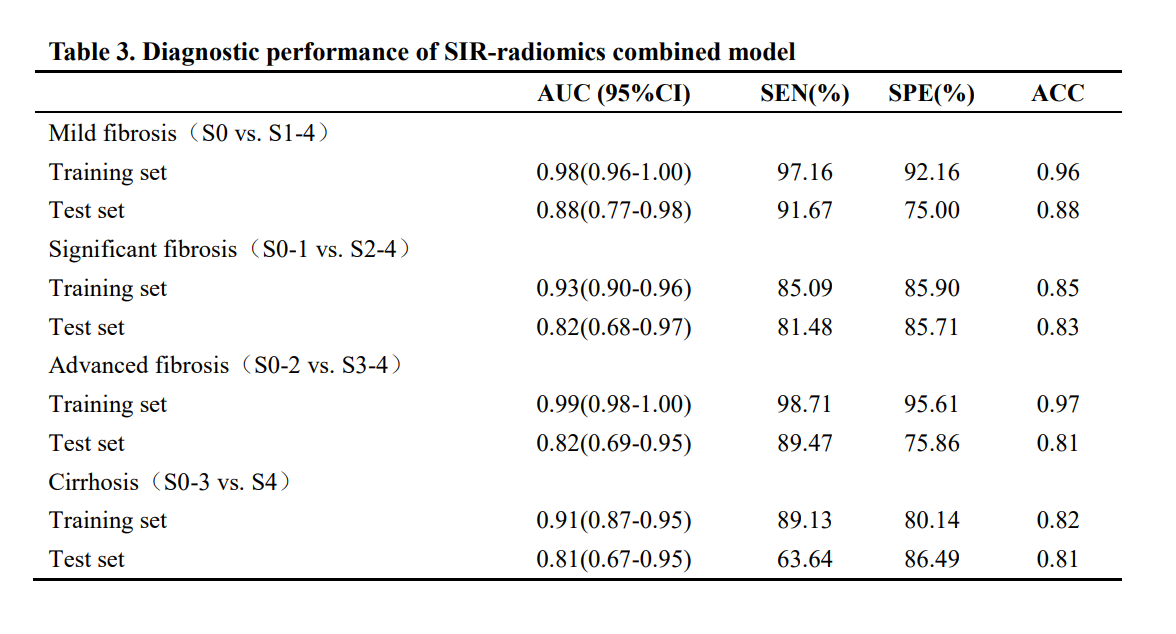
The AUC of LMCR and LSCR for diagnosing various stages of hepatic fibrosis was 0.63-0.70 and 0.65-0.71, respectively (Table 1). The radiomics model had an AUC of 0.90-0.97 for the training set and 0.80-0.87 for the test set (Table 2). Among these, the SVM model was the most effective in diagnosing mild hepatic fibrosis (≥S1 stage) and substantial hepatic fibrosis (≥S2 stage). The LightGBM model was the most effective in diagnosing advanced hepatic fibrosis (≥S3 stage), and the KNN model was the most effective in diagnosing cirrhosis (S4 stage). The SIR–radiomics combined model had an AUC of 0.91-0.99 for the training set and 0.81-0.88 for the test set, which showed higher diagnostic performance and remarkable clinical benefits (Table 3, Fig. 2).Discussion
The relative SI parameters and radiomics models can be used to diagnose hepatic fibrosis stages3,5,6. However, most previous studies focused on the diagnosis of substantial hepatic fibrosis (≥S2 stage) and more severe stages, emphasizing less on the presence or absence of mild fibrosis (≥S1 stage), or they only extracted and analyzed radiomics features based on local hepatic fibrosis areas. In this study, the S0 cases were included and the whole-liver ROI was used for feature extraction, providing sufficient data for model construction and reflecting the overall state of hepatic fibrosis in each stage. The diagnostic performance of the model was further improved by combining the SIR and radiomics features based on HBP imaging. Additionally, the results demonstrated that the SVM model had a certain advantage in diagnosing early-stage hepatic fibrosis, which was similar to previous findings on hepatic fibrosis based on the radiomics of nonenhanced T1 images7. However, with disease progression, the performance of the SVM model gradually decreased and the LightGBM and KNN models performed well in later stages, suggesting that the use of a single classifier model might introduce certain biases in the model establishment. Therefore, the accuracy and reliability of each classifier model should be further verified through clinical practice.Conclusion
The SIR–radiomics combined model exhibited a remarkable diagnostic value in hepatic fibrosis staging, demonstrating the prospect of future virtual biopsy of hepatic fibrosis.Acknowledgements
No Acknowledgement fundReferences
[1] Marcellin P, Gane E, Buti M, et al. Regression of cirrhosis during treatment with tenofovir disoproxil fumarate for chronic hepatitis B: a 5-year open-label follow-up study. Lancet. 2013;381(9865):468-475.[2] Thampanitchawong P, Piratvisuth T. Liver biopsy:complications and risk factors. World J Gastroenterol. 1999;5(4):301-304.
[3] Harada TL, Saito K, Araki Y, et al. Prediction of high-stage liver fibrosis using ADC value on diffusion-weighted imaging and quantitative enhancement ratio at the hepatobiliary phase of Gd-EOB-DTPA-enhanced MRI at 1.5 T. Acta Radiol. 2018;59(5):509-516.
[4] Gillies RJ, Kinahan PE, Hricak H. Radiomics: Images Are More than Pictures, They Are Data. Radiology. 2016;278(2):563-577.
[5] Zheng R, Shi C, Wang C, et al. Imaging-Based Staging of Hepatic Fibrosis in Patients with Hepatitis B: A Dynamic Radiomics Model Based on Gd-EOB-DTPA-Enhanced MRI. Biomolecules. 2021;11(2):307.
[6] Wei H, Shao Z, Fu F, et al. Value of multimodal MRI radiomics and machine learning in predicting staging liver fibrosis and grading inflammatory activity. Br J Radiol. 2023;96(1141):20220512.
[7] Ni M, Wang L, Yu H, et al. Radiomics Approaches for Predicting Liver Fibrosis With Nonenhanced T1 -Weighted Imaging: Comparison of Different Radiomics Models. J Magn Reson Imaging. 2021;53(4):1080-1089.
Figures