3592
Multiparametric analysis of early treatment changes in glioma after receiving radiation therapy1University of California San Francisco, San Francisco, CA, United States
Synopsis
Keywords: Tumors (Post-Treatment), Cancer
Motivation: Understanding how MR imaging markers change in normal appearing brain tissue over the course of RT for different dose distributions could help shed light on which parts of the brain are more susceptible to RT.
Goal(s): To examine early changes in perfusion, diffusion, and MR spectroscopic imaging metrics in normal and tumor regions during and following RT for different dose regions.
Approach: Twelve patients were studied at before, in the middle of, and after the completion of RT.
Results: Significant imaging differences in diffusion, perfusion, and NAA/creatine was found in the normal appearing white matter in different dosage maps after receiving RT.
Impact: Our study has shown initial alterations in the normal-appearing brain after radiation therapy. We have detected these changes in the early stages.
Introduction
Standard-of-care for patients with glioblastoma and recurrent astrocytomas includes maximal safe surgical resection, followed by external beam RT (RT) and temozolomide (TMZ). Despite significant advances in RT delivery that provide millimeter-scale precision and dose modulation capabilities, irradiation to normal-appearing brain tissue (NABT) still occurs and has been associated with both diminished quality of life and poorer overall survival (OS) for patients with GBM [1]. Understanding how MR imaging markers change in NABT over the course of RT for different dose distributions could help shed light on which parts of the brain are more susceptible to RT. This study aims to examine early changes in perfusion, diffusion, and 1H MR spectroscopic imaging (MRSI) metrics in NABT and tumor regions during and following RT for different dose regions.Methods
Patients & Study Design: A total of 12 patients, including 8 with glioblastoma, 3 with astrocytoma, and 1 with oligodendroglioma, aged 49±14 years (4 females and 8 males), who had undergone prior surgical resection but no other treatment were prospectively recruited and studied at three different time points: pre-RT (within 1 week of beginning RT), mid-RT (~4 weeks into RT), and immediately post-RT (~8 weeks from start of RT).Image Acquisition: 28 total 3T MRI exams were obtained (Pre-RT, N=12; Mid-RT, N=6; Post-RT, N=10) using either a 32-channel or 8-channel 1H receive coil. The protocol included standard anatomical T2, T2-FLAIR, and pre-/post-contrast T1-weighted imaging; Dynamic Susceptibility Contrast (DSC) perfusion-weighted imaging (TE/TR/flip angle=25ms/1500ms/35degrees); diffusion-weighted imaging (24 directions, b=1000s/mm2); and lactate-edited MRSI (PRESS volume localization, CHESS/VSS water/lipid suppression, flyback-echo-planar readout, TR=1100-1250ms, TE=144ms, overpress-factor=1.5, nominal voxel-size=1cc, 988Hz sweep-width, and 712 dwell-points) [2].
Image and Dosemap Analysis: Anatomical, DWI, and perfusion data were processed to generate maps of ADC, PH and % recovery, aligned to the T1-post-contrast image at each time point, and normalized to the mode of intensities in NABT using in house software. N-acetyl-asptate/creatine (NAA/Cr) was quantified from the MRSI data after standard processing [3-4]. The skull stripped CT image from RT planning was aligned to the skull-stripped post-contrast T1 at each of the 3 time points and the alignment transformations applied to the dose map files after conversion from DicomRT structure to dicom image files with Plastimatch software. Mean intensities of each parametric map were extracted from 5 regions of interest (ROIs), including normal-appearing white-matter (NAWM), contrast enhancing lesion (CEL), non-enhancing T2-hyperintense lesion (NEL), and 3 dose map categories: low (<20Gy; RDlow), middle (20-50Gy; RDmid) and high (>50Gy; RDhigh) dose.
Results
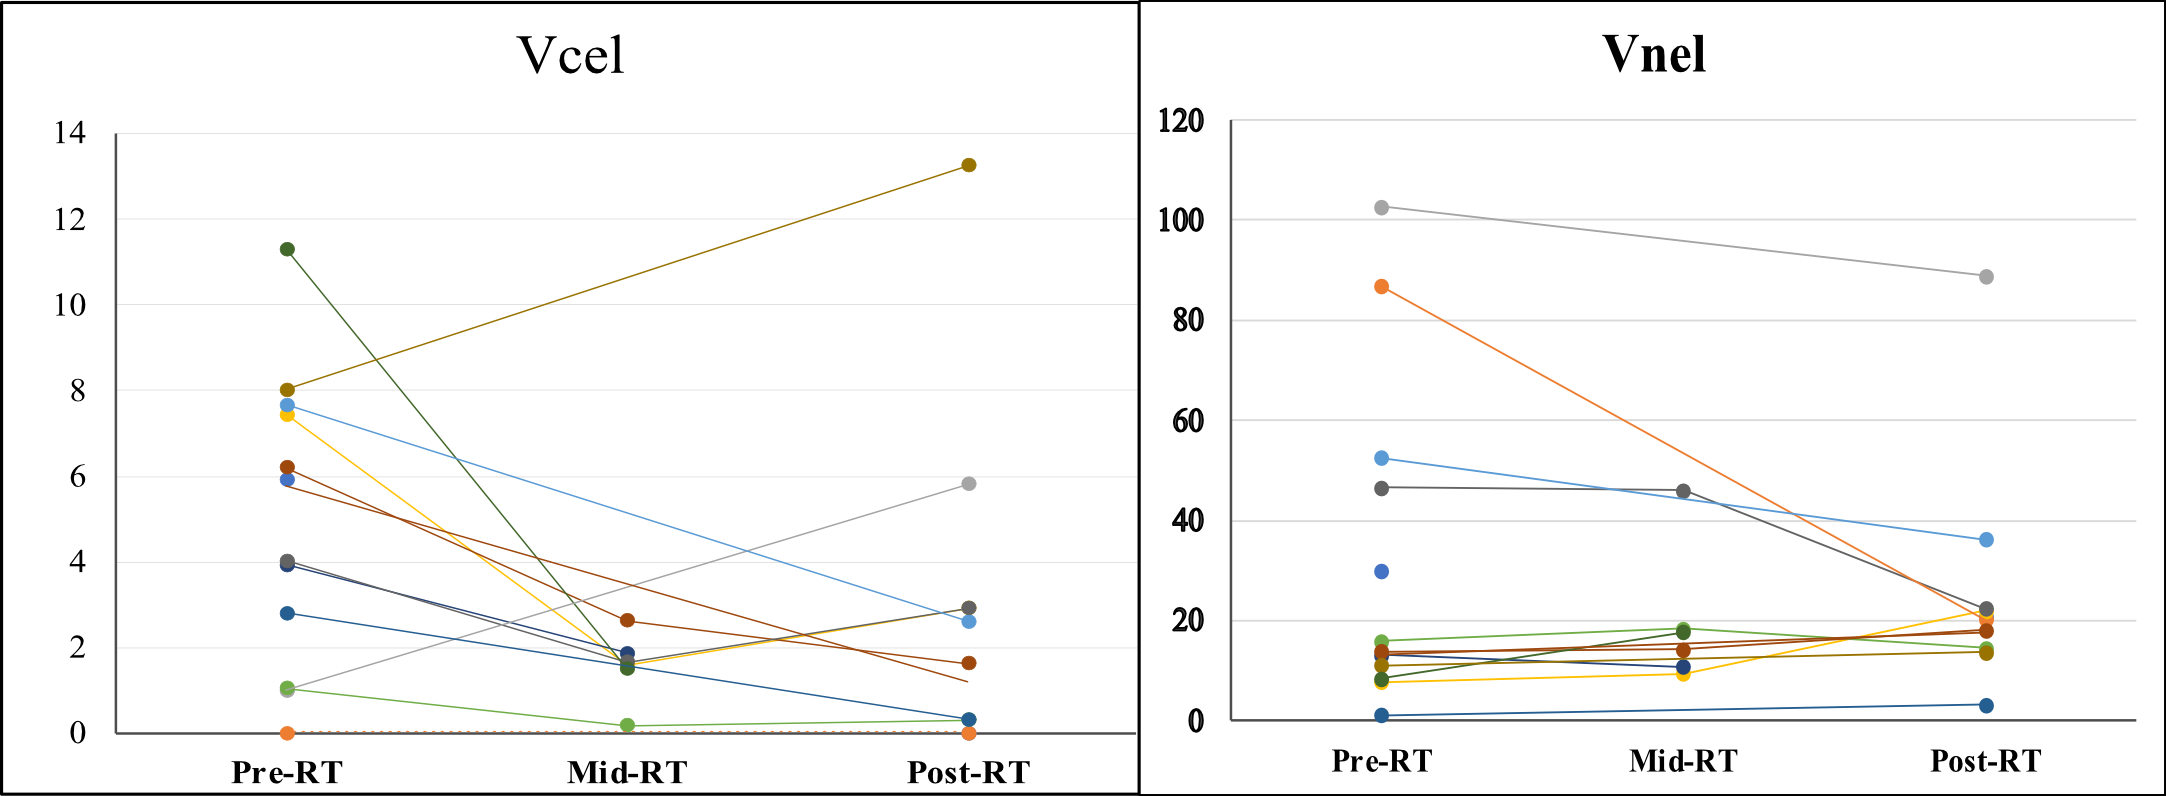
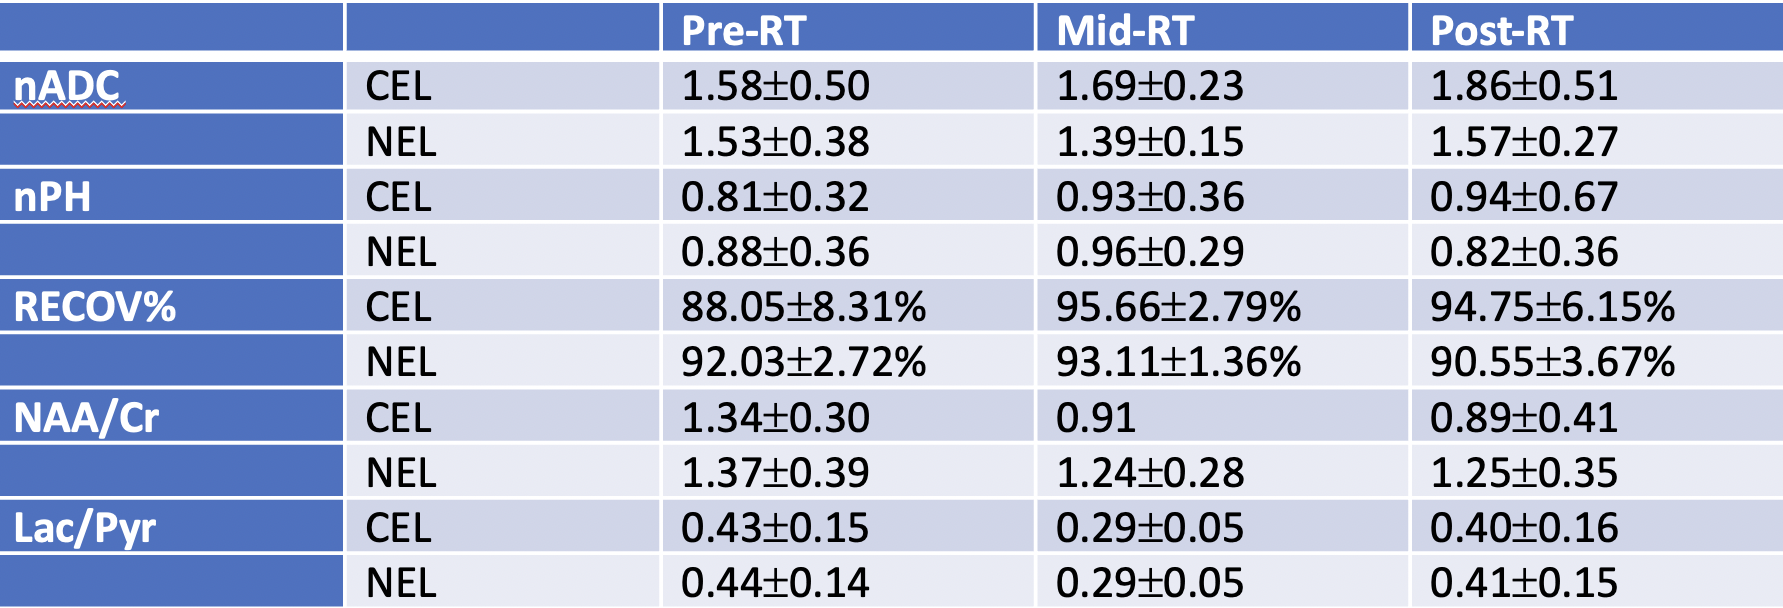
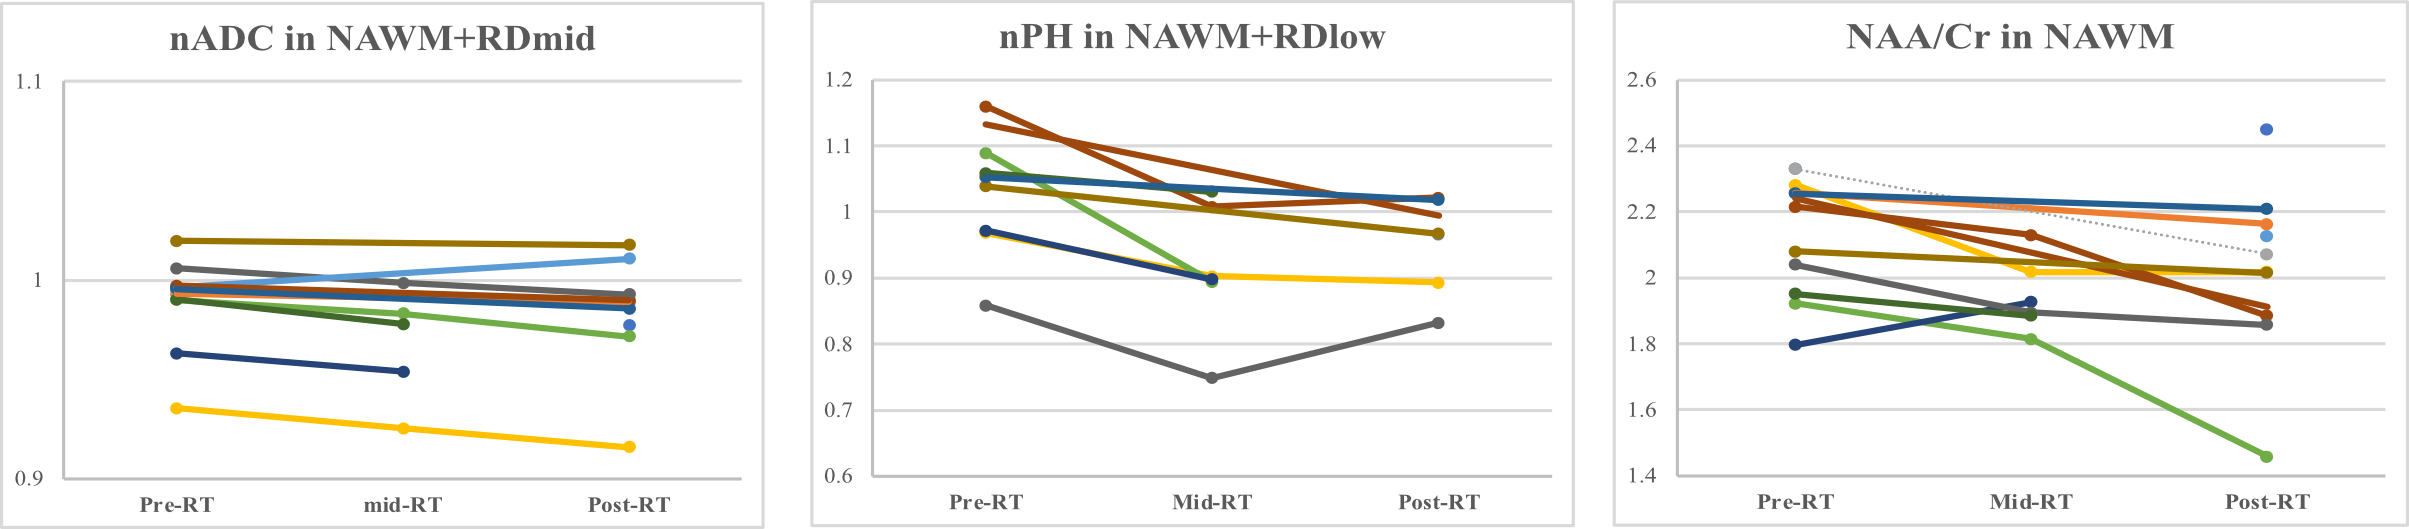
Before RT, CEL volumes ranged from 0-11.302cc, whereas the NEL volume was approximately equal to 1.086-102.597cc. During RT, CEL volumes were significantly reduced by 69% before increasing by 279% at post-RT. On the other hand, the NEL volume increased by 9% mid-RT and decreased by 630% post-RT (Figure 1). Figure 2 presents the imaging parameters of the lesion ROI before, during, and after RT. The only noteworthy difference between pre-RT and post-RT was an increasing trend in nADC in the NEL. Significant imaging differences were also found in the NAWM in different dosage regions after receiving RT. Specifically, in the NAWM+RDmid, the nADC was 0.99±0.02, 0.97±0.03, and 0.98±0.03 at the pre-RT, mid-RT, and post-RT, respectively (p=0.048 for pre-RT vs. mid-RT; p=0.049 for pre-RT vs. post-RT) (Figure 3a). The NAWM+RDlow region demonstrated significant changes in nPH: 1.02±0.09, 0.91±0.1 (p=0.036 for pre-RT vs. mid-RT), and 0.95±0.08 (p>0.05 for pre-RT vs. post-RT) (Figure 3b). NAA/Cr was significantly reduced in the overall NAWM within the spectral excitation (Figure 3c), regardless of dose.Discussion
This study used a multimodal protocol to demonstrate changes in patients after receiving radiation therapy. The results showed an increase in nADC within the anatomic lesions, but no changes in perfusion parameters were observed. This could be due to the small sample size and relatively small lesion size in the patient cohort after surgery. It has been reported that RT can affect cerebral vasculature and white matter tracts. As expected, there was a trend of reducing nADC and nPH in the NAWM during RT. Interestingly, there was also a significant reduction in NAA/creatine levels, a marker of healthy neuronal function in the overall NAWM. These preliminary results warrant validation in a larger cohort.Acknowledgements
Acknowledgment: NIH P50 CA097257, P01 CA118816, and W81XWH-21-1-0412.References
[1] Lawrence YR, Wang M, Dicker AP, et al. Early toxicity predicts long-term survival in high-grade glioma. British Journal of Cancer. 2011;104(9):1365-1371.
[2] Park I, Chen AP, Ziehurt, et al. Implementation of 3T lactate-edited 3D 1H MR spectroscopic imaging with flyback echo-planar readout for glioma patients. Ann Biomed Eng. 2011;39:193 – 204.
[3] Li Y, Lupo JM, Polley MY, et al. Serial analysis of imaging parameters in patients with newly diagnosed glioblastoma multiforme. Neuro-Oncolgoy; 2011.13(5):546-557.
[4]Li Y, Lupo JM, Parvataneni R, et al. Survival analysis in patients with newly diagnosed glioblastoma using pre- and postradiotherapy MR spectroscopic imaging. Neuro-Oncology; 2013. 15(5). 607-617.
Figures