3591
A fast, vendor-neutral protocol for multi-center, multi-parametric quantitative MRI studies in brain tumor patients1Institute of Neuroradiology, Goethe University Frankfurt, University Hospital Frankfurt, Frankfurt, Germany, 2University Cancer Center Frankfurt (UCT), Frankfurt am Main, Germany, 3Frankfurt Cancer Institute (FCI), Frankfurt am Main, Germany, 4German Cancer Research Center (DKFZ) Heidelberg and German Cancer Consortium (DKTK), Heidelberg, Germany, 5Brain Imaging Center, Frankfurt, Germany, 6Department of Neurology, Medical University of Graz, Graz, Austria, 7German Center for Neurodegenerative Diseases (DZNE), Bonn, Germany
Synopsis
Keywords: Tumors (Pre-Treatment), Quantitative Imaging, Multi-parametric Quantitative MRI
Motivation: Multi-centric multi-parametric quantitative MRI (mp-qMRI) studies require short and vendor-neutral protocols.
Goal(s): The goal was to develop and validate an 8-minute, vendor-neutral protocol for multi-center mp-qMRI studies on brain tumor patients at 3T.
Approach: 5 Volunteers were measured at two scanners. Application of the proposed method was demonstrated for one brain metastasis patient, where artefact free qMRI maps were obtained.
Results: qMRI maps (T1, T2*, PD and QSM) obtained from 5 volunteers on two scanners showed a very good reproducibility. Among the parameters, PD yielded the lowest COV. Artefact free qMRI maps are demonstrated in a brain metastasis patient.
Impact: We propose an 8-minute, vendor-neutral mp-qMRI protocol for 3T studies in brain tumor patients. T1, T2*, PD and QSM maps are demonstrated in 5 healthy volunteers and one brain metastsis patient. Multi-centric qMRI studies could use this fast mp-qMRI protocol.
Introduction
Multi-parametric quantitative MRI (mp-qMRI) provides non-invasive, quantitative measurements sensitive to a variety of human brain tissue properties1–5. Simultaneous measurement of parameters like Longitudinal relaxation time (T1), Effective transverse relaxation time (T2*), Transverse relaxation time (T2), Proton density (PD) and susceptibility (Quantitative susceptibility maps; QSM) may give valuable insights into the microenvironment of brain tumors. For example, PD maps yield the water content in solid tumors, their perifocal edemas and, where applicable such as in glioma, infiltration zones6–9.For large, multi-center studies, the protocol should be vendor-neutral and short to be combined with routine imaging. Here, we describe the development and validation of an 8-minute, vendor-neutral, 3T protocol for multi-center mp-qMRI studies in brain tumor patients. We followed an optimized 7T approach by Olsson et al10 and adapted it for 3T systems across different MRI models and vendors, using release sequences.Methods
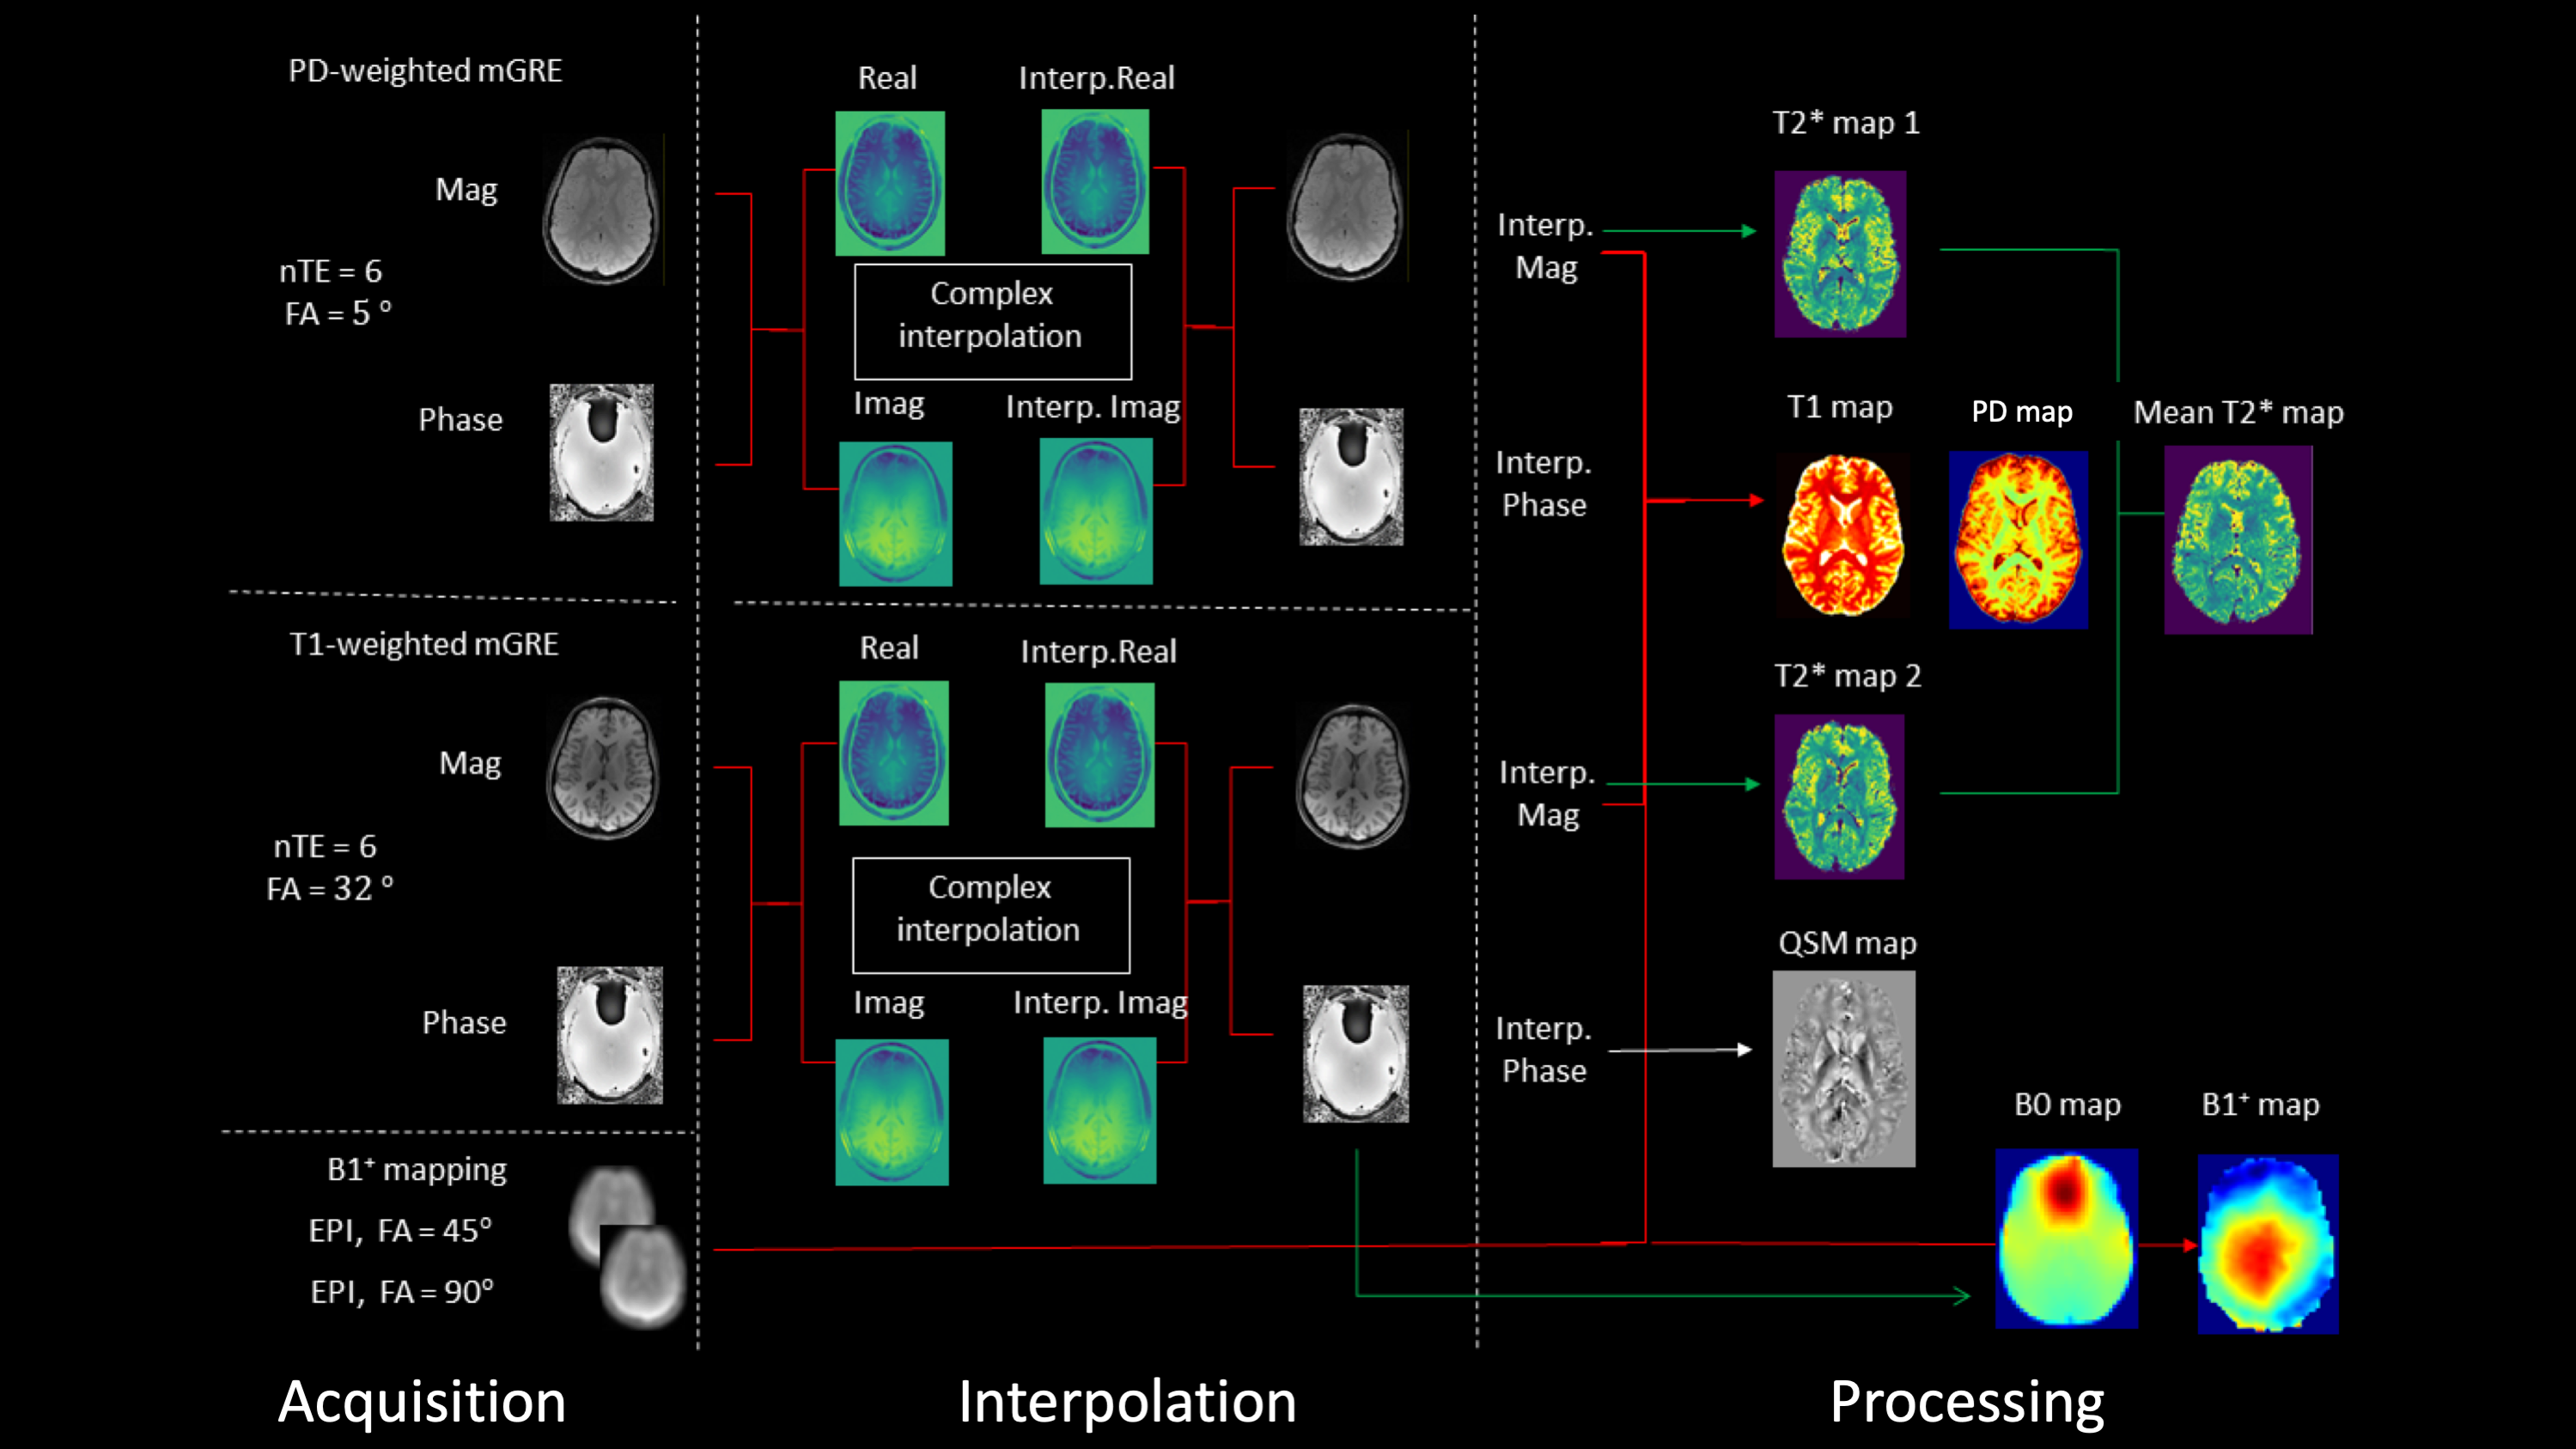
The final mp-qMRI protocol includes two mGRE datasets (M0-weighted, T1-weighted) acquired with the parameters: 3D acquisition, non-selective excitation, FOV = (256mm)2, Matrix = 192x192, TR = 30ms, nTE = 6, TE1= 3.20ms, TE = 4.50ms, BW = 350 Hz/Px, in-plane resolution = (1.2mm)2, phase resolution = 75%, 144 sagittal slices (thickness 1.2mm), FA = / (M0w/T1w), TA = 3:29min per mGRE acquisition. For B1 mapping, an accelerated version of the vendor-based B1 mapping protocol described by Nöth et al11 was used, acquiring two multi-slice, fat suppressed EPI images with the parameters: FOV = (256mm)2, Matrix = 64x64, TR/TE= 20s/21ms, interleaved acquisition of 40 slices (2mm thickness, 2mm gap), FA = /, BW = 2298 Hz/Px, echo spacing = 500, TA = 20sec per acquisition. The acquistion and processing pipeline is detailed in Figure 1.The study was approved by the institutional review board and written consent was obtained all participants. Measurements were performed on two whole-body 3T MR scanners (Prisma and Skyra, version VE11C, Siemens Healthineers, Erlangen, Germany). Additionally, one brain metastasis patient was scanned on the Skyra. Body coils were used for RF transmission and a 20-channel head/neck receive coil for signal reception. qMRI maps from both scanners were compared via paired t-tests for the mean parameter values across white and gray matter (WM; GM) and calculation of the inter-map coefficient of variance (COV).Results
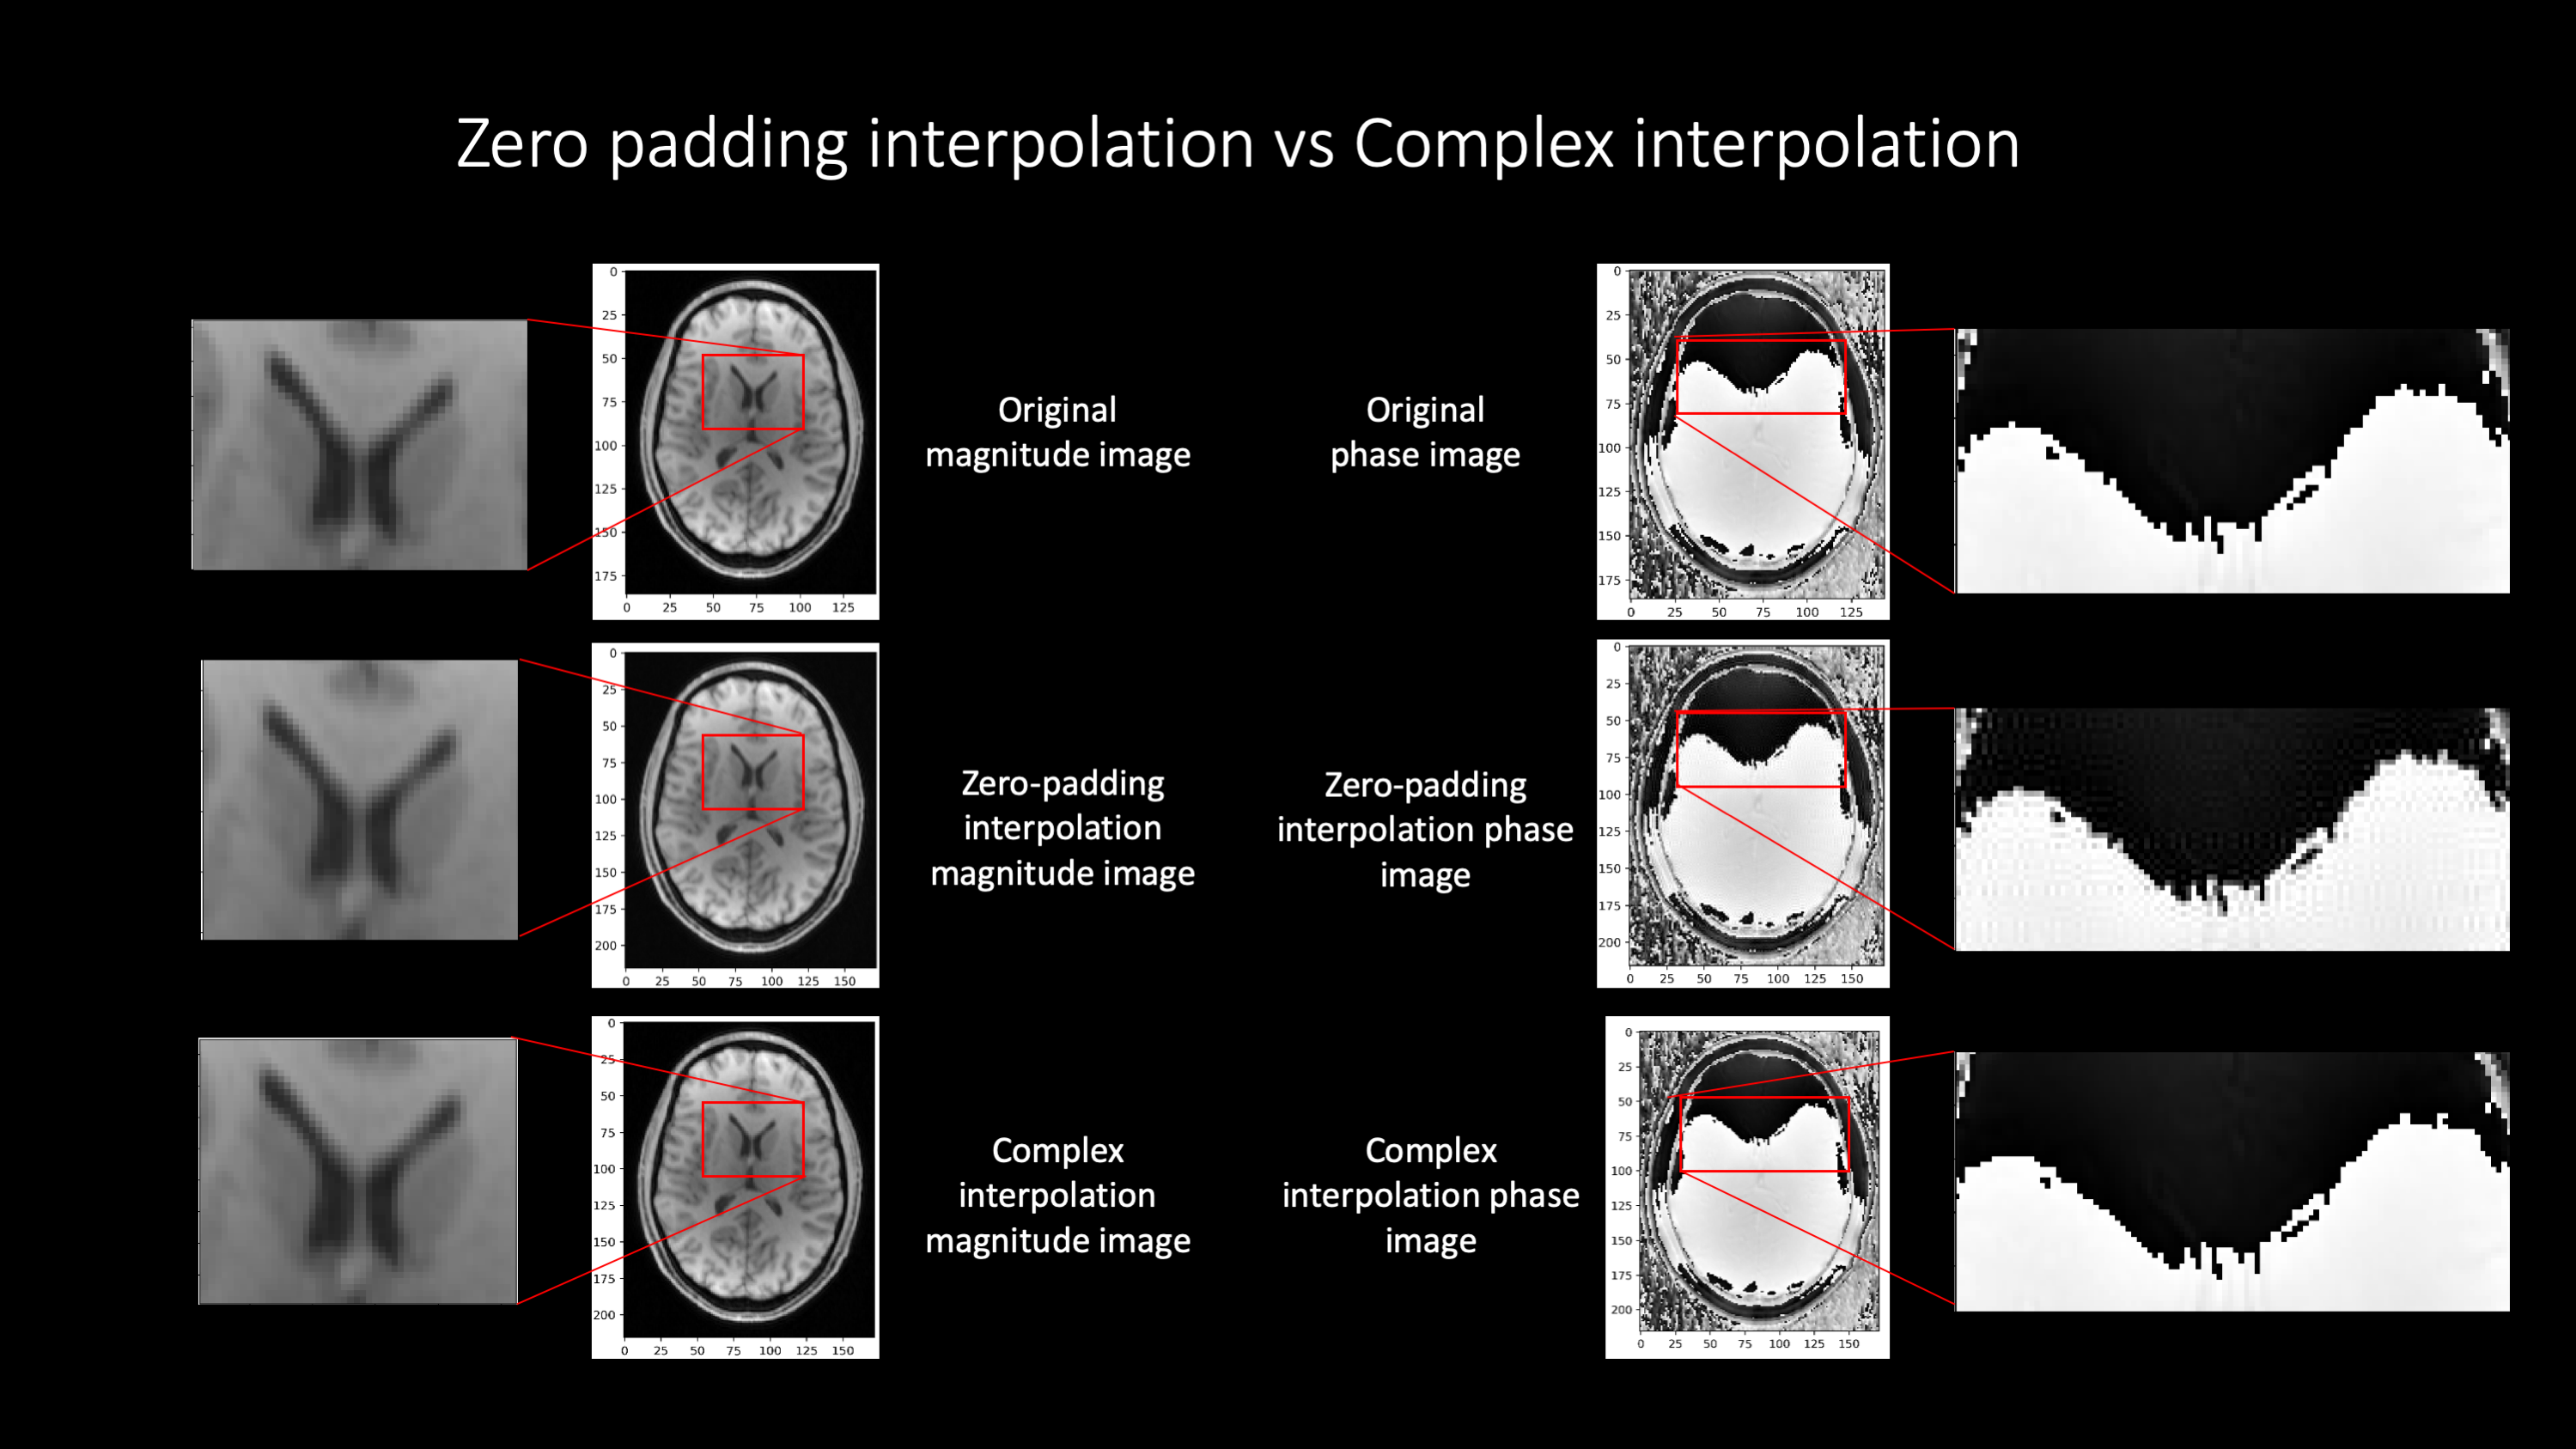
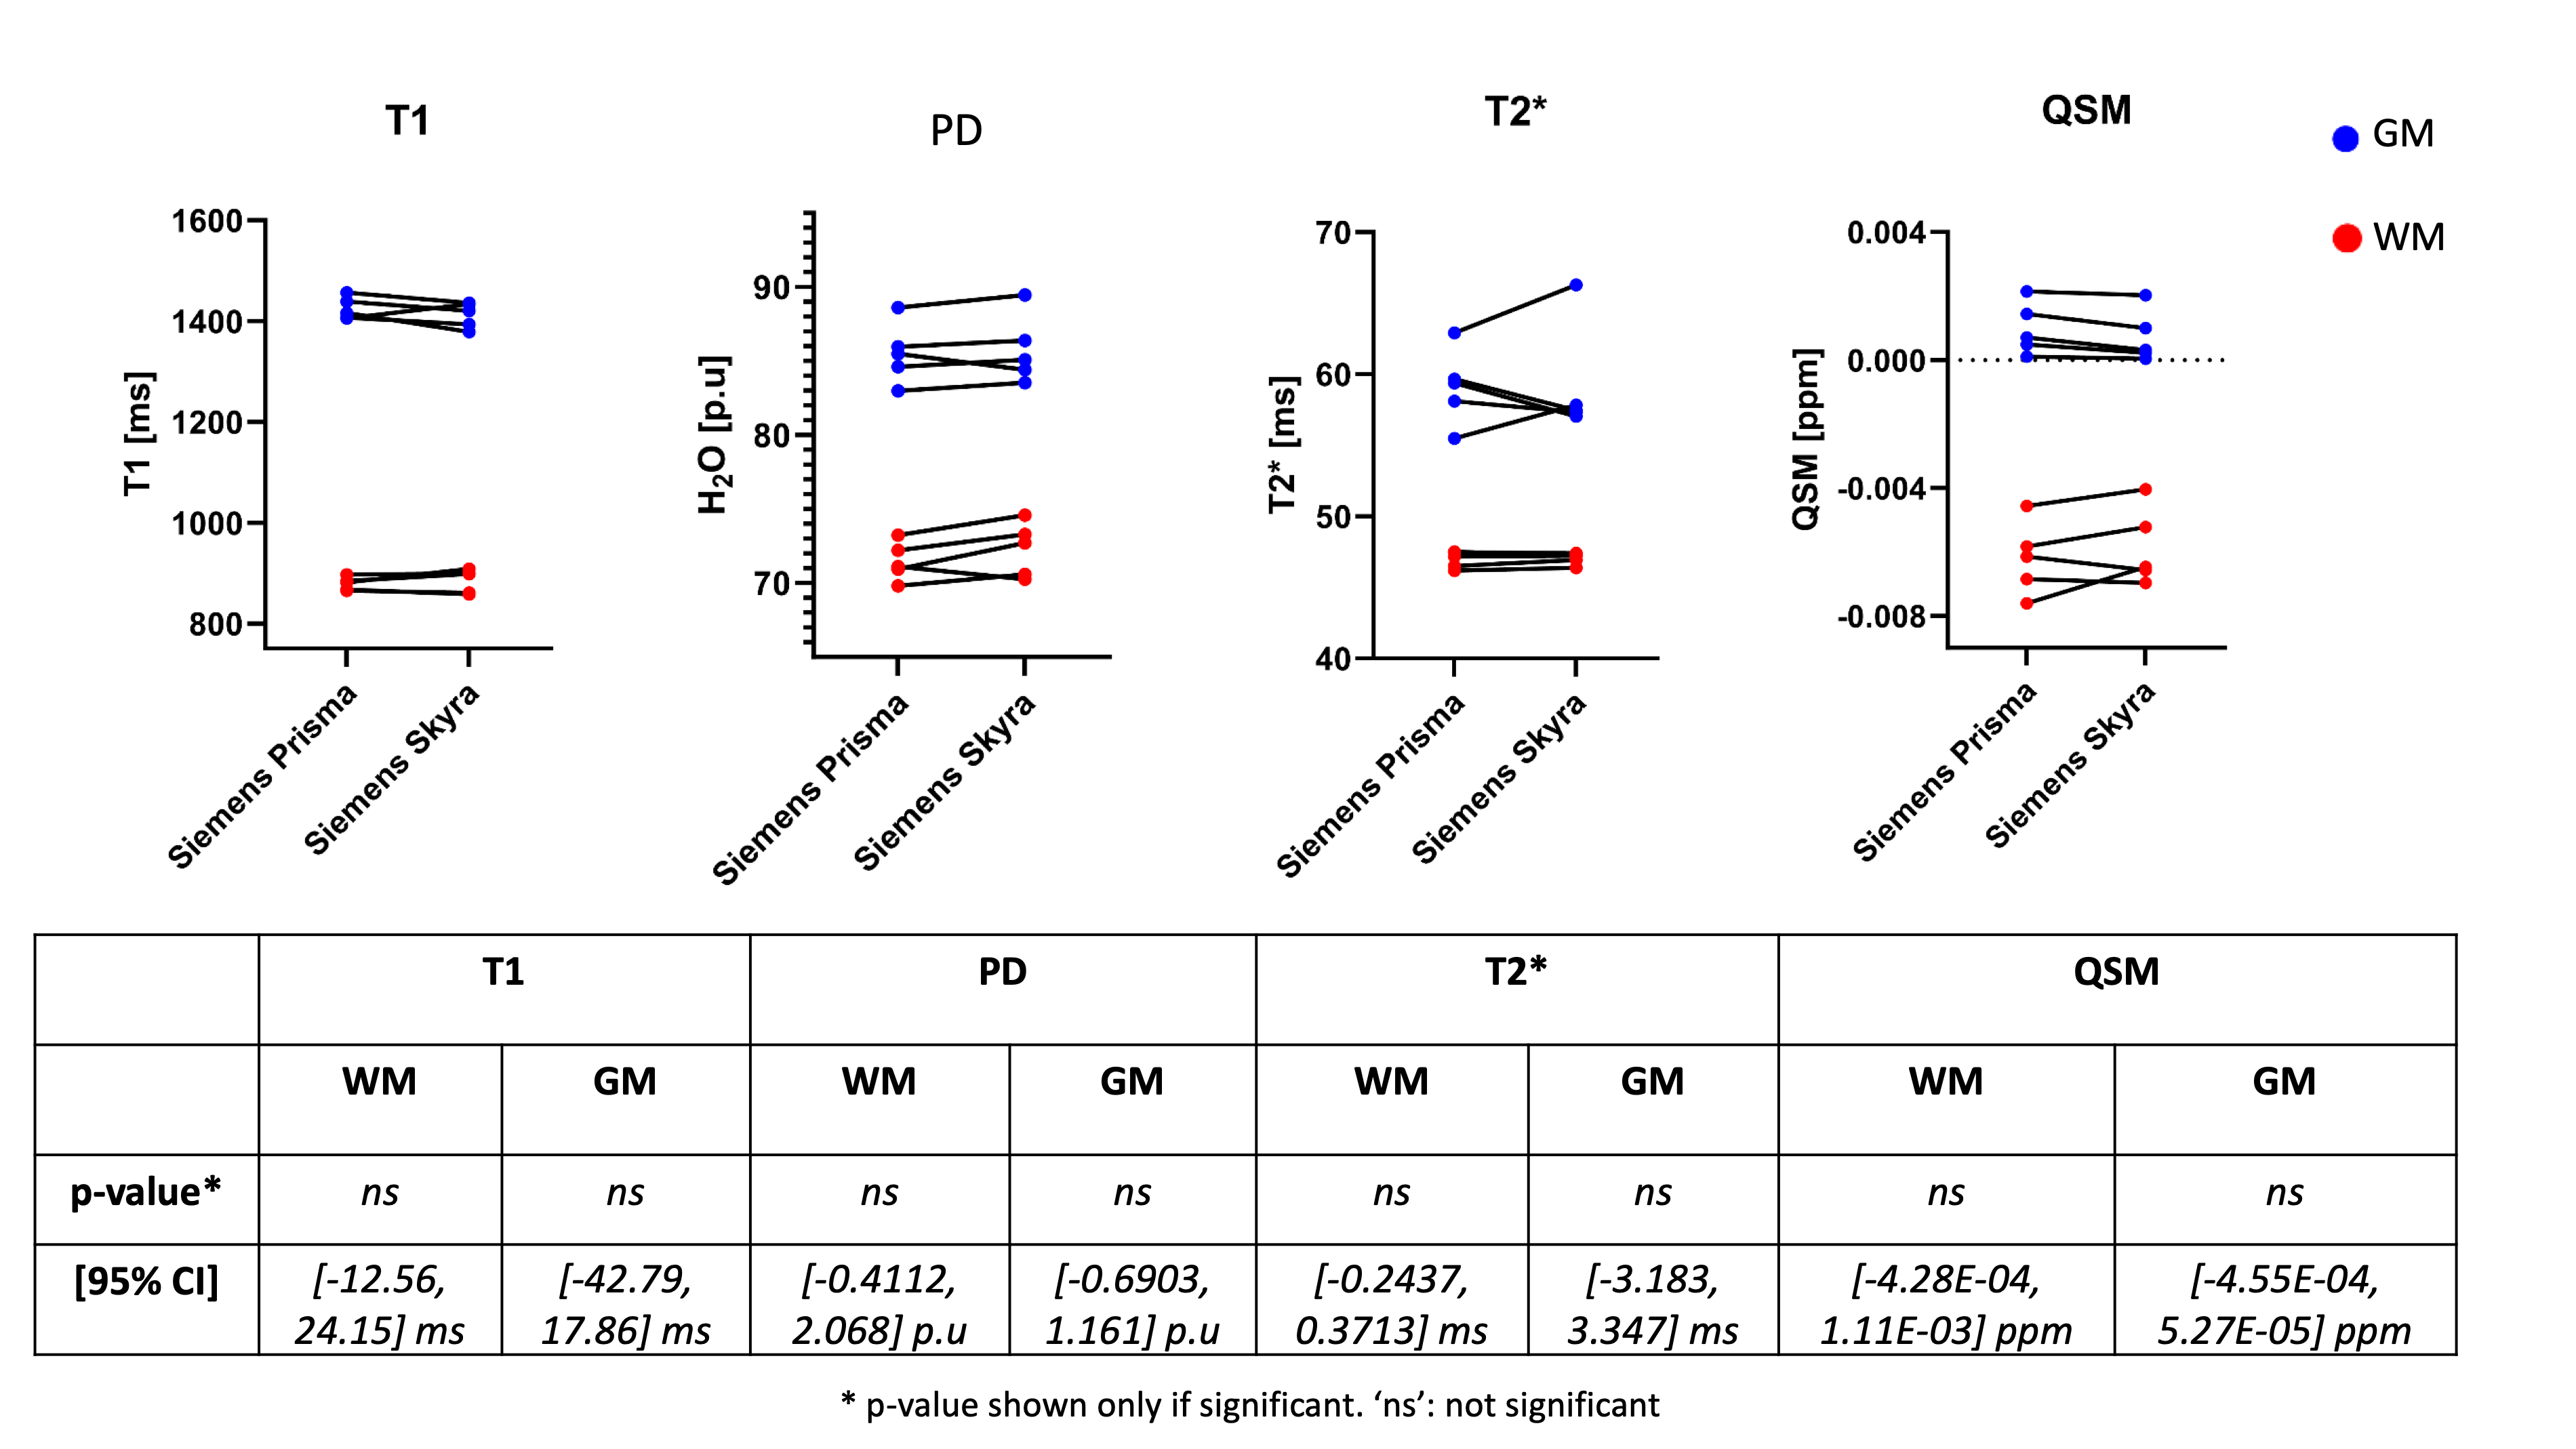
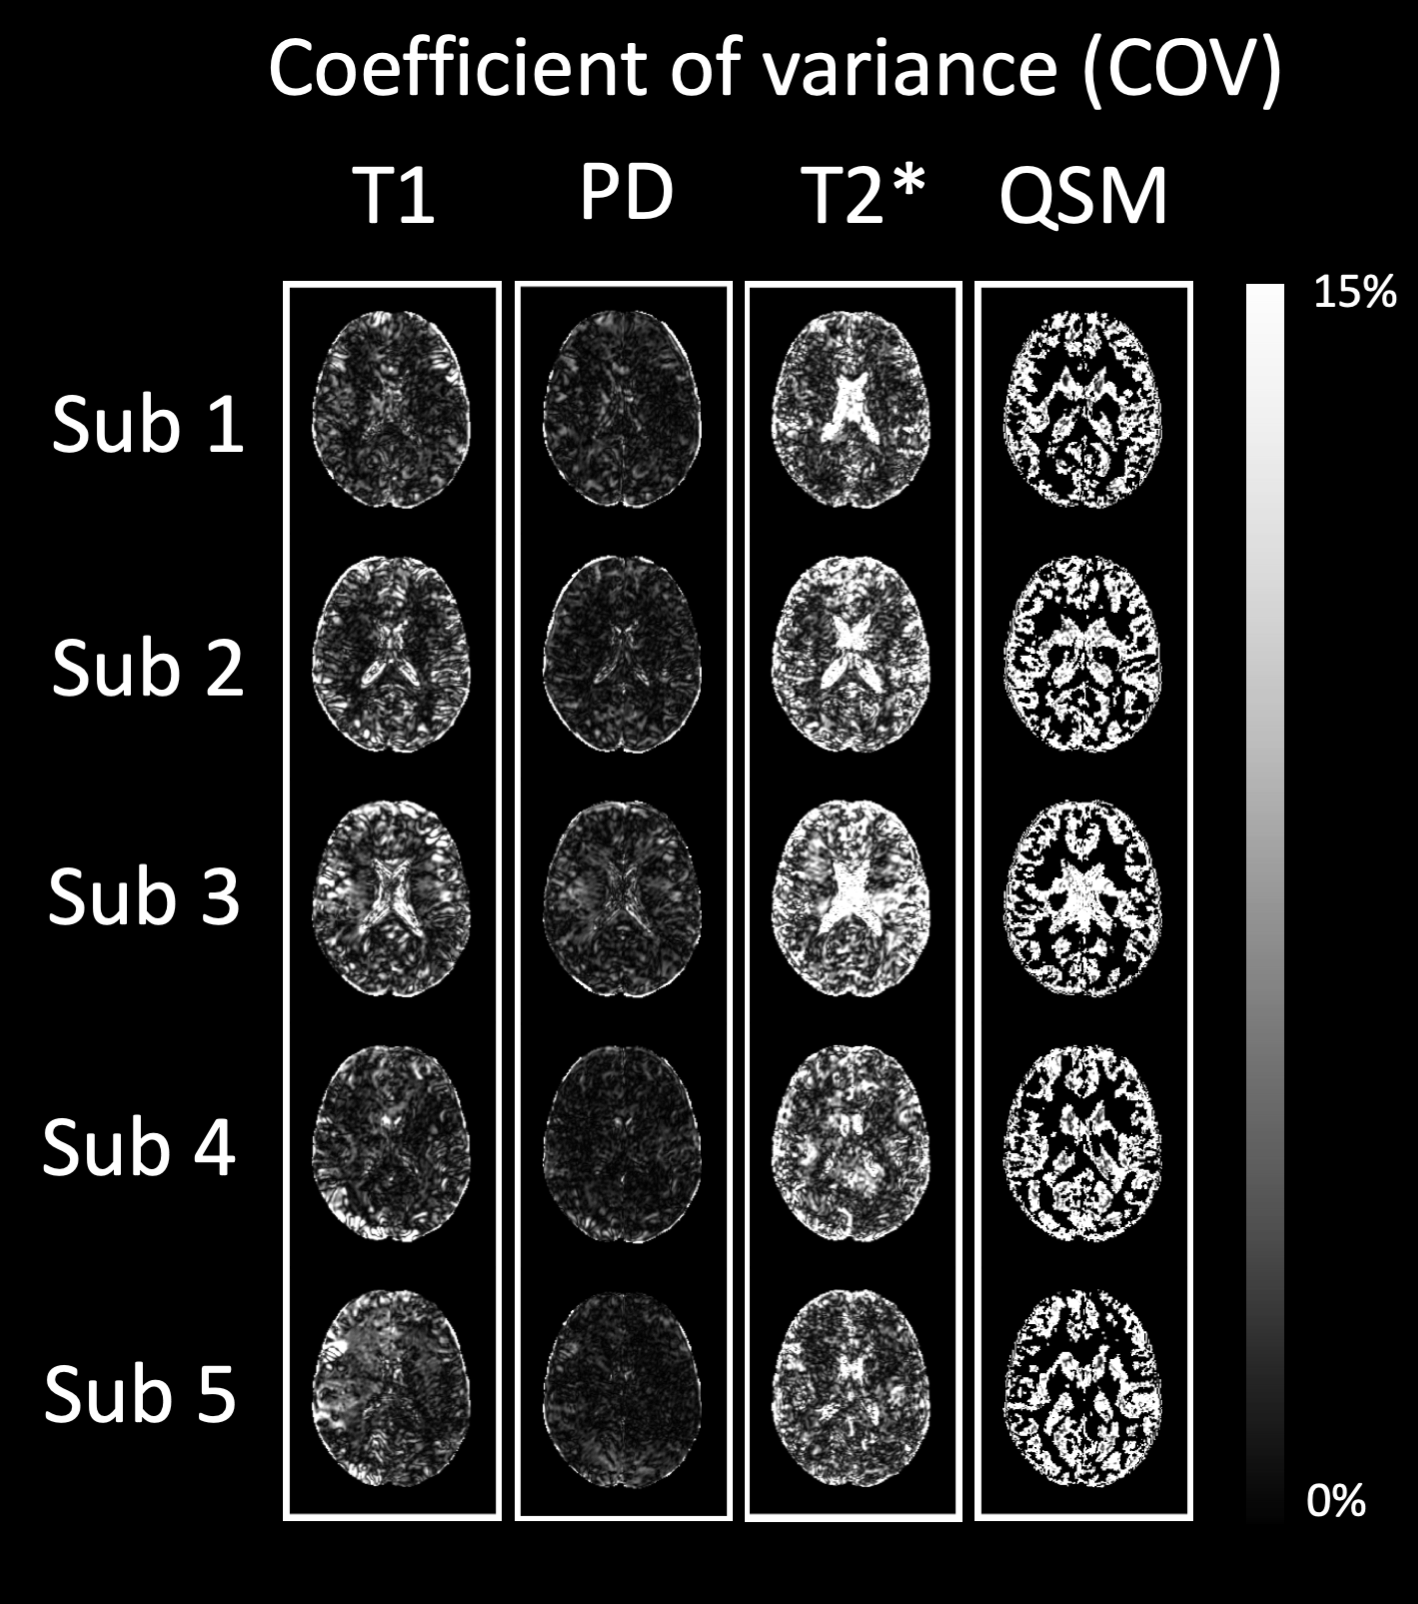
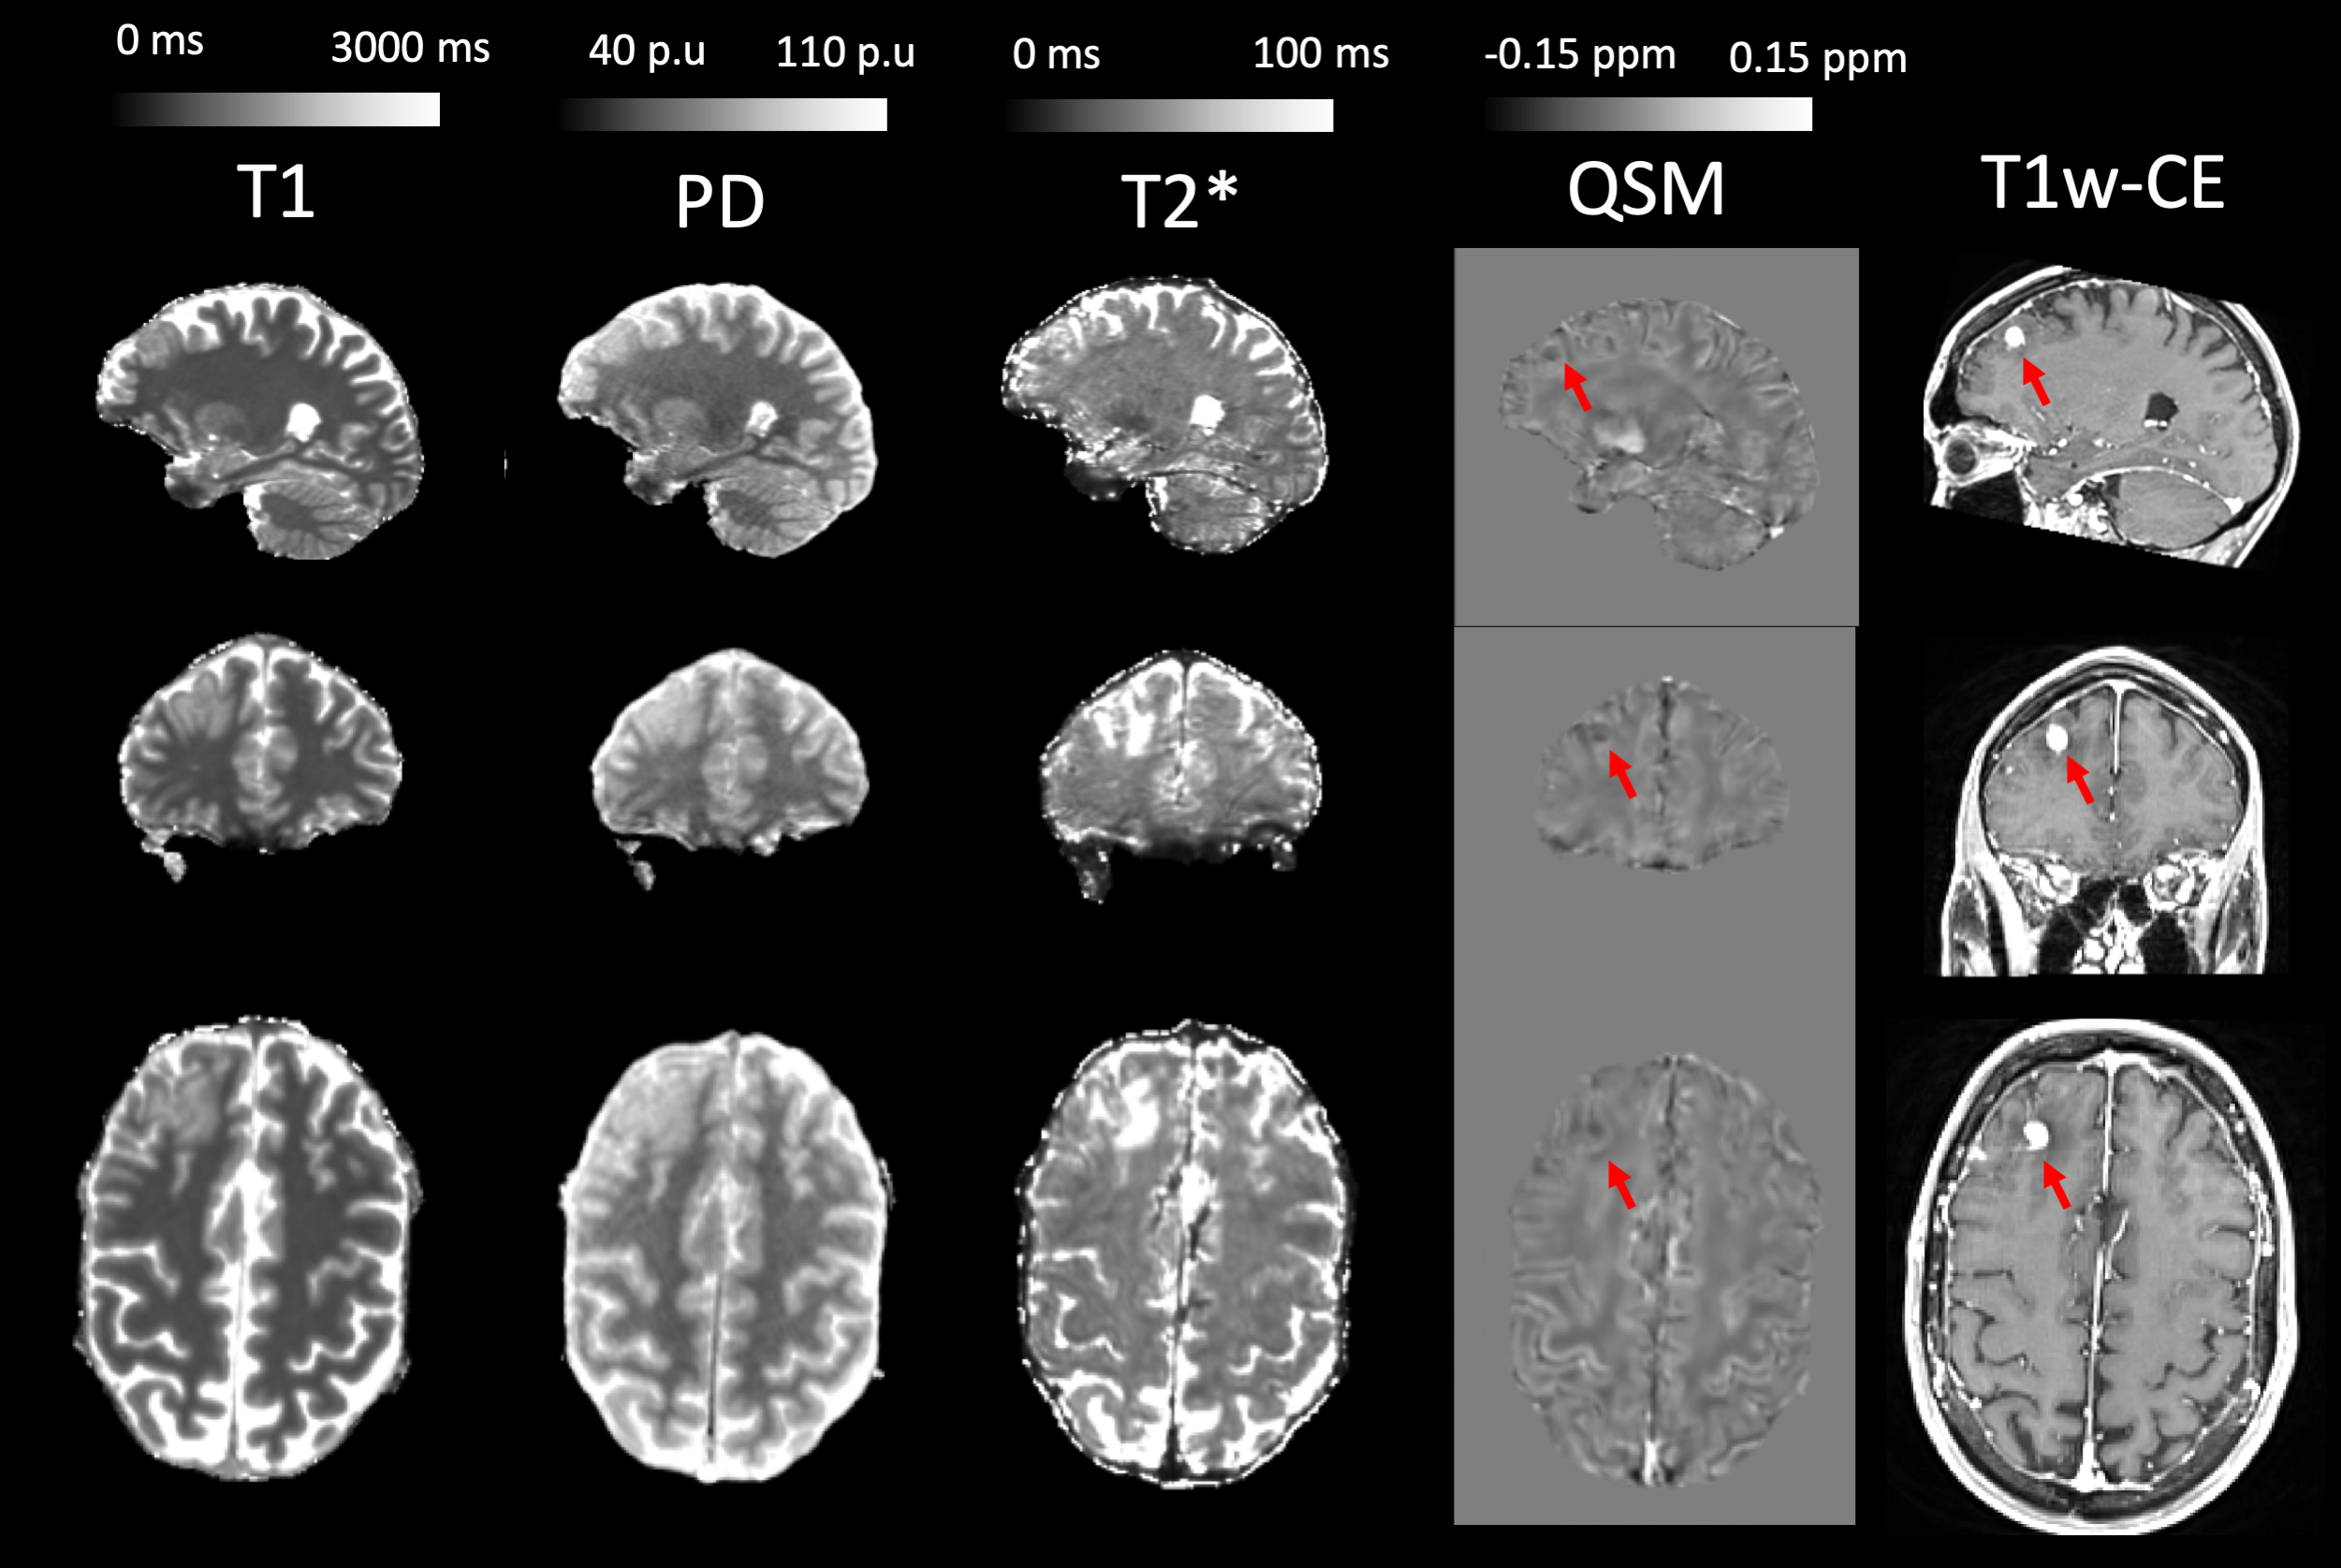
Figure 2 shows that complex interpolation yields artefact-free interpolated phase images. Figure 3 shows mean WM and GM values for all volunteers, further illustrating the good inter-scanner agreement. Paired t-tests revealed no significant inter-scanner differences, thus indicating no bias in the qMRI values. According to Figure 4, PD maps yield the lowest COV, followed by T1, T2 and QSM maps. For QSM, the large COV may be due to values being very close to zero. Mean WM values across healthy volunteers were (mean +/- std): Prisma: T1[ms]: 878.99 +/- 11.60, T2*[ms]: 46.98 +/- 0.53, PD[p.u]: 71.46 +/- 1.17, QSM[ppm]: -0.00619 +/- 0.00102, Skyra: T1[ms]: 884.79 +/- 21.09, T2*[ms]: 47.04 +/- 0.37, PD[p.u]: 72.29 +/- 1.63, QSM[ppm]: -0.00585 +/- 0.00107. Mean GM values were: Prisma: T1[ms]: 1425.01 +/- 19.86, T2*[ms]: 59.11 +/- 2.41, PD[p.u]: 85.54 +/- 1.85, QSM[ppm]: 0.0009728 +/- 0.000727, Skyra: T1[ms]: 1412.54 +/- 22.80, T2*[ms]: 59.19 +/- 3.55, PD[p.u]: 85.77 +/- 2.06, QSM[ppm]: 0.000719 +/- 0.000726. Figure 5 shows the qMRI maps for the brain metastasis patient. QSM values are reduced in the region of contrast enhancement. T1 and PD show similar intra-tumoral contrast. T2* and QSM show intra-tumoral inhomogeneity which is not visible in the T1 and PD maps.Discussion and Conclusions
The proposed mp-qMRI protocol yields bias free T1, PD, T2* and QSM maps. Many studies calibrate PD maps by assigning a fixed mean value to WM (69p.u)12. Here, CSF was calibrated to100p.u, potentially mapping more accurately inter-subject variations in water content. The resulting PD maps showed a very low COV, in spite of choosing CSF voxels for calibration. QSM maps showed the highest COV, probably due to the closeness of the QSM values to zero and due to the sensitivity of mGRE sequences to motion. In the brain metastasis patient, the hypo-intense area in the QSM map matched the contrast enhancing region in the CE-T1w image. These “intratumoral susceptibility signals” (ITSS) can be indicative of tumor microbleedings, neovessels or melanotic brain metastases13. To conclude, we have described the development and validation of an 8-minute, vendor-neutral, 3T protocol for mp-qMRI studies for investigating brain tumor patients. The protocol yields reliable and reproducible, interpolated 1.2mm isotropic T1, PD, T2* and QSM maps. This was demonstrated for two different 3T scanners on five healthy volunteers. The potential application of the protocol was exemplarily shown for a brain metastasis patient.Acknowledgements
The authors would like to thank Else Kröner-Fresenius-Stiftung (EKFS) for funding this work. The authors would also like to thank Seyma Alcicek, Andrei Manzhurtsev, Ulrich Pilatus and Manoj Shrestha for fruitful discussions and help with volunteer measurements.References
[1] A. Seiler et al., “Multiparametric Quantitative MRI in Neurological Diseases,” Front. Neurol., vol. 0, 2021, doi: 10.3389/fneur.2021.640239.
[2] N. Weiskopf et al., “Quantitative multi-parameter mapping of R1, PD*, MT, and R2* at 3T: a multi-center validation,” Frontiers in Neuroscience, vol. 7, 2013, doi: 10.3389/fnins.2013.00095.
[3] R. C. Berg, T. Leutritz, N. Weiskopf, and C. Preibisch, “Multi‐parameter quantitative mapping of R1, R2*, PD, and MTsat is reproducible when accelerated with Compressed SENSE,” NeuroImage, vol. 253, p. 119092, Jun. 2022, doi: 10.1016/j.neuroimage.2022.119092.
[4] J. B. M. Warntjes, O. Dahlqvist, and P. Lundberg, “Novel method for rapid, simultaneousT1,T*2, and proton density quantification,” Magn. Reson. Med., vol. 57, no. 3, Art. no. 3, Mar. 2007, doi: 10.1002/mrm.21165.
[5] A. Hagiwara, S. Fujita, R. Kurokawa, C. Andica, K. Kamagata, and S. Aoki, “Multiparametric MRI,” Invest Radiol, vol. 58, no. 8, pp. 548–560, Aug. 2023, doi: 10.1097/RLI.0000000000000962.
[6] “Multiparameter quantitative histological MRI values in high-grade gliomas: a potential biomarker of tumor progression | Neuro-Oncology Practice | Oxford Academic.” Accessed: Mar. 16, 2023. [Online]. Available: https://academic.oup.com/nop/article/7/6/646/5892958
[7] P. Tofts, Ed., Quantitative MRI of the brain: measuring changes caused by disease. Chichester, West Sussex ; Hoboken, NJ: Wiley, 2003.
[8] Z. Abbas, V. Gras, K. Möllenhoff, A.-M. Oros-Peusquens, and N. J. Shah, “Quantitative water content mapping at clinically relevant field strengths: A comparative study at 1.5T and 3T,” NeuroImage, vol. 106, pp. 404–413, Feb. 2015, doi: 10.1016/j.neuroimage.2014.11.017.
[9] P. P. Fatouros, A. Marmarou, K. A. Kraft, S. Inao, and F. P. Schwarz, “In Vivo Brain Water Determination by T1 Measurements: Effect of Total Water Content, Hydration Fraction, and Field Strength,” Magnetic Resonance in Medicine, vol. 17, no. 2, pp. 402–413, 1991, doi: 10.1002/mrm.1910170212.
[10] H. Olsson, M. Andersen, J. Lätt, R. Wirestam, and G. Helms, “Reducing bias in dual flip angle T1-mapping in human brain at 7T,” Magnetic Resonance in Medicine, vol. 84, no. 3, pp. 1347–1358, 2020, doi: 10.1002/mrm.28206.
[11] U. Nöth, M. Shrestha, and R. Deichmann, “B1 mapping using an EPI-based double angle approach: A practical guide for correcting slice profile and B0 distortion effects,” Magnetic Resonance in Medicine, vol. 90, no. 1, pp. 103–116, 2023, doi: 10.1002/mrm.29632.
[12] K. Tabelow et al., “hMRI – A toolbox for quantitative MRI in neuroscience and clinical research,” NeuroImage, vol. 194, pp. 191–210, Jul. 2019, doi: 10.1016/j.neuroimage.2019.01.029.
[13] D. Schwarz et al., Frontiers | Clinical Value of Susceptibility Weighted Imaging of Brain Metastases, Front. Neurol., 04 February 2020
Figures