3589
Case studies evaluating the enhanced visualization and characterization of brain tumor using multi-contrast MRI at 7T1Advanced Imaging Research Center, UT Southwestern Medical Center, Dallas, TX, United States, 2Radiology, UT Southwestern Medical Center, Dallas, TX, United States, 3Philips Healthcare, Cambridge, MA, United States, 4Internal Medicine, UT Southwestern Medical Center, Dallas, TX, United States, 5Neurological Surgery, UT Southwestern Medical Center, Dallas, TX, United States
Synopsis
Keywords: Tumors (Post-Treatment), Tumor, High-Field MRI, Multi-contrast
Motivation: Multi-contrast MRI at 7T can potentially lead to enhanced detection and characterization of brain tumor with unpresented sensitivity and specificity.
Goal(s): To evaluate the improvement in tumor boundary, vasculature and hemorrhage detection using a set of complementary MRI sequences at 3T and 7T.
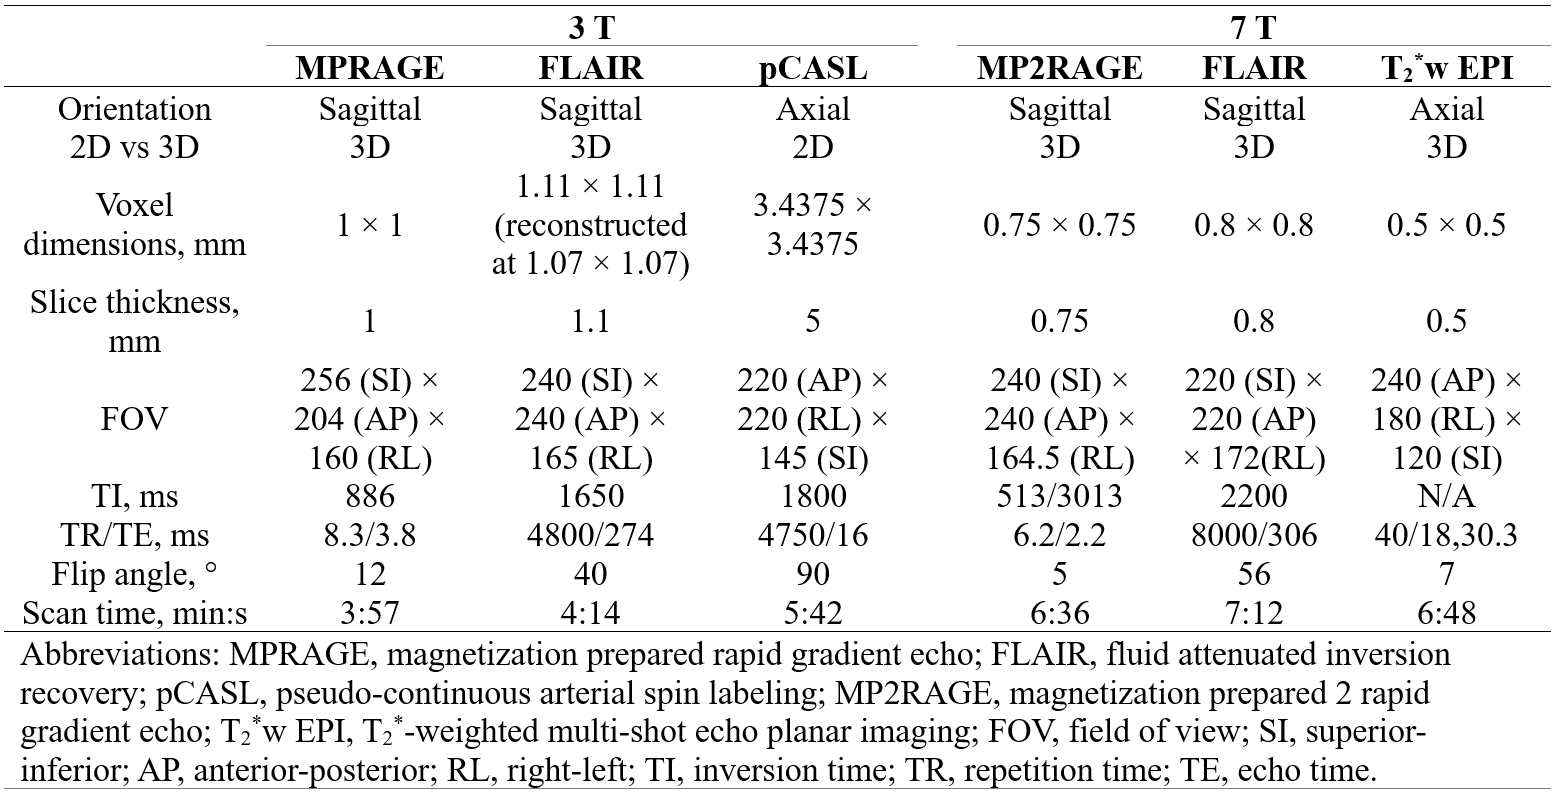
Approach: Five brain tumor patients were scanned with multi-contrast MRI protocols at 7T and 3T. All 7T protocols were implemented with submillimeter resolution in similar scan time as the 3T methods.
Results: At 7T, high image quality was observed in all the protocols because of high contrast and resolution. This led to improved detection of tumor boundary, vasculature, and hemorrhage.
Impact: Multi-contrast ultrahigh field MRI has the potential to non-invasively detect brain tumor in the early stage, provide precise tumor delineation, and visualize tumor-specific processes not seen on conventional MRI.
INTRODUCTION
Standard clinical MRI of brain tumor is unable of precise tumor margin delineation, and ambiguous with respect to treatment monitoring that requires distinction of true tumor progression or regression from pseudo-progression or pseudo-regression. The increased contrast, signal and spatial resolution at higher field strength can lead to improved sensitivity and specificity to meet these unmet needs in clinical brain tumor management. In this abstract, we report initial results showing the improved performance of 7 T MRI as part of our 7 T multi-contrast anatomical and metabolic brain tumor imaging study.METHODS
MRI experimentsFive brain tumor patients were scanned between May 2023 and November 2023 using multi-contrast MRI protocols at 7 T and 3 T. The patients signed a consent form approved by the local Institute Review Board. They were scanned on a 7 T MRI scanner (dSync, Philips) using a 2-channel transmit and 32-channel receive head-only RF coil, and a 3 T MRI scanner (Achieva, Philips) using a 32-channel receive array RF coil. At 3 T, images including T1-weighted MPRAGE and 3D FLAIR were acquired for anatomical references; in addition, cerebral blood flow (CBF) was measured using a pseudo-continuous-arterial-spin-labeling (pCASL) sequence. At 7 T, the anatomical images included T1-weighted MP2RAGE, 3D FLAIR and a T2*-weighted multi-echo 3D echo-planar-imaging (EPI) sequence. The 3D EPI sequence, including simultaneous navigator acquisition for improved motion robustness of the high resolution data1, was included for susceptibility-weighted imaging (SWI) and quantitative susceptibility mapping (QSM) given the high susceptibility contrast at 7 T2,3. Detailed MRI parameters can be found in Table 1 for both MRI systems. Note that all 7 T anatomical imaging sequences were implemented with submillimeter isotropic resolution with less than 10-min scan time. All patients also underwent an additional 2D FID 1H MRSI scan (TE = 1.2ms, TR = 320 ms, Flip Angle = 33°, resolution = 5x5x5 mm, FOV 50x50) with 2-fold CAPIRINHA acceleration and AI based reconstruction4,5.
Image reconstruction and processing
The T1-weighted and FLAIR images were reconstructed using vendor provided reconstruction pipeline. The pCASL data was processed using the ISMRM perfusion study group consensus pipeline6. The T2*-weighted 3D EPI images were reconstructed using a custom MATLAB software including motion and magnetic field (B0) correction1. The result complex images were further processed to generate SWI7, minimum intensity project (MIP) and QSM8 images. The MRSI data have been reconstructed and pre-processed with custom developed Python and MATLAB scripts4,5 and spectral fitting has been performed with ProFit-1D 9.
RESULTS
Increased T1 and T2 contrast at 7 T improved delineation of tumor boundary and internal vasculatureFig. 1 exhibits a case of a low-grade glioma located adjacent to the right thalamus. Comparing the 7 T MP2RAGE and 3 T MPRAGE images, the enhanced T1 contrast at 7 T clearly improved the delineation of the tumor boundary (solid arrows). Similarly, the increased T2 contrast at 7 T also improved the delineation of the tumor from the normal thalamic tissue (open arrows). The high resolution SWI improved the detection of small vessels near the tumor compared to the lower resolution SWI (in-plane 0.5 vs 1.0 mm).
Increased detection of hemorrhage and possible tumor-related vasculature at 7 T
A case of high-grade oligodendroglioma is presented in Fig. 2. The increased T2 contrast allows better visualization of hemorrhage or possible tumor-related vasculature in 7 T FLAIR and QSM compared to the 3 T FLAIR (solid and open arrows). In the center of the image (red contour), an enhancing region and its internal structure (open arrows) are hyper-perfused (3 T CBF). The slightly lower-perfusion core (open arrows) can be visualized in more detail in the 0.5 mm isotropic resolution QSM and MIP image, suggesting possible hemorrhage in the necrotic zone or abnormal vascular growth.
High sensitivity in detecting post-surgery bleeding using T2*w contrast and QSM at 7 T
Fig. 3 included data from a patient after surgical tumor removal. Along the border of the resection zone (arrows), post-surgery bleeding is clearly visible shown as hypointense T2*w magnitude and hyperintense or paramagnetic QSM and MIP signal, but much less visible in the 7 T MP2RAGE and FLAIR images.
Metabolic heterogeneity
Fig. 4 shows 7T FLAIR and 1H MRSI data of a patient with low grade oligodendroglioma. The 1H MRSI data show reduced NAA and elevated choline, myo-inositol and lactate concentrations and demonstrate metabolic heterogeneity.
DISCUSSION & CONCLUSION
The enhanced T1 and T2 contrast at 7 T can lead to enhanced detection and characterization of the tumor boundary, internal structural and metabolic heterogeneity of brain tumor and visualization of hemorrhage and neovascularization.Acknowledgements
This work was performed in the Advance Imaging Research Center at University of Texas Southwestern Medical Center Dallas (UTSW) and was supported by Cancer Prevention and Research Institute of Texas (CPRIT) grant / RR180056, Hamon Foundation and Texas Instrument Foundation.
References
1. Liu, J., van Gelderen, P., de Zwart, J. A. & Duyn, J. H. Reducing motion sensitivity in 3D high-resolution T2*-weighted MRI by navigator-based motion and nonlinear magnetic field correction. Neuroimage 206, 116332 (2020).
2. Duyn, J. H. et al. High-field MRI of brain cortical substructure based on signal phase. Proc. Natl. Acad. Sci. U.S.A. 104, 11796–11801 (2007).
3. Mittal, S., Wu, Z., Neelavalli, J. & Haacke, E. M. Susceptibility-Weighted Imaging: Technical Aspects and Clinical Applications, Part 2. AJNR Am J Neuroradiol 30, 232–252 (2009).
4. Chan, K. L., Ziegs, T. & Henning, A. Improved signal-to-noise performance of MultiNet GRAPPA 1 H FID MRSI reconstruction with semi-synthetic calibration data. Magn Reson Med 88, 1500–1515 (2022).
5. Chan, K. L. & Henning, A. MultiNet CAIPIRINHA: accelerated H MRSI with 1-step neural network reconstruction based on augmented MRSI training data. in Proceedings of the 31st Annual Meeting of ISMRM 1080 (2022).
6. Alsop, D. C. et al. Recommended implementation of arterial spin-labeled perfusion MRI for clinical applications: A consensus of the ISMRM perfusion study group and the European consortium for ASL in dementia. Magn Reson Med 73, 102–116 (2015).
7. Eckstein, K. et al. Improved susceptibility weighted imaging at ultra-high field using bipolar multi-echo acquisition and optimized image processing: CLEAR-SWI. NeuroImage 237, 118175 (2021).
8. Li, X. et al. Multi-atlas tool for automated segmentation of brain gray matter nuclei and quantification of their magnetic susceptibility. Neuroimage 191, 337–349 (2019).
9. Borbath, T., Murali-Manohar, S., Dorst, J., Wright, A. M. & Henning, A. ProFit-1D-A 1D fitting software and open-source validation data sets. Magn Reson Med 86, 2910–2929 (2021).
Figures
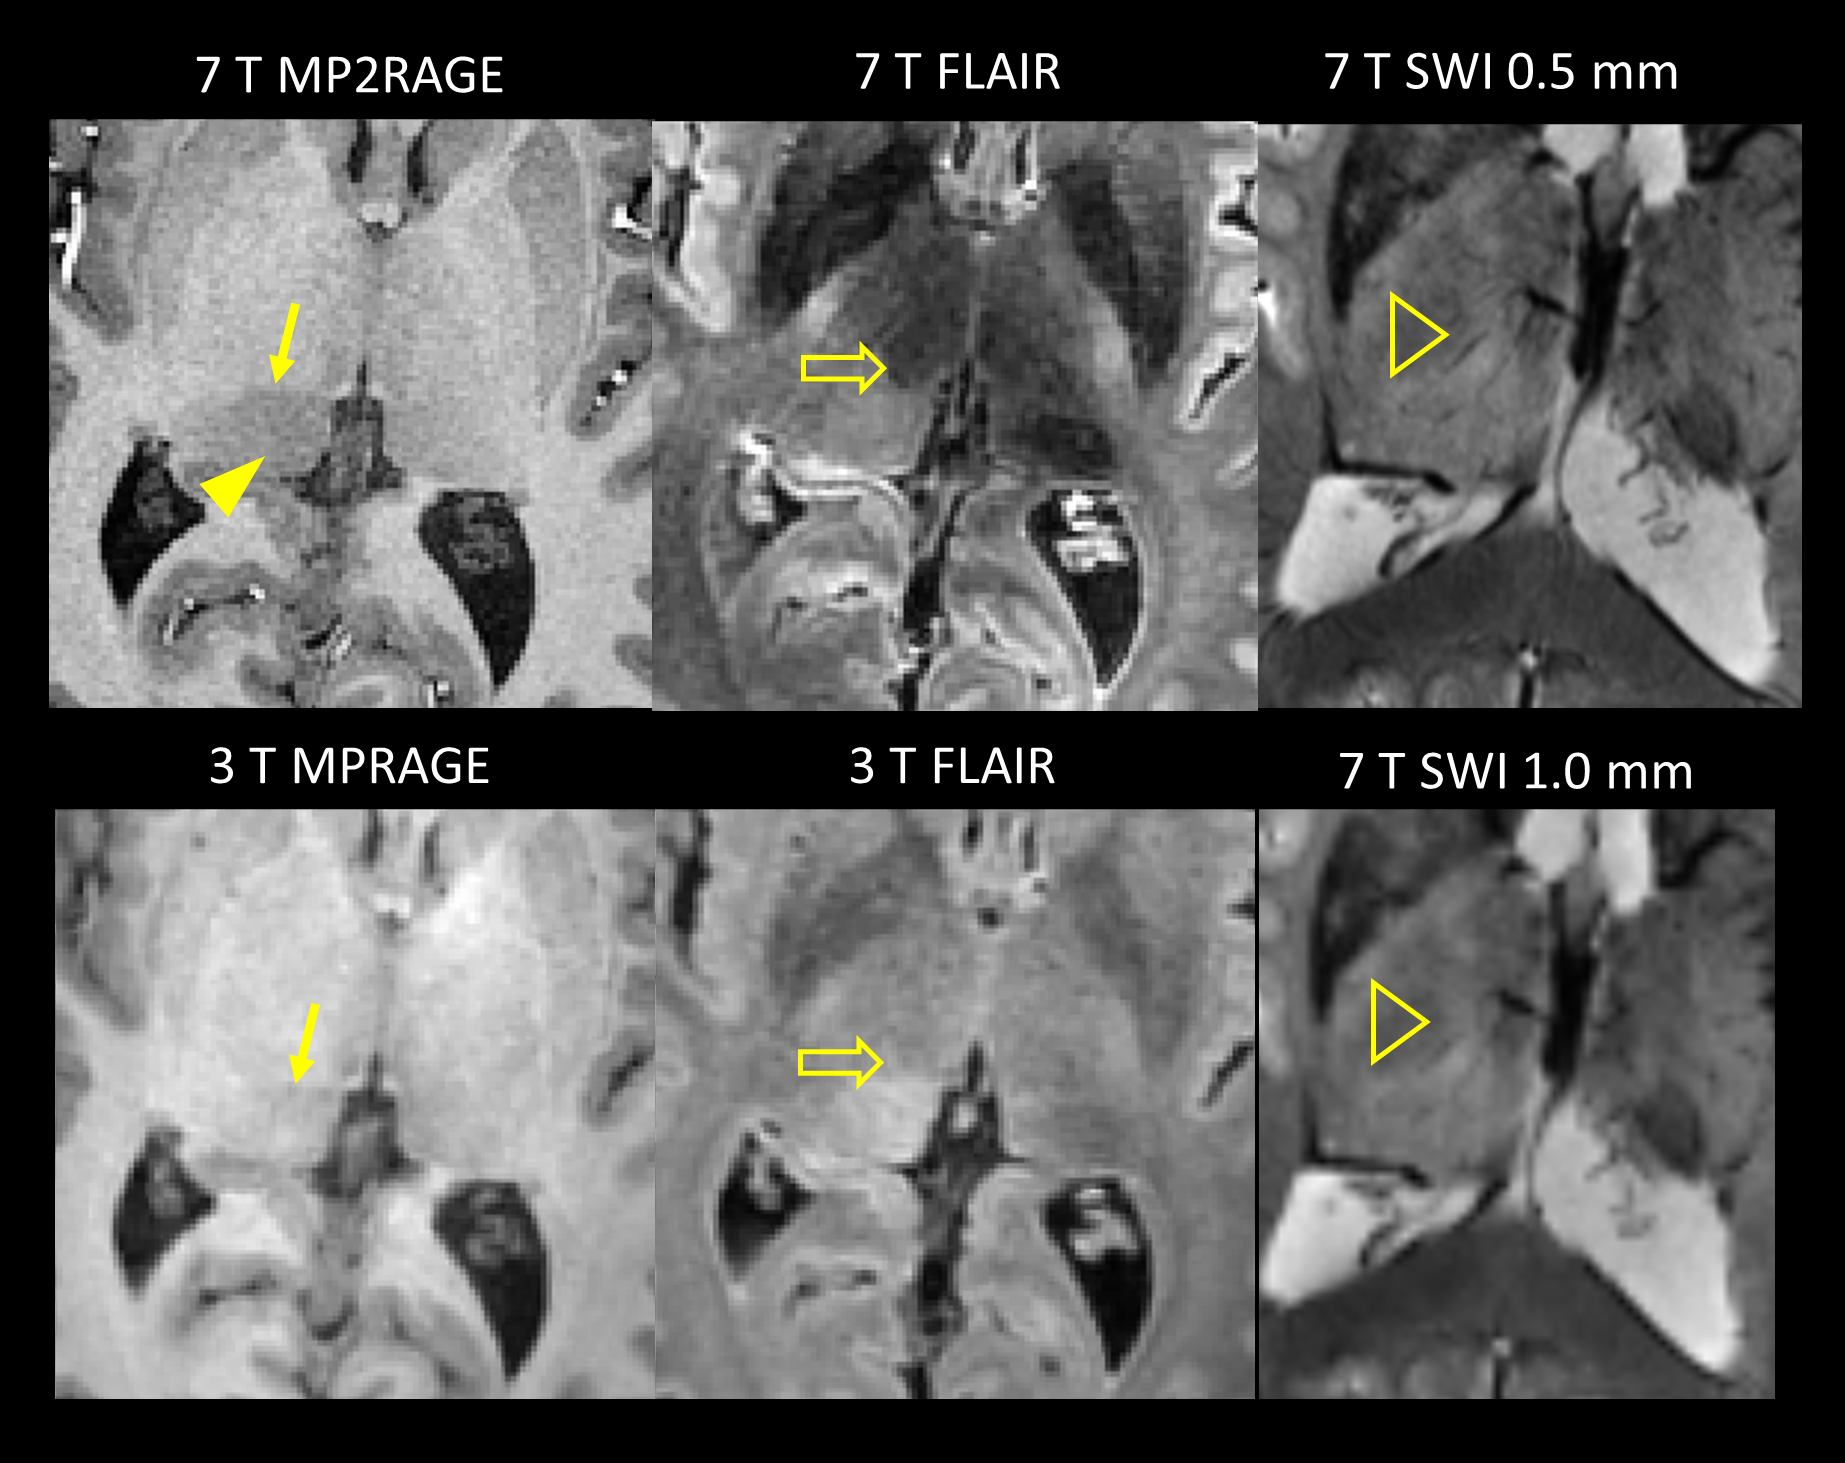
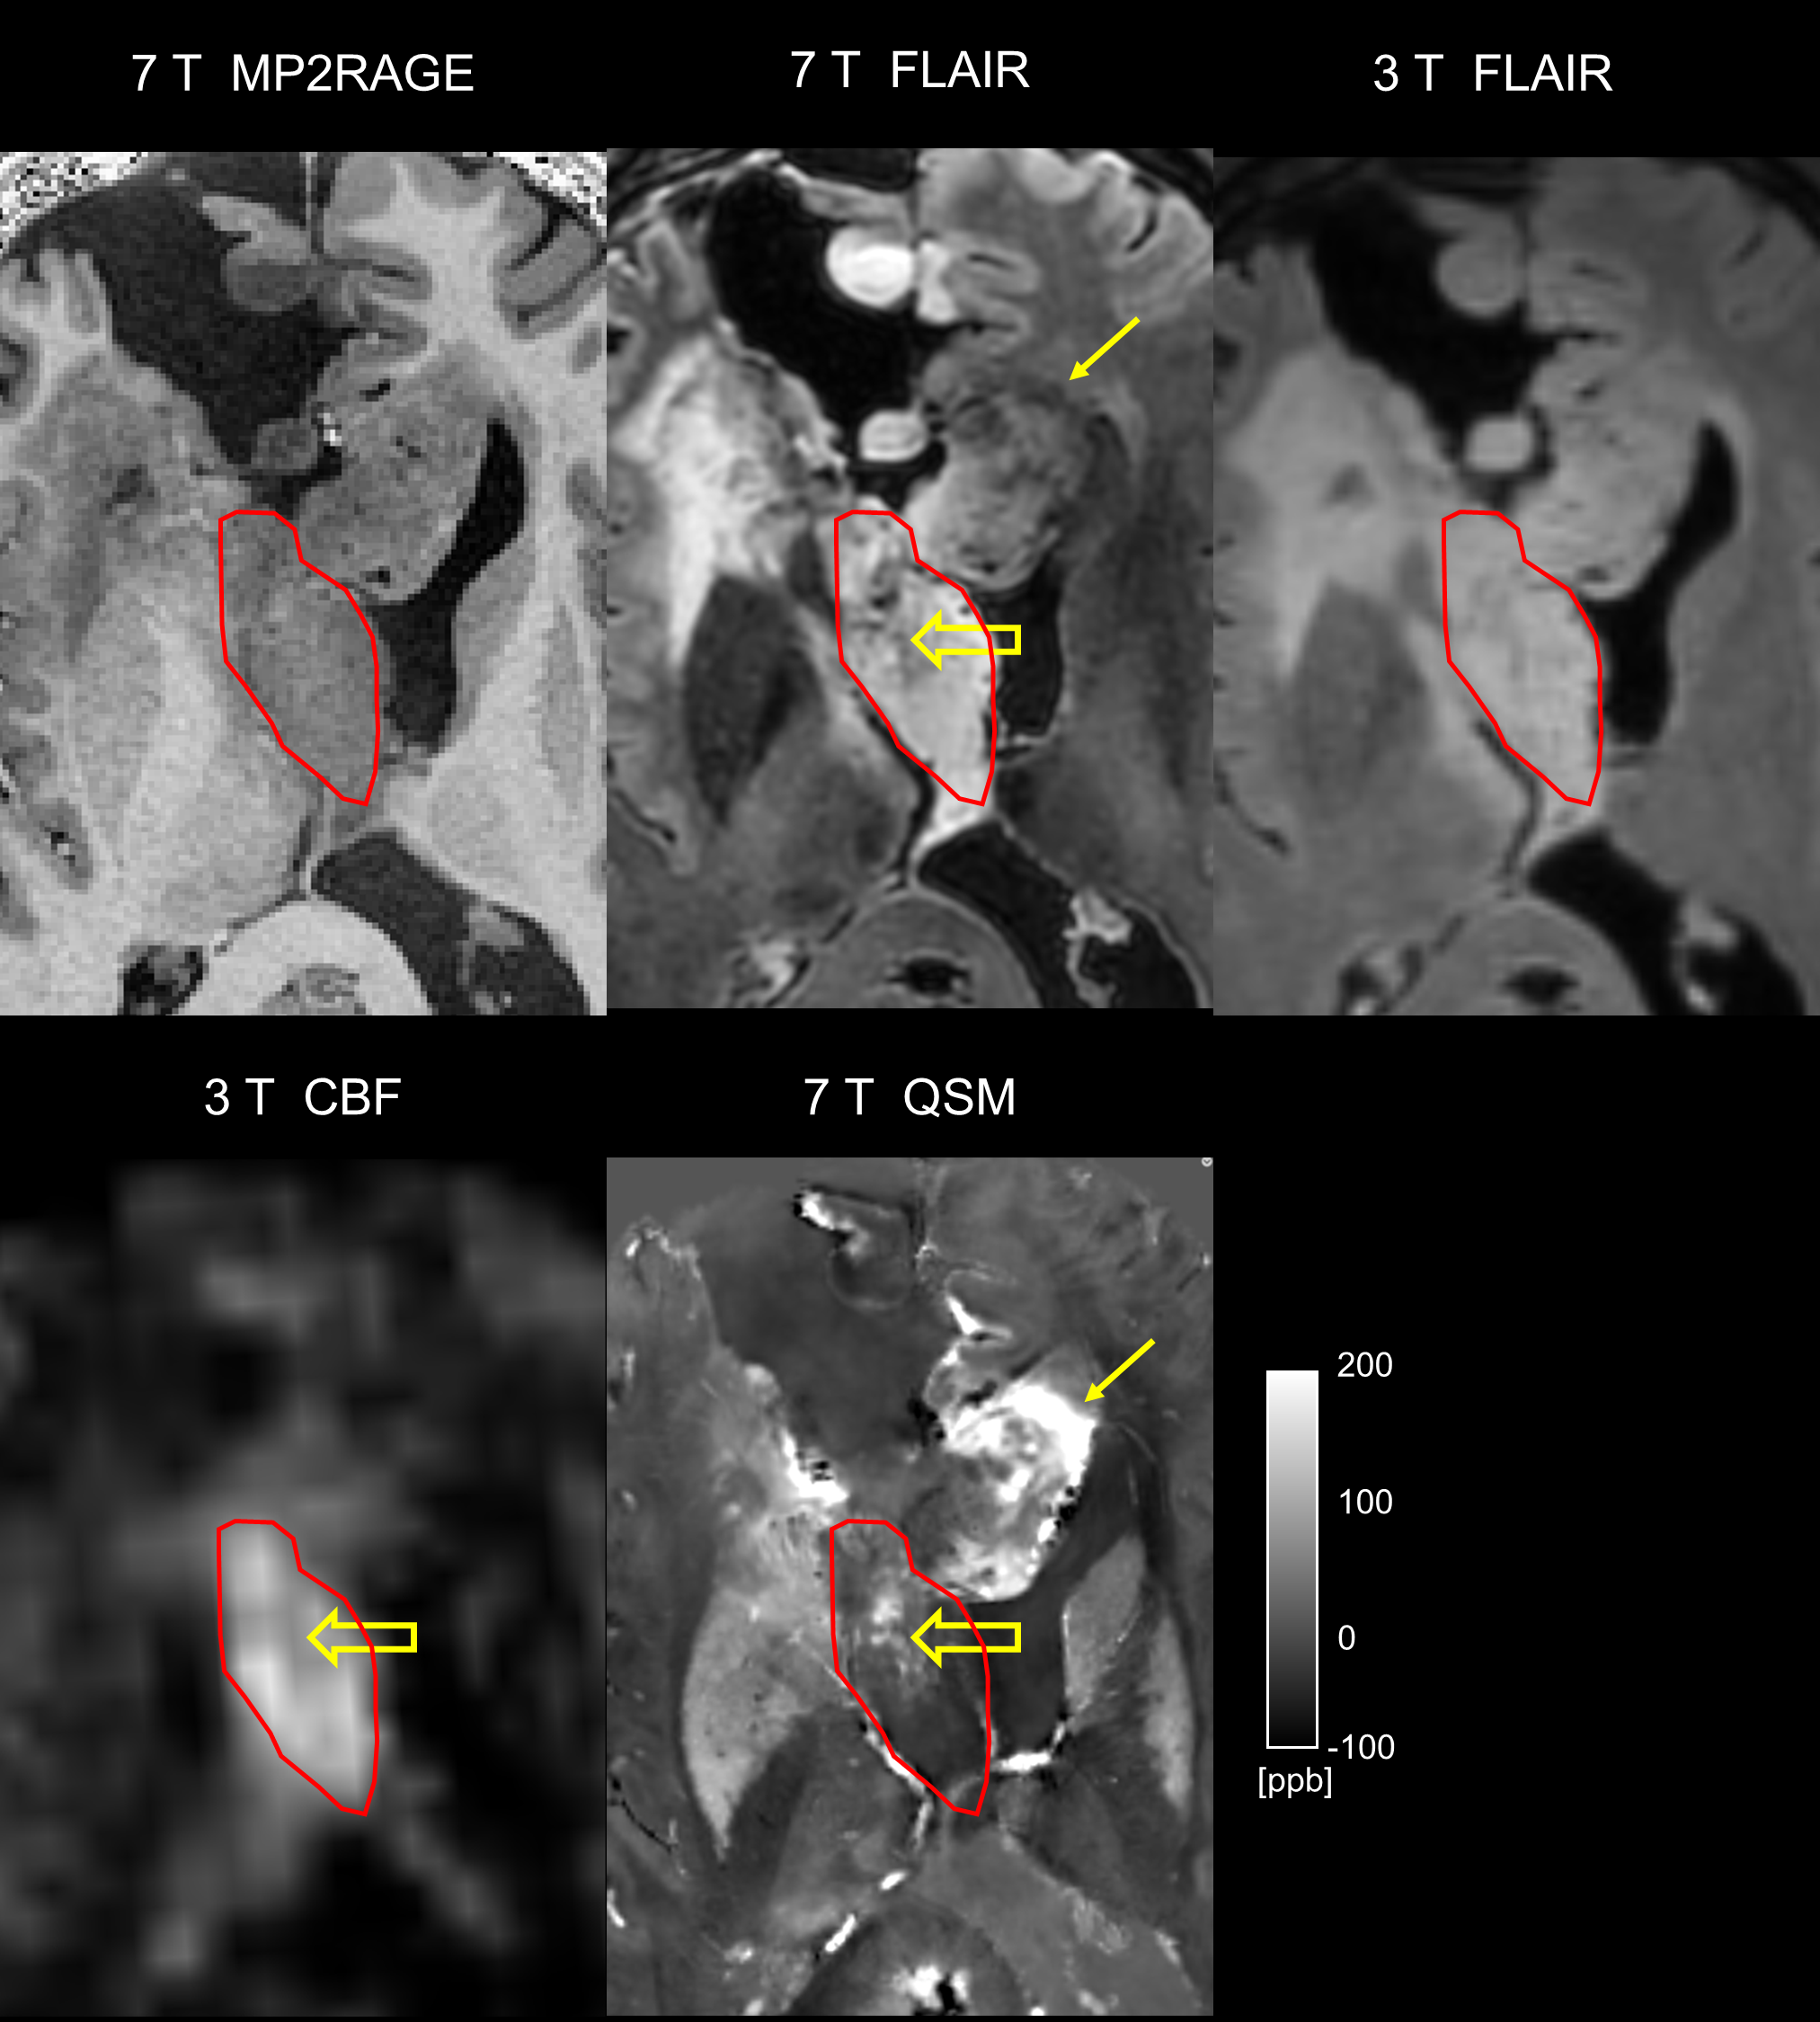
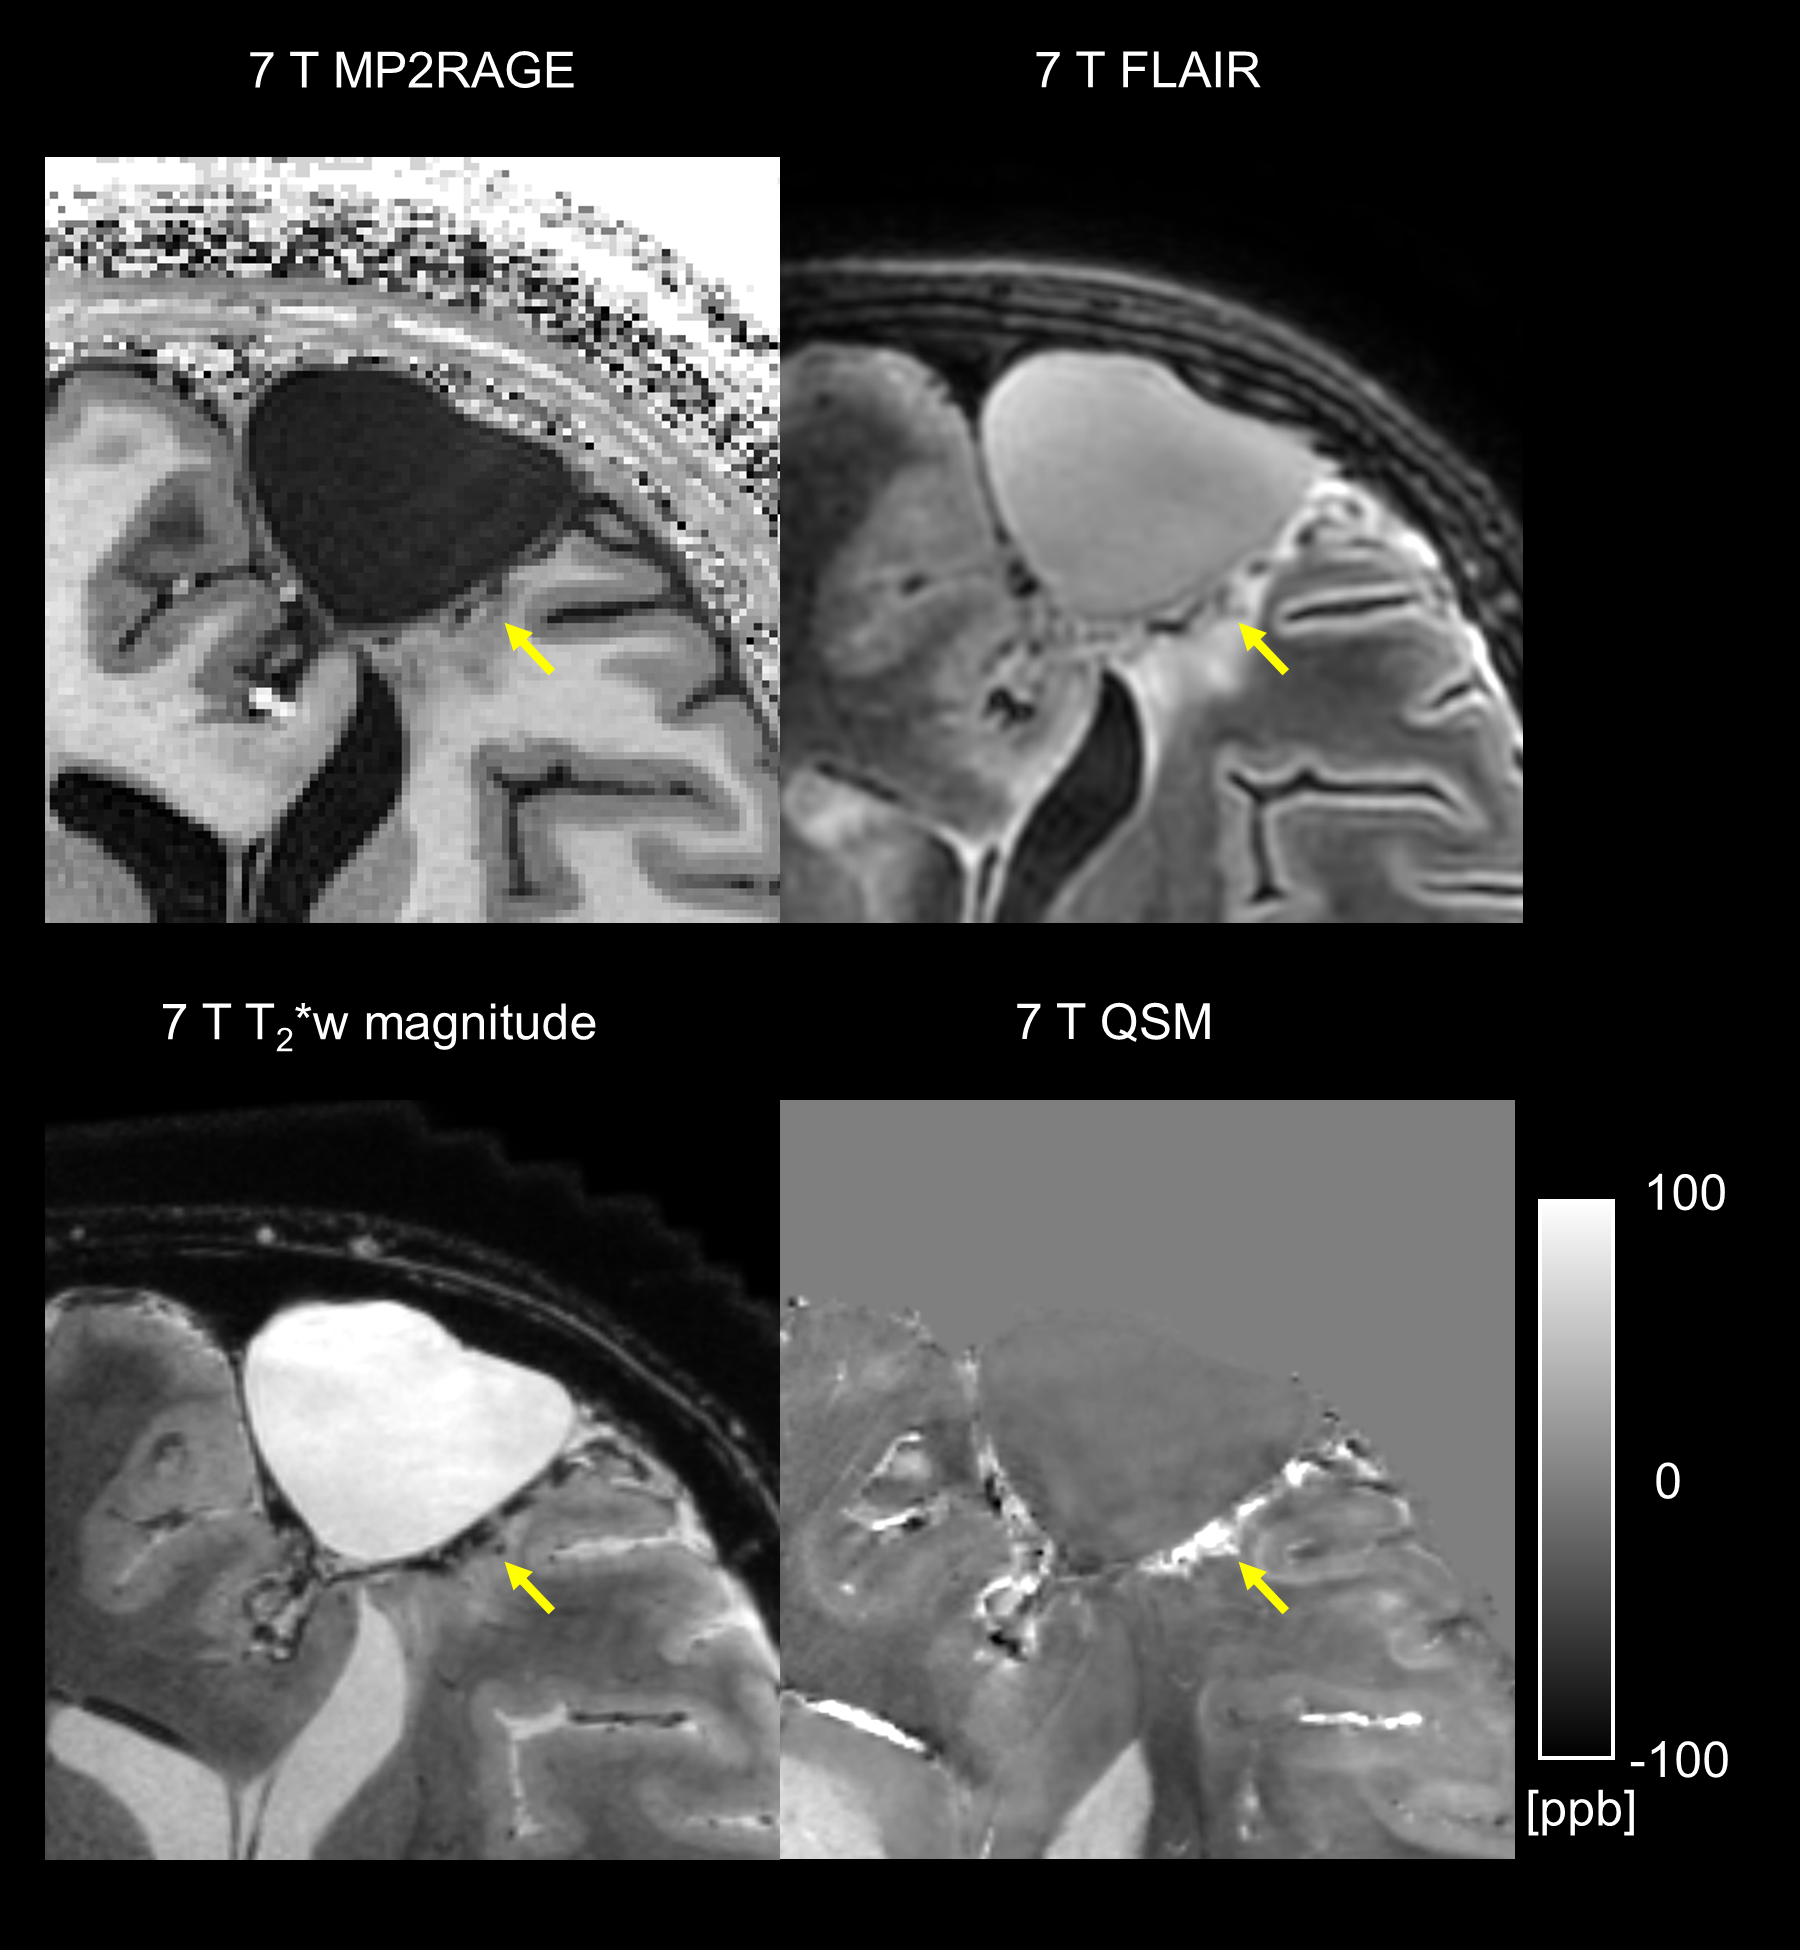
Fig. 3 Improved detection of surgical bleeding using high-resolution (isotropic 0.5 mm) T2*-weighted (T2*w) magnitude and QSM from the data T2*w data. Arrows point to the border of the resection zone with increased bleeding.
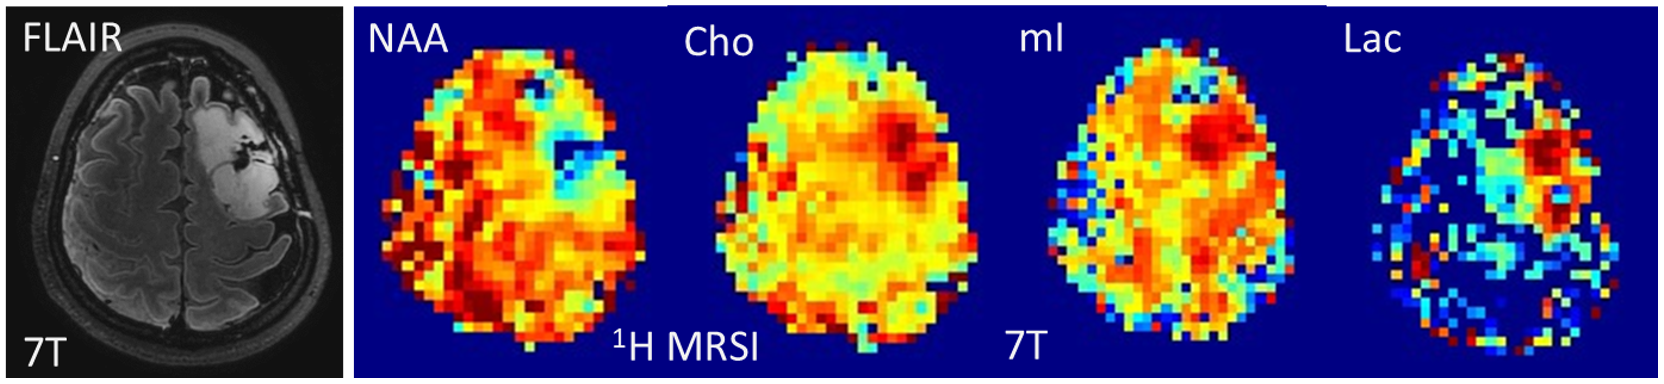
Fig. 4 7T FLAIR and 1H MRSI of a low grade oligodendroglioma indicating reduced N-acetyl aspartate and elevated choline, myo-inositol and lactate in the tumor region. These images show a sub-division of the tumor into two metabolically distinct parts.